Bitcoin is pushing into a zone that often forces a decision: breakout continuation or another failed rally. With price rebounding toward prior resistance and traders split on whether the broader trend is still bullish, one market question stands out now: is this move strength, or a trap?
According to Crypto Rover, the answer leans bearish in the near term. The analyst argues that Bitcoin is retesting a historically important resistance area just as a recurring calendar signal around May 4 reappears, a setup he says has preceded major downside moves in past bear markets.
Crypto Rover’s core thesis: Bitcoin is retesting resistance, not confirming a new leg up
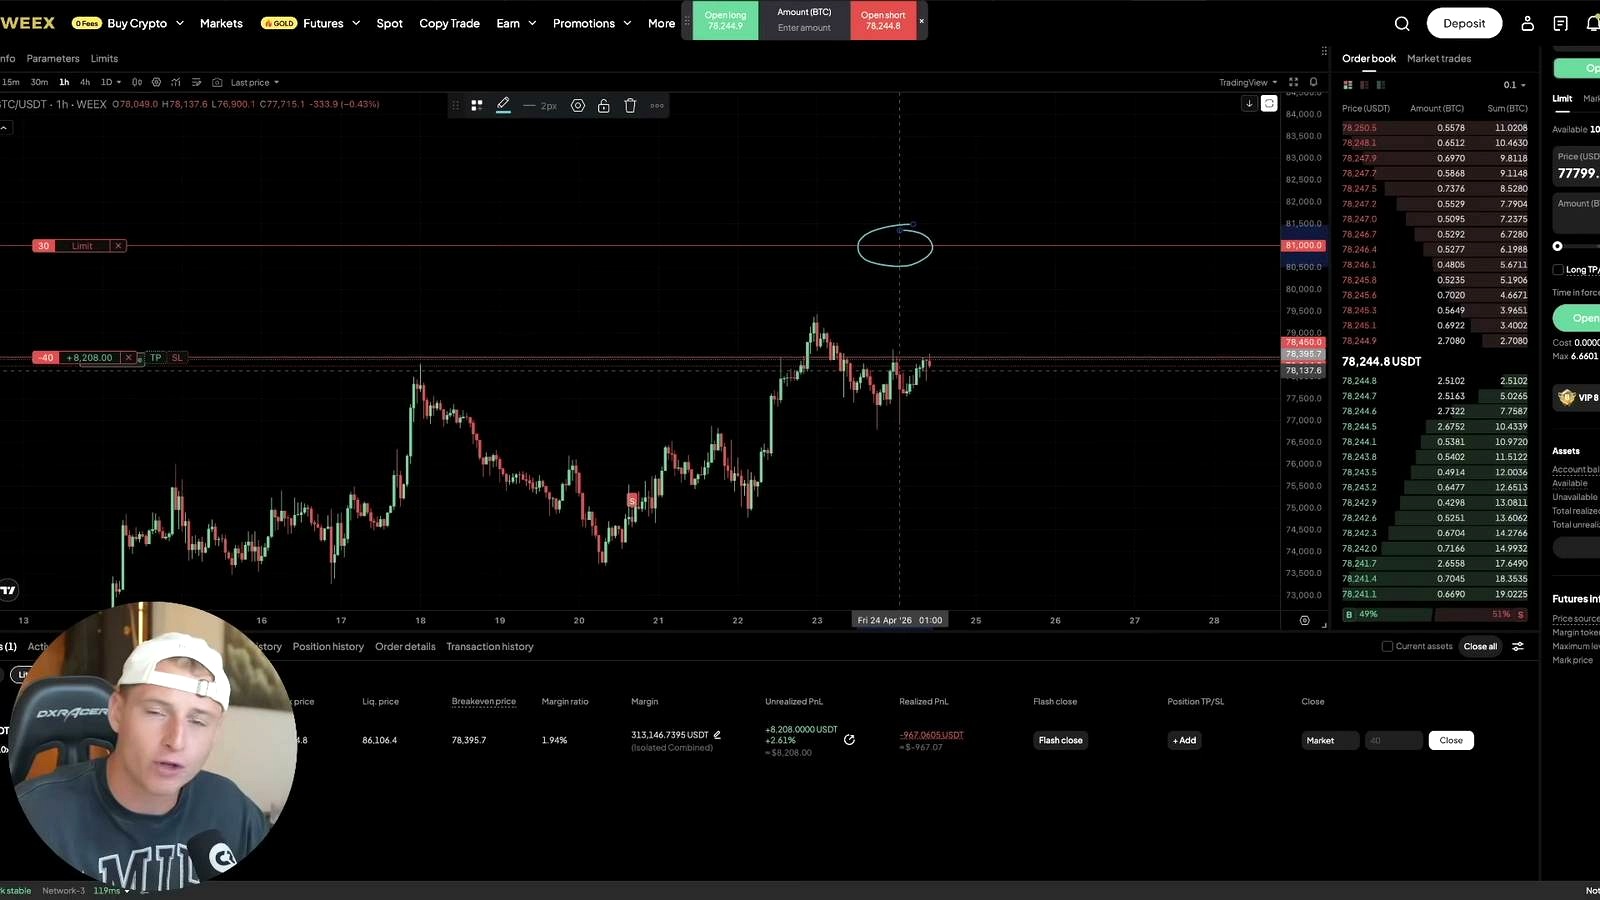
According to Crypto Rover, Bitcoin’s current rally is entering a high-risk zone rather than opening a clean path higher. He said he remains in a Bitcoin short with roughly $8,000 in profit, with an average entry around $78.4K, and still has additional short orders near $81,000. His base case is that Bitcoin could squeeze “a little bit higher” first, driven by negative funding rates and top-side liquidity, before turning lower.
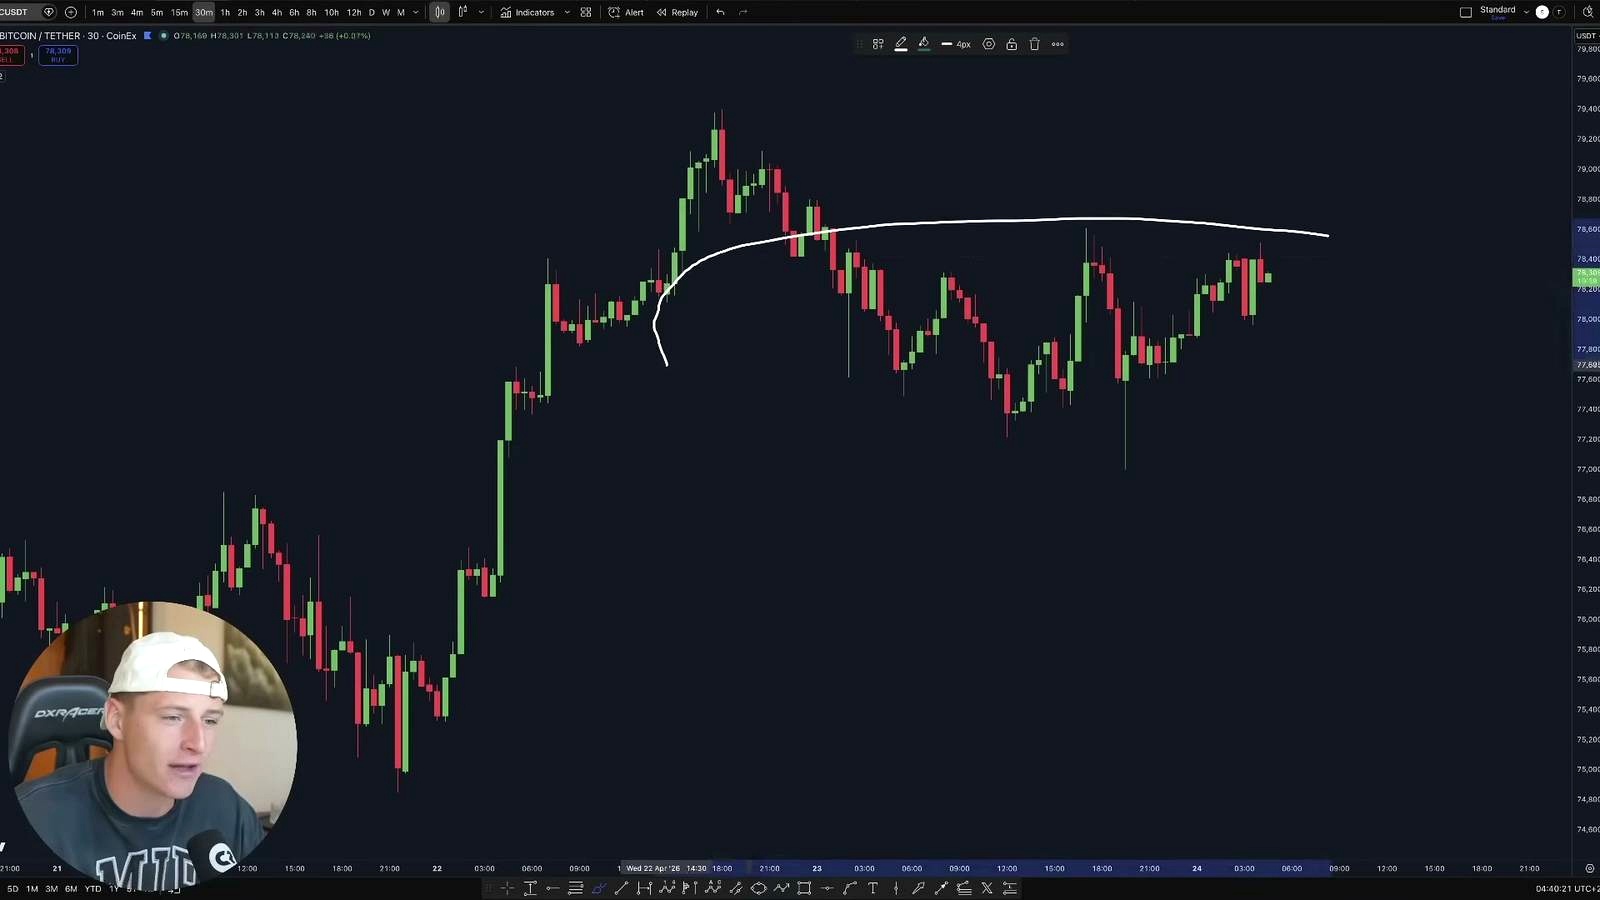
The analyst’s near-term resistance target for the latest breakout sits between $78,000 and $81,000. He linked that zone both to a prior symmetrical triangle target and to what he described as a major resistance test tied to the bull market support band and the 200 average price on the 3-day chart. In his framing, this area has repeatedly acted as a pivot in prior cycles: support in bull phases, rejection in bear phases.
That stance is more cautious than the broader crypto mood that often accompanies a strong bounce into resistance. In general market terms, this is a contrarian short-term view when sentiment is recovering and perpetual futures funding is negative. Negative funding can support the bullish case because it shows crowded shorts are paying longs and can get squeezed. But it can also fit Crypto Rover’s interpretation: a final squeeze into overhead supply before a reversal.
The larger challenge to his thesis is structural. Bitcoin has spent much of this cycle behaving differently from classic bear-market templates, especially when institutional demand, ETF flows, and macro liquidity conditions are supportive. That makes simple analog comparisons to 2018 or 2022 less reliable unless price also starts failing at key trend levels on higher time frames.
The setup behind the warning: May 4, bearish divergence, and a possible liquidity sweep
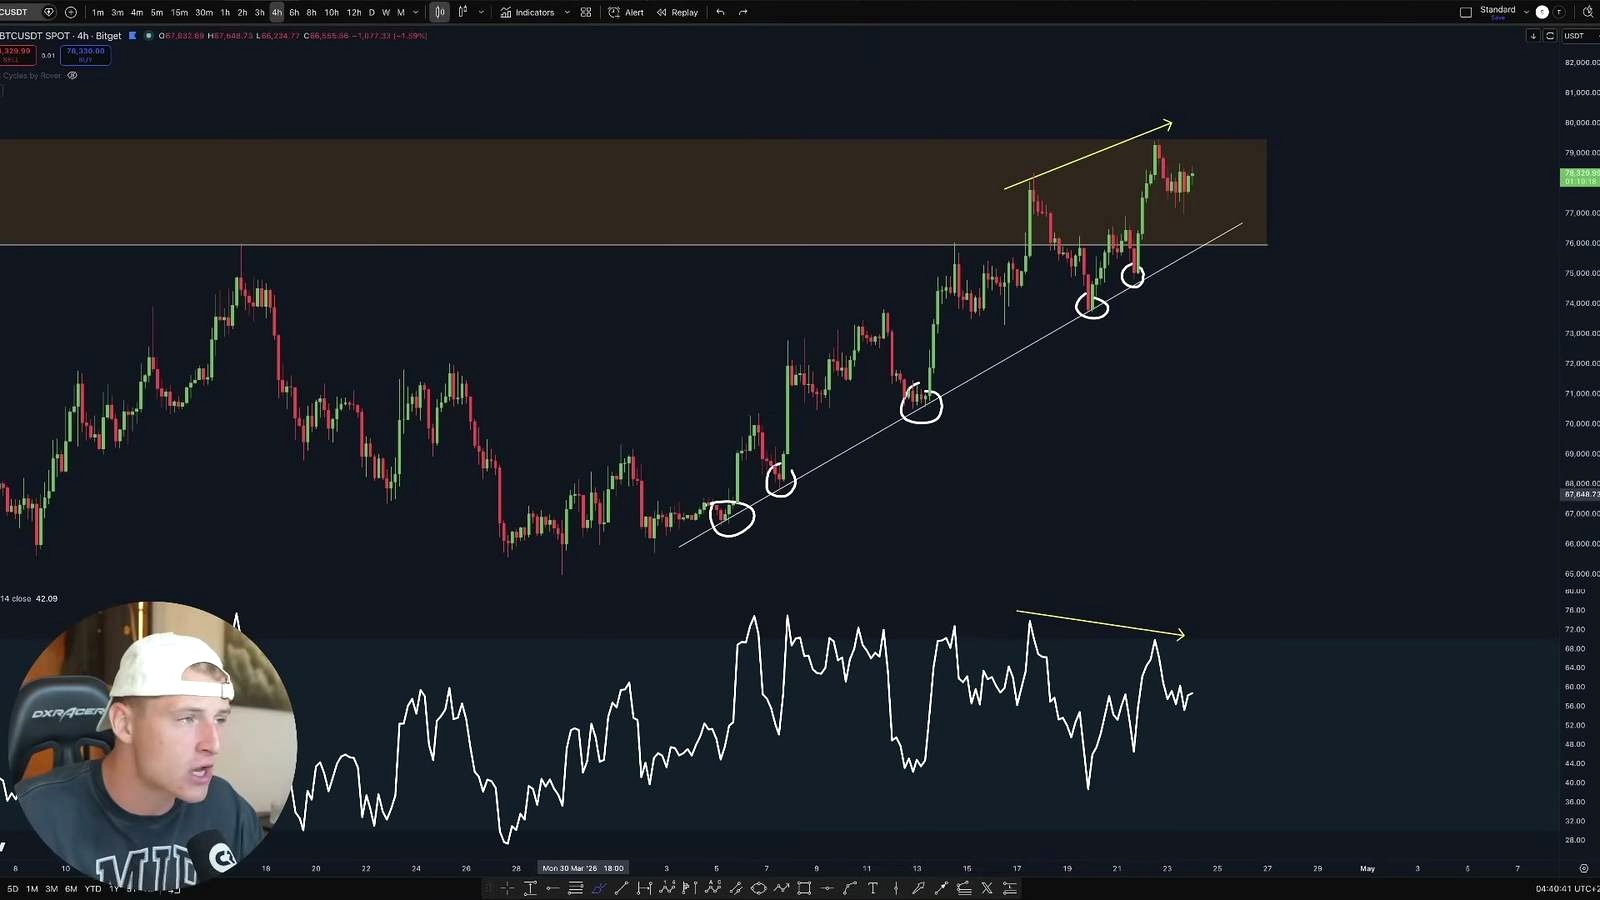
Crypto Rover’s secondary argument rests on a cluster of signals rather than one standalone indicator. First, he said Bitcoin is confirming a bearish divergence on the 4-hour time frame. Second, he said price has already broken out of a symmetrical triangle and is now entering his resistance zone. Third, he argued that top-side liquidity and negative funding rates increase the odds of a brief push higher before a move down.
That makes his trade logic fairly specific. He is not calling for an immediate collapse from current levels. Instead, he appears positioned for a final squeeze that could reach or slightly exceed the upper part of the $78,000 to $81,000 band before reversing. He said he would lock in some profits on the long side if positioned in that breakout, while using short exposure to hedge spot Bitcoin accumulated earlier.
That hedge is central to his strategy. According to Crypto Rover, he accumulated spot Bitcoin below $75K and bought every day below $70K. Because of that existing long exposure, he said he is now using shorts as protection in case Bitcoin falls back toward $60K. He added that he is not accumulating spot at current levels because he sees Bitcoin as overextended.
The bigger swing call is even more aggressive. The analyst said he believes Bitcoin’s eventual bottom is most likely to form between $45K and $60K, and that if price returns to that area, it could become a leverage-long opportunity. He also highlighted a “bear flag” retest on the weekly structure and said he expects Bitcoin to move back toward key moving averages, which he views as the major support area.
His May 4 argument is based on historical pattern recognition. He said that in 2018, May 4 marked the end of a bear-market rally and the start of a major downturn. He made the same comparison to 2022, when Bitcoin, in his telling, saw a major correction after that date. He cited a drop of about 35% in 7 days in 2022 and roughly 30% in 23 days in 2018.
What could go wrong with this bearish thesis
The obvious risk is that Bitcoin is not in the kind of market regime the analyst assumes. Crypto Rover repeatedly describes the current environment as a bear market. If that framing is wrong, and if the market is instead in a broader bullish continuation with intermittent sharp pullbacks, then shorting into negative funding and overhead liquidity can become dangerous quickly.
A clean reclaim of the resistance band he identified, especially if Bitcoin holds above roughly $81,000 rather than merely wicking into it, would weaken the immediate short thesis. The same is true if the bull market support band flips decisively back into support instead of acting as resistance. In that scenario, the bearish divergence on the 4-hour chart may matter less than the higher-time-frame trend.
There are also risks the analyst did not fully explore. Calendar analogs like May 4 can be seductive because they appear precise, but small sample sizes are weak evidence on their own. Two prior instances do not establish a robust rule. Market structure, leverage, macro conditions and institutional participation differ materially from one cycle to the next.
The other side of the trade is straightforward: if price squeezes through top-side liquidity, forces short covering, and then consolidates instead of rejecting, bears could become fuel for another leg higher. In crypto, failed breakdowns and failed rejections often move faster than the original setup. That matters for anyone trying to fade strength at a widely watched level.
What to watch next
The first trigger is whether Bitcoin rejects inside the $78,000 to $81,000 zone or starts accepting above it. A brief liquidity sweep into $81,000 followed by a fast reversal would fit Crypto Rover’s setup. A sustained move above that area would not.
Traders will also be watching whether the bearish divergence on the 4-hour chart resolves lower, and whether the weekly structure keeps resembling the bear flag the analyst described. The calendar matters too: his framework puts special emphasis on May 4 as a pivot date. If that date passes without a meaningful breakdown, confidence in the analog should fade quickly.
FAQ
What is the Bitcoin bull market support band?
It is a popular technical indicator built from moving averages that traders use to judge whether Bitcoin is in a stronger bullish trend or losing momentum. When price holds above it, many chart watchers see that as constructive. When price falls below it and later retests it from underneath, the band can act as resistance.
What does negative funding rate mean for BTC traders?
Negative funding means short positions are paying long positions in perpetual futures markets. It usually signals that bearish positioning is crowded. That can support a short squeeze if price rises, but it does not automatically mean Bitcoin must go up.
What is a bearish divergence on the 4-hour chart?
A bearish divergence happens when price makes a higher high or pushes into resistance while momentum indicators fail to confirm with stronger highs. Traders often read it as a sign that upside momentum is weakening, though it is not a guarantee of reversal.
How is a hedge different from outright bearish positioning?
A hedge is meant to offset risk in another position. In this case, the analyst said he is shorting partly because he already owns spot Bitcoin bought below $75K and below $70K. That is different from a trader who is net bearish and has no long exposure to protect.
What happened in past Bitcoin cycles after major resistance retests?
Historically, failed retests of major moving-average bands or prior support zones have often led to deeper drawdowns, especially in confirmed bear markets. But in stronger bull cycles, those same retests can turn into continuation setups if price reclaims the level and holds above it.
Source Video

John Burnell focuses on Bitcoin infrastructure, wallet security and blockchain technology. He writes educational articles explaining how Bitcoin works and how the technology evolves.


