Bitcoin is trading at around 74K, and the current move is being compared with prior midterm years. The main view is that Bitcoin may have found a low in February, rallied into March, and could still be following a familiar bear market structure.
While some indicators appear more bullish than others, the broader pattern remains centered on historical midterm year behavior. That includes the possibility of a March rally forming a macro lower high before further weakness later in the year.
Bitcoin in Midterm Years
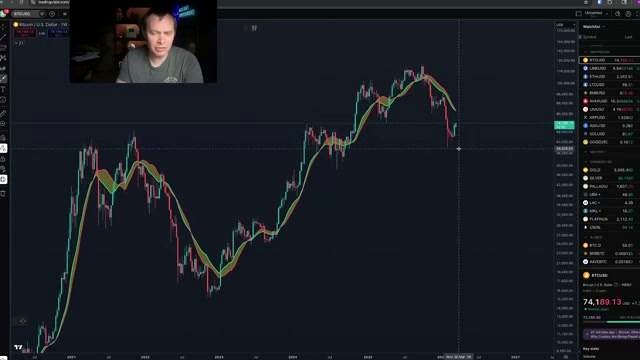
The most likely outcome discussed for Bitcoin in midterm years is to find a low in February and then build off that low for a while. This pattern is noted in 2026, 2022, 2018, and 2014.
So far, the current year has not yet been different from prior midterm years. The year-to-date ROI, when overlaid against the historical average for Bitcoin in midterm years, is still well within one standard deviation of that average.
- Low in February
- Rally into March
- Potential macro lower high
- Tracking broadly in line with prior midterm years
Why the Current Rally Feels Uncertain
Even when a rally is expected, it does not make the move easier to interpret in real time. A common question during these rebounds is whether the low is already in or whether another low still lies ahead.
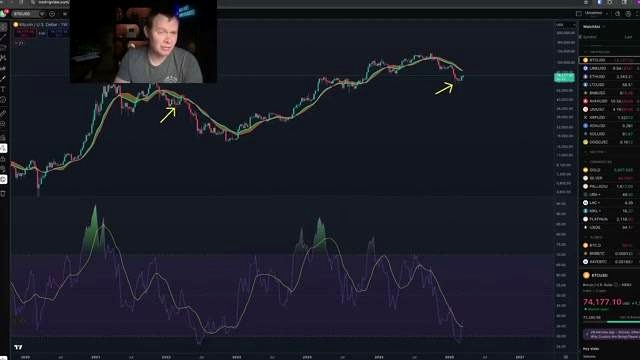
Some indicators are more confident in the low being in than others. The relative strength index has been very low for a while on multiple time frames, which supports the idea that a low may have formed. At the same time, some bear market bottom indicators still leave something to be desired.
Indicators That Look More Bullish
The relative strength index has remained very low across multiple time frames. That behavior can support the idea that Bitcoin has already formed a meaningful low.
Indicators Still Leaving Questions
On the terminal price chart, Bitcoin normally goes below the realized price and the balance price in bear markets, and neither of those has happened yet. The MVRV Z-score also typically drops below zero in midterm years, while the current bounce is happening at the same spot it bounced at in 2019.
This is one reason the 2019 comparison continues to come up. The current reality may still be following a similar path, even if the exact route remains unclear.
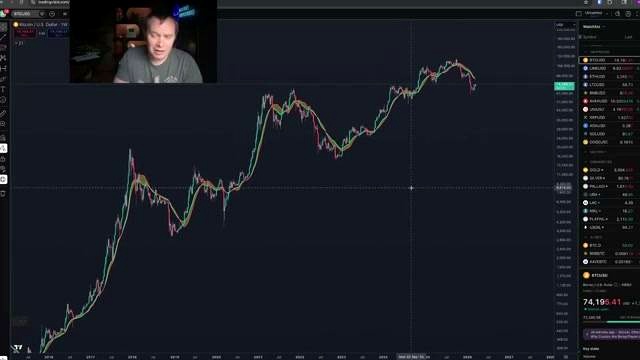
Bear Market Resistance Band and Price Structure
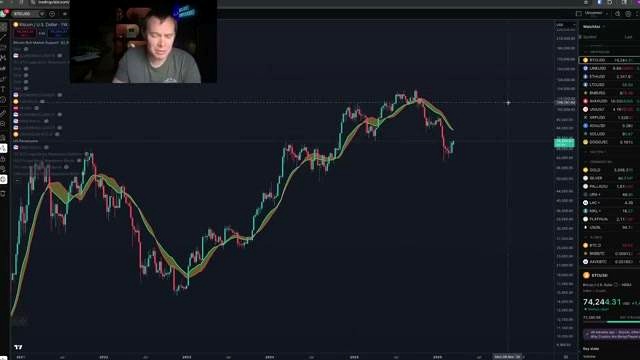
The bear market resistance band is currently around 82K to 83K. Bitcoin could move as high as 80K, or even a little above it, and still not actually break through the broader bear market structure.
When connecting the dots on the chart, Bitcoin is still respecting a lower high structure. Prior bear markets also showed a series of lower highs before the structure finally ended.
What the 82K to 83K Zone Means
This range is a key area to watch because a move into it would still fit the broader lower high pattern. A close above the band does not automatically mean the structure has changed, especially if that move is not sustained.
That kind of behavior was seen in 2022, when Bitcoin briefly moved above the bear market resistance band but did not maintain the breakout.
Can Bear Flags Break Up Instead of Down?
The current structure looks like a bear flag, and that interpretation is acknowledged. However, not all bear flags have to break down. At the end of the last bear market, one could argue that a bear flag broke up rather than down even though most of the others had broken down during the broader decline.
Even so, in a bear market, Bitcoin would generally be expected to go no higher in a durable sense above the bear market resistance band.
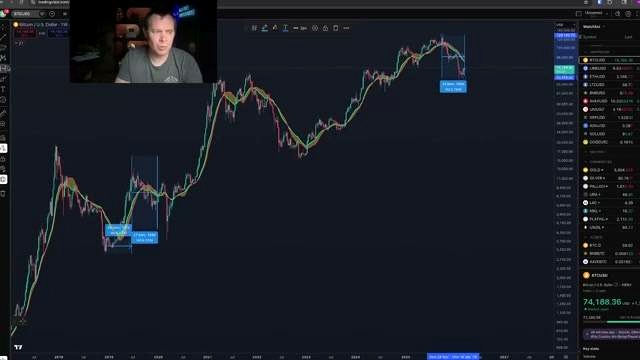
The 2022 Comparison
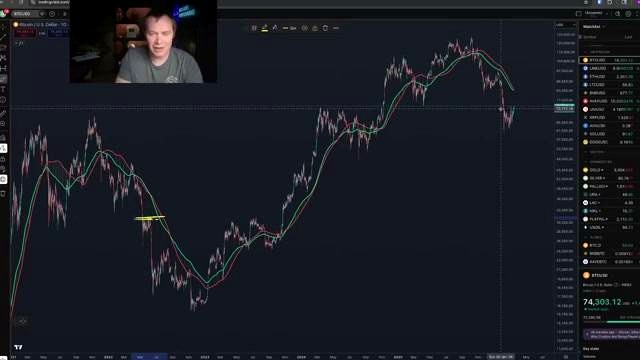
The similarities between the current market and 2022 are considered striking. In 2022, Bitcoin set an initial low, then a higher low during a major geopolitical conflict, rallied back to the highs set in early March, swept those highs for a while, and then moved lower into April and May.
A similar framework is being used for the current year. The idea is that Bitcoin may be replaying that setup: an initial low, a higher low during a major geopolitical conflict, a return to early March highs, and a sweep of those highs before another move down.
Key Similarities to 2022
- Initial low is established
- Higher low forms during a major geopolitical conflict
- Price returns to early March highs
- Those highs are swept for several days
- The possibility remains that price later moves back down
In 2022, Bitcoin rallied above the early March high and then came down into May. A similar move could happen again, including a rally into the bull market support band followed by another decline.
Why March Matters for Bitcoin
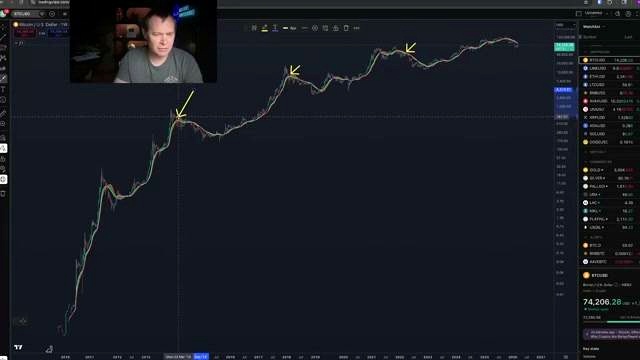
Bitcoin normally finds a high in March during these midterm year patterns. The examples highlighted include March 2022, March 2018, and March 2014, with early April also mentioned as a possibility in some cases.
Because of that, it is difficult to ignore the possibility that Bitcoin is now forming a lower high in March. That has been presented as the most likely outcome: lows in February, a rally into March, and then a macro lower high.
Historical Pattern
- Bitcoin finds lows in February
- Bitcoin rallies into March
- Bitcoin forms a macro lower high
This pattern is described as the normal cycle behavior for midterm years, even if the exact timing and path can vary.
The 2019 Comparison and Timing Differences
Some people compare the current market to 2019 and argue that the downturn then lasted around six months before turning around. The current low, however, is said to be about 17 weeks rather than 24 weeks.
At the same time, the length of the uptrend back then, excluding the pandemic, was similar to the length of the downtrend. That suggests the downtrend should not simply be expected to last 24 weeks just because 2019 did.
Instead, the expectation is that the downtrend may last a little longer, in a way that is commensurate with how long the uptrend lasted. This period is described as a digestion phase in the midterm year following a post non-euphoric, post-apathetic top.
Lower Highs Can Continue for a While
The 2019 comparison also shows that several lower highs can occur before any real break in structure. Even when Bitcoin did break through, it still ended up being a fakeout and a lower high.
Back then, there were multiple lower highs before the breakout attempt. In the current bear market, the structure may not yet have progressed that far, which supports the idea that another rejection could still happen going into summer.
Market Psychology During Countertrend Rallies
During rallies like the current one, many market participants change their view quickly. Bears can flip to bulls during the rebound, then flip back again if price gets rejected.
The focus here remains on what has normally happened. In prior midterm years, these rallies tended to form lower highs, and that is still viewed as the most likely outcome unless price proves otherwise.
There is always the possibility that this time is different, but the recurring pattern has been difficult to ignore. Bitcoin topped in Q4 of last year despite claims that the cycle was different, and it found a low in February just like it often does.
Opportunity Cost and Other Markets
One way to get through midterm years is by investing in other markets. That is framed as one way to deal with FOMO while still maintaining some Bitcoin exposure.
Bitcoin this year has been bleeding against several other assets:
- Bitcoin versus the S&P 500: down 13%
- Bitcoin versus energy: down 34%
- Bitcoin versus gold: down 27%
- Bitcoin versus silver: down 25%
The point is not simply that cash can be better than crypto in midterm years, but that cash is not necessarily better than other things in midterm years. This brings opportunity cost into the discussion when thinking about the markets.
Additional Updates
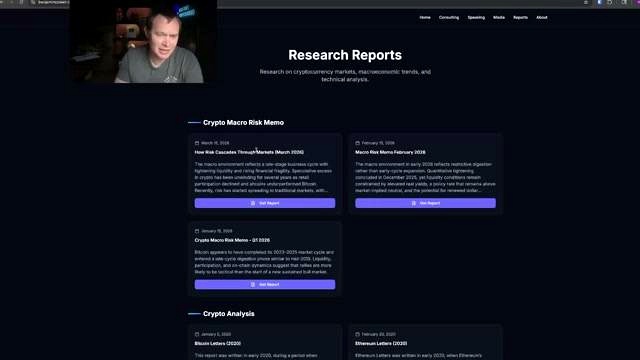
The March Madness ITC bracket challenge is open again, as it has been for the last four or five years. The winner receives a free one-year subscription to ITC Premium.
A new risk memo titled How Risk Cascades Through Markets has also been published and is available for free at benjamincowan.com. ITC Premium is available at intothecryptoverse.com.
FAQ
What is the main Bitcoin outlook for this midterm year?
The main outlook is that Bitcoin likely found a low in February, rallied into March, and may form a macro lower high, which would be consistent with prior midterm years.
What price is Bitcoin trading around in this discussion?
Bitcoin is trading at around 74K.
Where is the bear market resistance band?
The bear market resistance band is currently around 82K to 83K.
Does a move above the bear market resistance band confirm a breakout?
No. A close above it can happen, but it may not be sustained, as seen in 2022.
Why is March considered important for Bitcoin?
March is important because Bitcoin has often found a high in March during midterm years, including examples from 2022, 2018, and 2014.
What is the relevance of the 2022 comparison?
The 2022 comparison is relevant because the current market shows a similar sequence: an initial low, a higher low during a major geopolitical conflict, a rally back to early March highs, and a sweep of those highs.
What does the 2019 comparison suggest?
The 2019 comparison suggests that several lower highs can occur before a true structural break, and even apparent breakouts can become fakeouts.
How has Bitcoin performed against other assets this year?
Bitcoin is down 13% against the S&P 500, down 34% against energy, down 27% against gold, and down 25% against silver.
Where can the risk memo be found?
The risk memo titled How Risk Cascades Through Markets is available for free at benjamincowan.com.
What is the ITC bracket challenge prize?
The winner of the ITC bracket challenge receives a free one-year subscription to ITC Premium.
Original Source

John Burnell focuses on Bitcoin infrastructure, wallet security and blockchain technology. He writes educational articles explaining how Bitcoin works and how the technology evolves.


