This article explains a set of simple but profitable day trading strategies focused on price action and market trends. The systems discussed are continuation systems, meaning they aim to follow the current trend and profit from the current move of the market.
The material begins with core strategy fundamentals and then moves into three structured setups: a Fibonacci and EMA continuation strategy, a fair value gap Fibonacci and EMA continuation strategy, and a “Unicorn” continuation strategy. The overall goal is to use clear tools, defined criteria, and risk-reward principles to trade trends with precision.
Trading Strategy Fundamentals
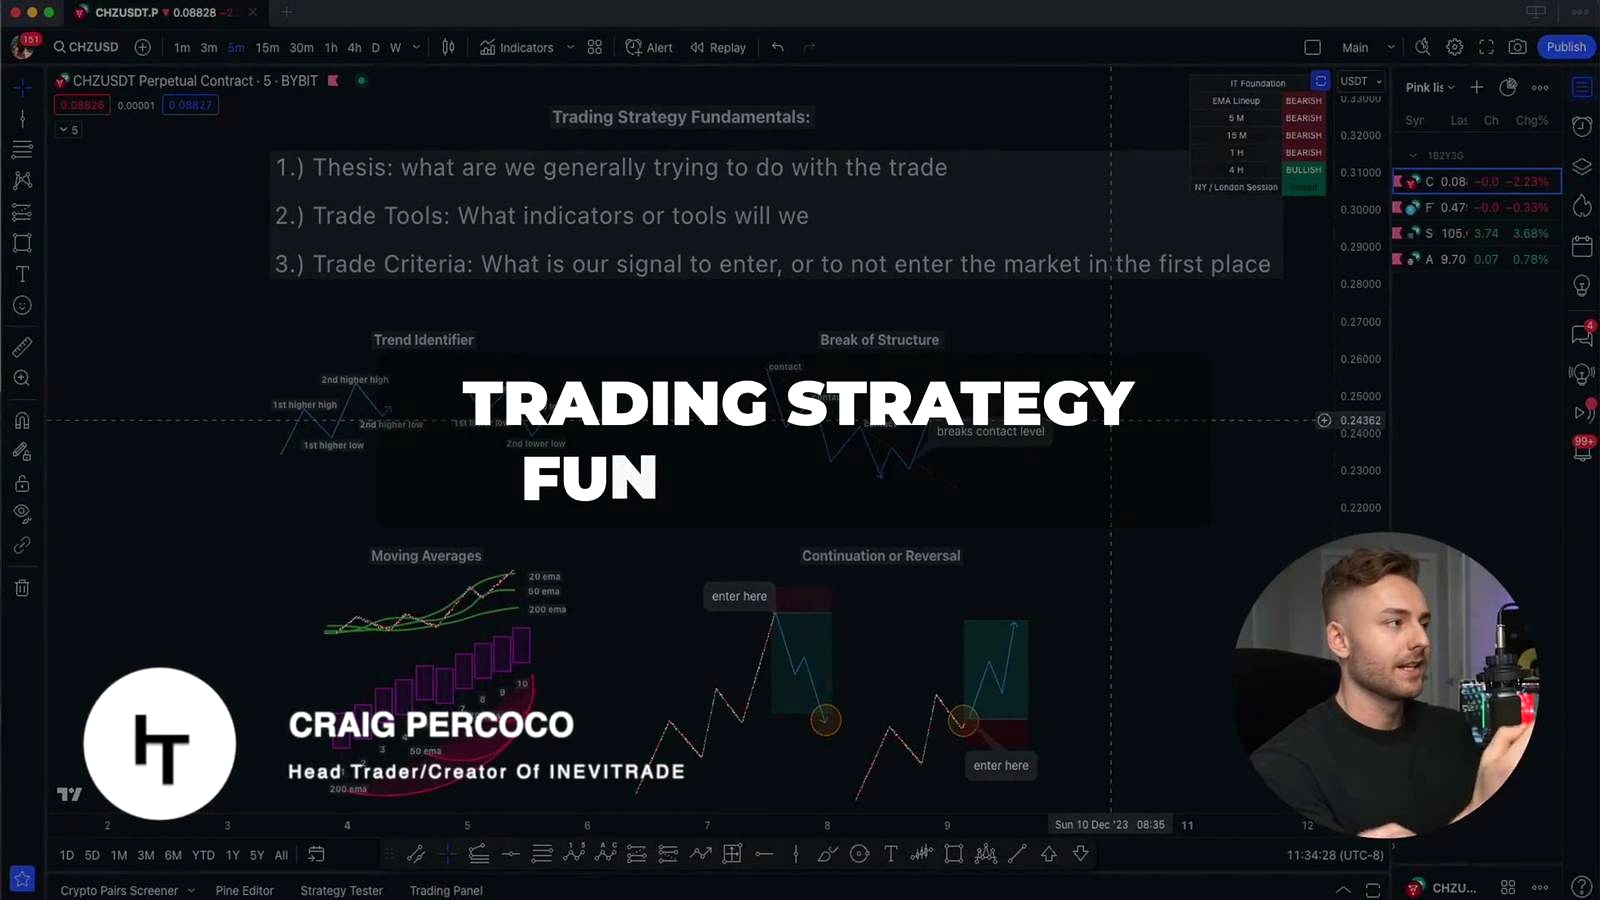
Before using any strategy, three things need to be defined:
- Thesis: What is the goal of the trade? Is the trader looking for a place where price action is going to flip, or trying to play a continuation and follow the trend?
- Trade tools: What indicators and chart tools are needed to quantify entries, exits, and the overall position?
- Trade criteria: What signals trigger an entry, what signals trigger an exit, and what signals mean the trade should be avoided?
The systems described here are continuation systems, so the focus is on following current trends rather than trading reversals.
How to Identify a Trend
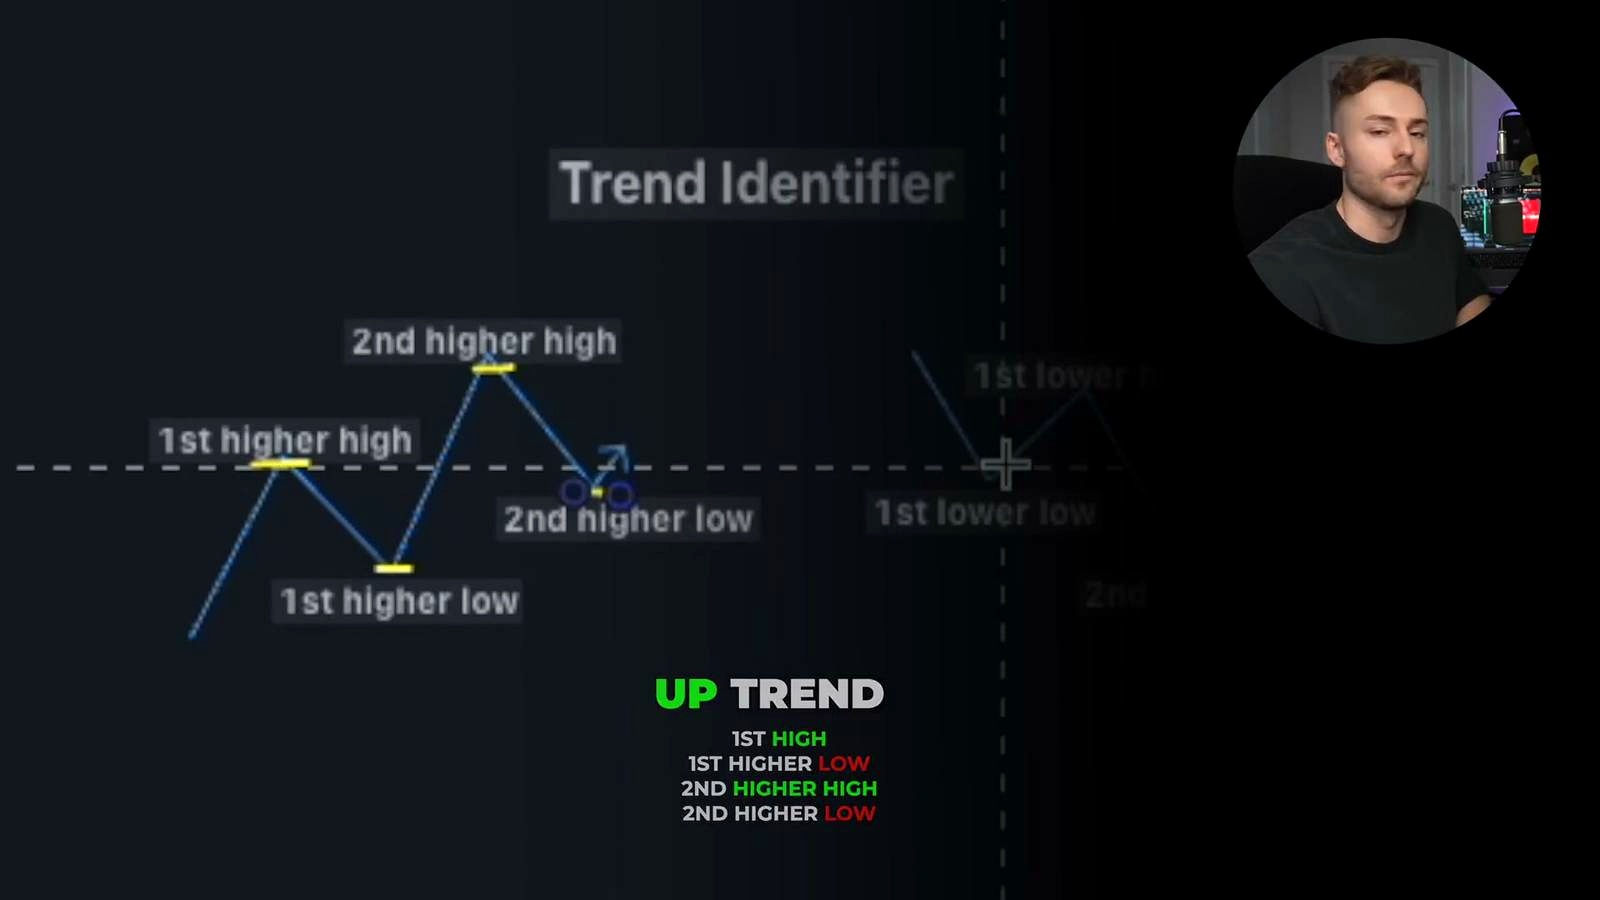
A trend is defined through four points of contact.
Uptrend
- A high
- A low
- A secondary higher high
- A secondary higher low
Downtrend
- A first low
- A lower high
- A second lower low
- A second lower high
Once these four points are present, the trend is considered confirmed. This becomes the foundation for trend-following trades.
Break of Structure
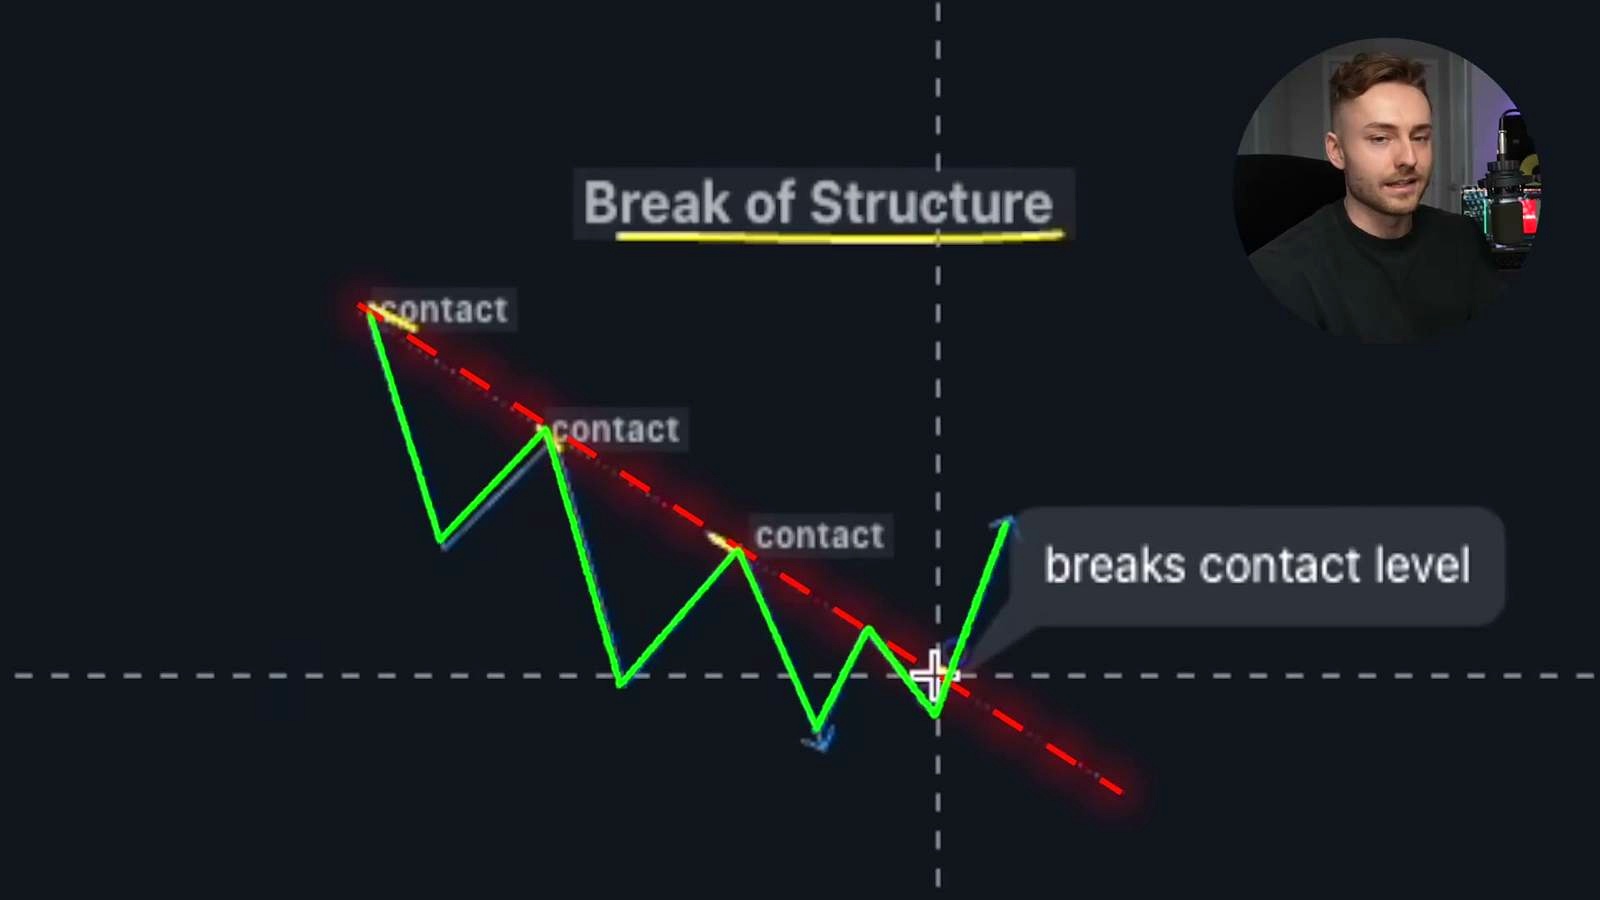
Another key concept is the break of structure. When price has multiple contact points on a trend and then breaks through that level, it can signal the potential start of a new trend. Entering these trends early can help confirm the new beginning of trend direction.
Moving Averages Used
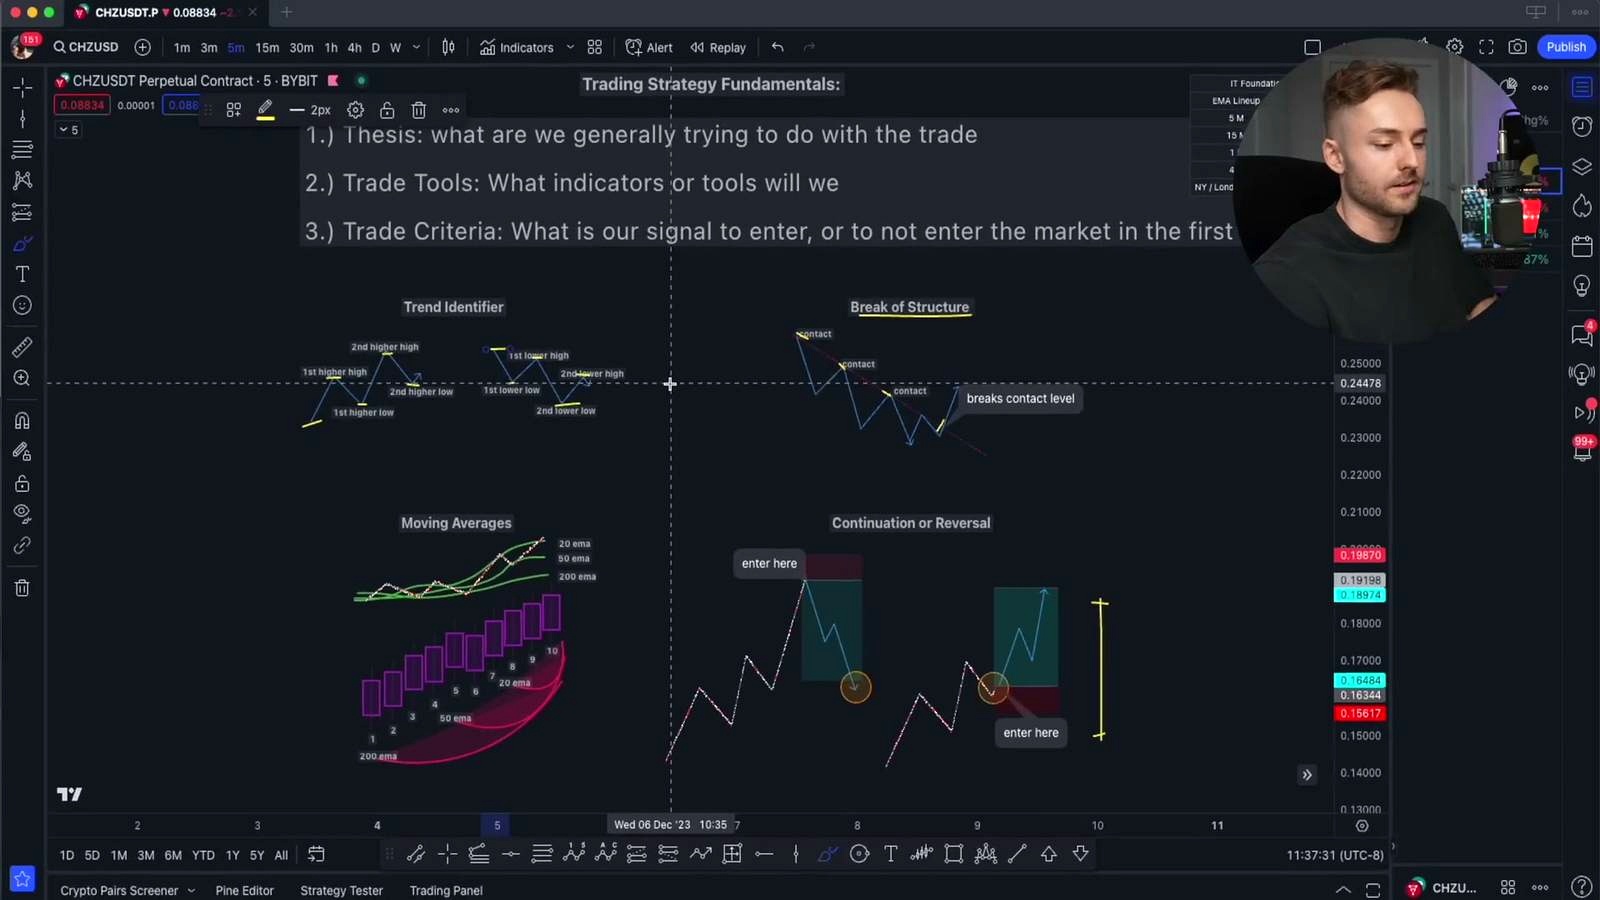
To confirm trend direction, the systems use three exponential moving averages:
- 20 EMA
- 50 EMA
- 200 EMA
The 20 EMA reflects the average of the 20 most recent candles, the 50 EMA reflects 50 candles, and the 200 EMA reflects a larger set of price data with exponential emphasis on the most recent candles.
When these EMAs are stacked on top of each other, they help indicate trend direction. In a positive trend, the 20 is over the 50, and the 50 is over the 200. This suggests strong short-term price action relative to longer-term movement.
Strategy 1: Fibonacci and EMA Continuation
The thesis of this strategy is to confirm a trend and then use Fibonacci tools to identify areas where the market may retrace before bouncing and continuing in the trend direction.
Tools Needed
- Exponential moving averages
- Fibonacci
- Pro Plus indicator
Setup Process
- Confirm the beginning of a new trend using break of structure.
- Confirm higher highs and higher lows for an uptrend, or lower lows and lower highs for a downtrend.
- Check the 20, 50, and 200 EMA alignment.
- Wait for price to retrace.
- Apply Fibonacci to the move.
In an upward move, the one level is the beginning of the trend and the zero level is the high of the move. Fibonacci levels are then used to identify areas where reversals may happen during the retracement.
Particular attention is given to:
- 50 level
- 0.618 level, described as the golden ratio and a full retracement and continuation of a trend
- 0.382 level, which is also used for more accurate Fibonacci projections
Using the Pro Plus Indicator
The Pro Plus indicator adds a gray band. When price drops below the gray band, it creates a highlight signaling that price is undervalued relative to normal volatility. A highlight above can indicate overvaluation or a potential place to begin taking profit.
Entry and Stop Loss
The trade is considered when price comes into the Fibonacci region and begins reversing. For stop loss placement, previous price action is used to find important support or resistance levels. The stop loss is placed underneath important levels on the chart.
Take Profit and Risk Management
One method described for take profit is switching from a 5-minute chart, used for entries, to a 15-minute chart by increasing the timeframe by 3x. A candle close with a highlight on the Pro Plus indicator on the higher timeframe is used as a signal to begin scaling out of the position.
On the 5-minute timeframe, a highlight strip can indicate trend strength and may also be a good time to start reducing risk so that the trade becomes essentially risk-free if price later reverses.
Examples shown include:
- A 4.68 multiple of initial risk
- A 3.22 to 3.5 risk reward
The stated goal for this system is generally anything over a 1 to 3 risk reward.
Strategy 2: Fair Value Gap, Fibonacci, and EMA Continuation
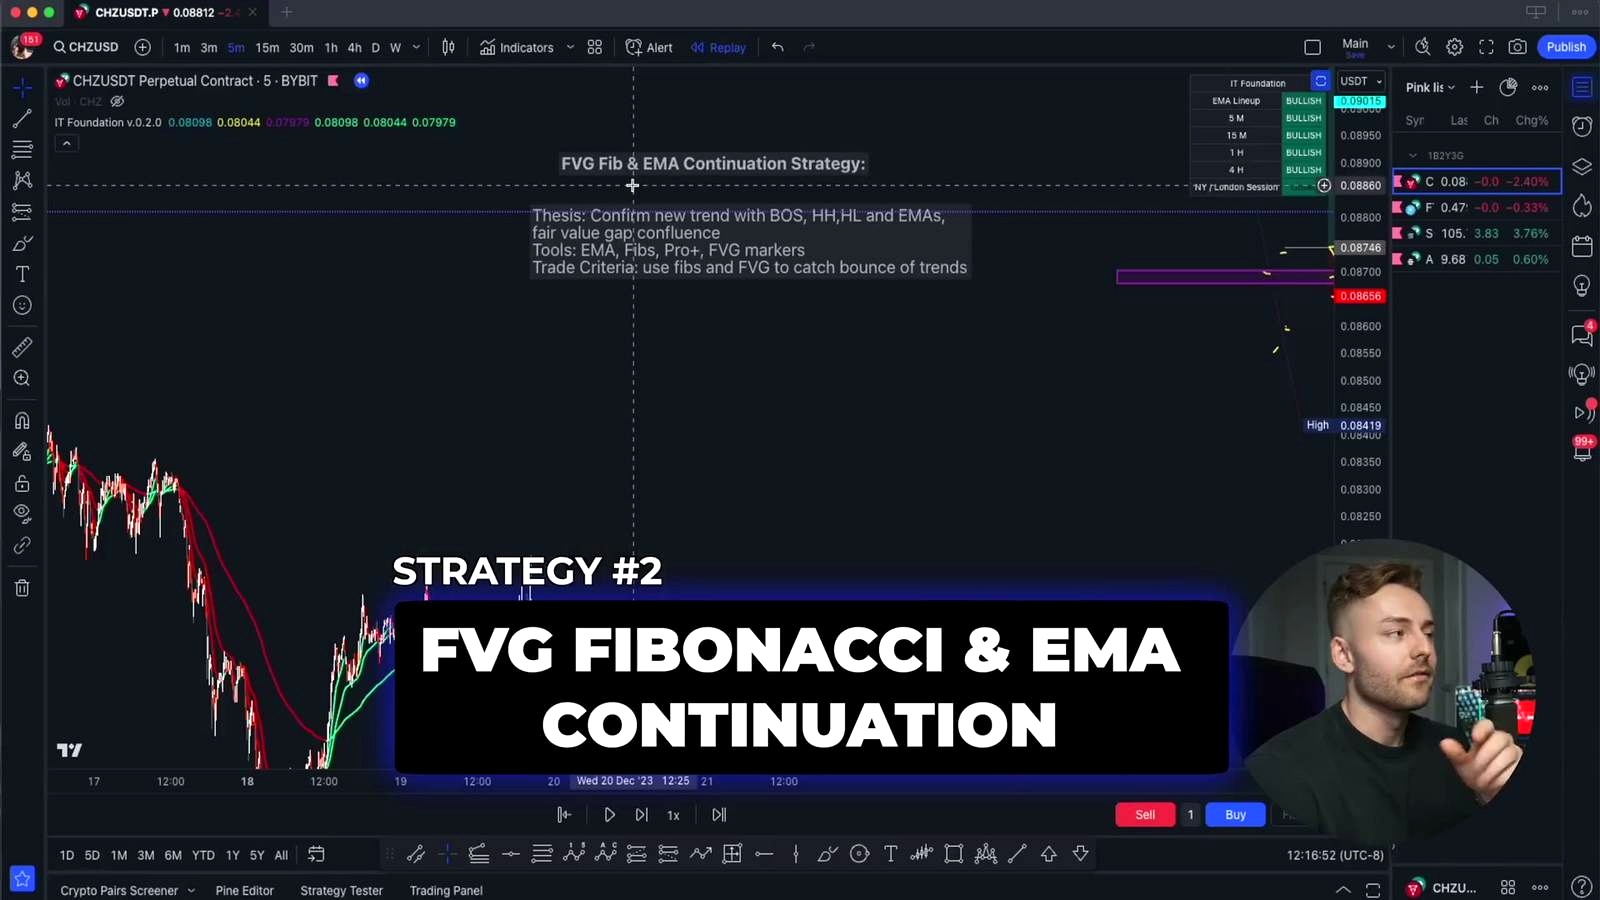
This strategy uses similar principles but adds a fair value gap to increase confluence on trades and help prevent losses.
What Is a Fair Value Gap?
A fair value gap is identified using a three-candle pattern around a breakout. The idea is that when price breaks strongly through an area, there may be a pocket where orders skip through, leaving a zone of liquidity.
For a bullish fair value gap, the first candle’s wick high does not overlap with the third candle’s wick low. The gap is measured between those two levels. These patterns can be evaluated throughout trends.
How It Is Used
- Confirm break of structure and new trend.
- Draw Fibonacci from the most recent low before the moving average flip.
- Look for fair value gaps lining up with Fibonacci retracement levels such as 61.8 or 38.2.
- Use those areas to plan an entry.
- Place the stop loss outside critical levels.
An additional sign of strength is a highlight into entry, which can indicate that the market is undervalued and may flip higher.
Respecting the Fair Value Gap
If candles come into the fair value gap but do not move completely through it, and instead close above the midpoint dotted line, the gap is considered to be respected. If price closes more than halfway through the box or below it, that can signal the fair value gap is being ignored and may not be effective.
Managing the Trade
As with the first strategy, 5-minute highlights can be used to reduce risk, and 15-minute highlights can be used as profit-taking signals. Examples shown include:
- 1 to 5 risk reward
- 3.39 risk reward
- 2.93 risk reward in a comparison example
The approach emphasizes trend continuation rather than emotional decision-making. Volatility is expected, and trades may move strongly in favor, pull back toward entry, and then continue again. The material suggests focusing on the continuation thesis rather than reacting emotionally to each fluctuation.
Strategy 3: The Unicorn Continuation Strategy
The “Unicorn” continuation strategy is used when all confluences line up together. These setups are described as rare, but when they appear, they bring a high level of confluence.
Conditions for a Unicorn Setup
- Confirmation of a new trend
- Moving averages stacked properly
- High, low, high, higher low structure for an uptrend
- Fibonacci retracement lining up with a fair value gap
- Price also coming into the 200 EMA or another longer-term moving average
In the example, a major break of structure created an important fair value gap. The Fibonacci retracement lined up with the median of that fair value gap, and price also came into the 200-day moving average. This combination formed the “Unicorn” element.
Execution
The setup looks for price to pull into that confluence zone, respond from it, and then continue in the trend direction. The stop loss is placed comfortably outside the region. Once the trade begins moving, the first 5-minute highlight can be used to reduce risk, and the 15-minute highlight can be used to close out into strength.
Examples given for these trades include:
- 1 to 5
- 1 to 7
- 1 to 3
Risk Factors and Profitability
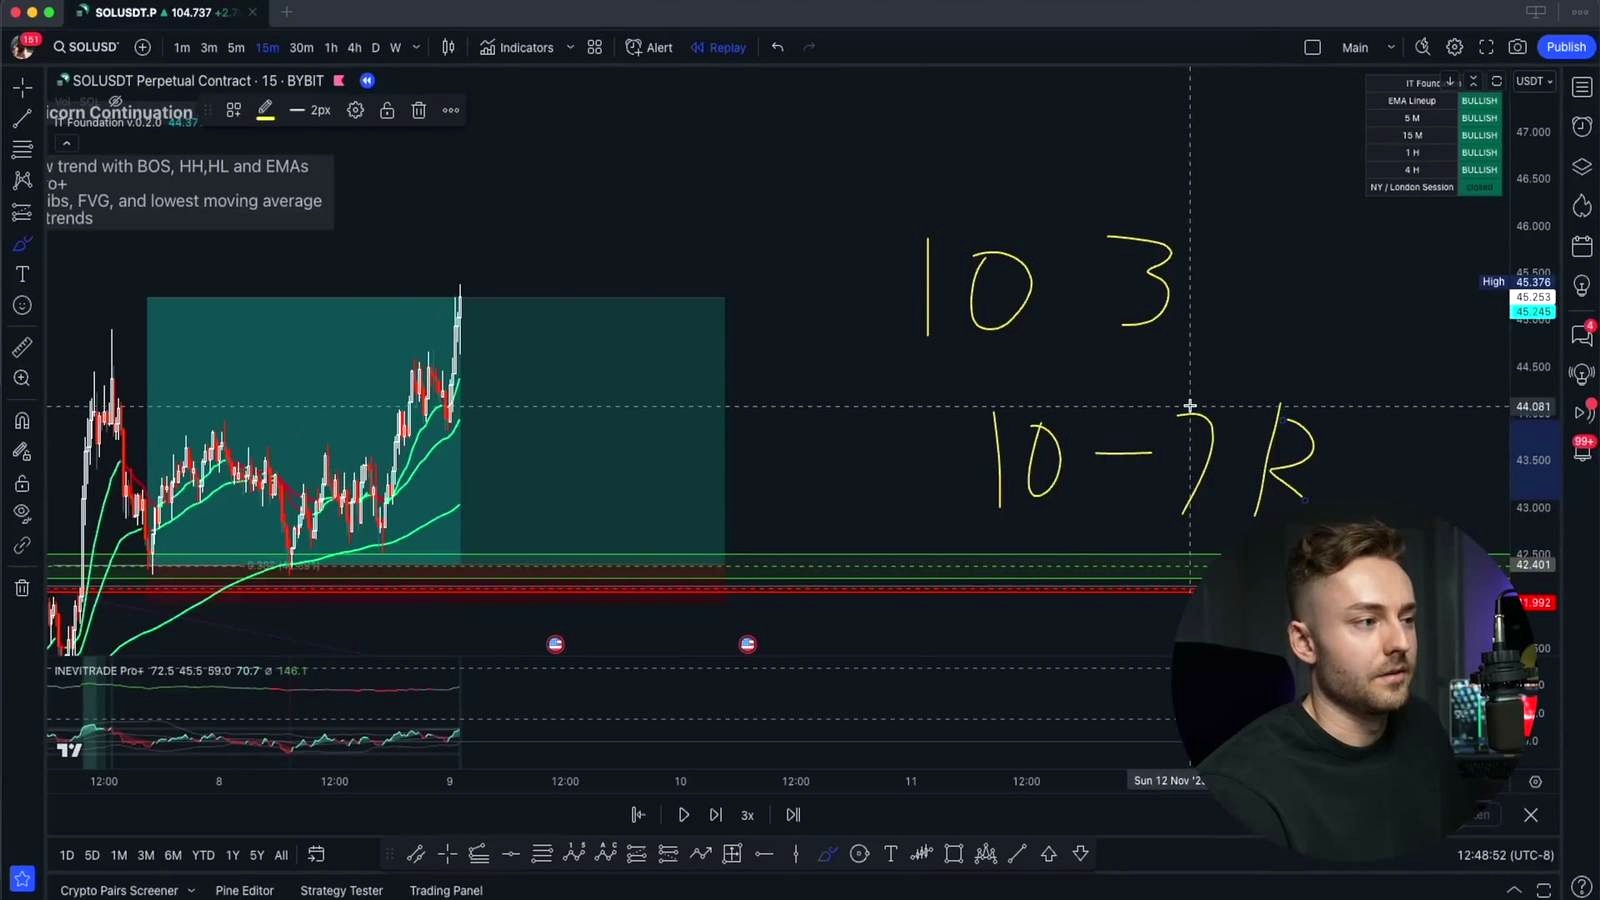
The material emphasizes the power of risk-reward. One example explains that if there are 10 trades with 7 losses, but the winning trades produce 10 positive risk factors, then 10 minus 7 leaves 3 positive risk factors. At $100 per risk factor, that equals $300 in profit.
The point is that profitability can still exist even with a low win rate if the risk-reward is strong enough. The material then explains that the next step is refining the system and improving the win rate through more confluence and better execution.
Improvement Through Tracking
![]()
There is said to be much more to unpack with trading. The material highlights the need to:
- Journal trades
- Track progress
- Learn personal statistics
- Improve over time
Community and Resources Mentioned

The material references a free Discord where trade ideas, free trade alerts, and resources are shared. It also mentions a private education side of the community where real-time trade ideas are discussed and premium students share ideas while working on mastering their trading.
FAQ
What type of systems are described?
They are continuation systems designed to follow current market trends and profit from the current move of the market.
What are the core tools used in these strategies?
The main tools are exponential moving averages, Fibonacci retracement, fair value gaps, and the Pro Plus indicator.
Which moving averages are used?
The systems use the 20 EMA, 50 EMA, and 200 EMA.
How is a trend confirmed?
A trend is confirmed using four contact points. In an uptrend, that means a high, a low, a higher high, and a higher low. In a downtrend, that means a low, a lower high, a lower low, and a lower high.
What is the role of Fibonacci in these strategies?
Fibonacci is used to identify retracement areas where price may reverse and continue in the direction of the trend.
What is a fair value gap?
It is a three-candle pattern around a breakout where the first candle’s wick and the third candle’s wick do not overlap, creating a zone that may act as liquidity and support or resistance.
What is a Unicorn setup?
A Unicorn setup is a continuation setup where multiple confluences line up together, including trend confirmation, EMA alignment, Fibonacci levels, a fair value gap, and the 200 EMA or another longer-term moving average.
How are take profits handled?
The material describes using highlights on the Pro Plus indicator, especially on a 15-minute timeframe, to begin taking profit or scaling out of the trade.
Why is risk-reward emphasized so heavily?
Because strong risk-reward can allow the trader to remain profitable even if many trades lose, as long as the winning trades are large enough relative to the losses.
Source

John Burnell focuses on Bitcoin infrastructure, wallet security and blockchain technology. He writes educational articles explaining how Bitcoin works and how the technology evolves.


