A breakout can be the hardest move to read when the broader trend still looks broken. That is the tension in Bitcoin right now: momentum has turned up, but traders are split on whether this is the start of a real trend reversal or just another bear-market squeeze.
According to Mister Crypto, Bitcoin’s latest move higher can continue in the short term, potentially into the $80,000 to $86,000 area, even as he argues the larger downtrend remains intact and could still drag the asset toward $55,000 or even $48,000.
Short-term breakout, longer-term bearish thesis
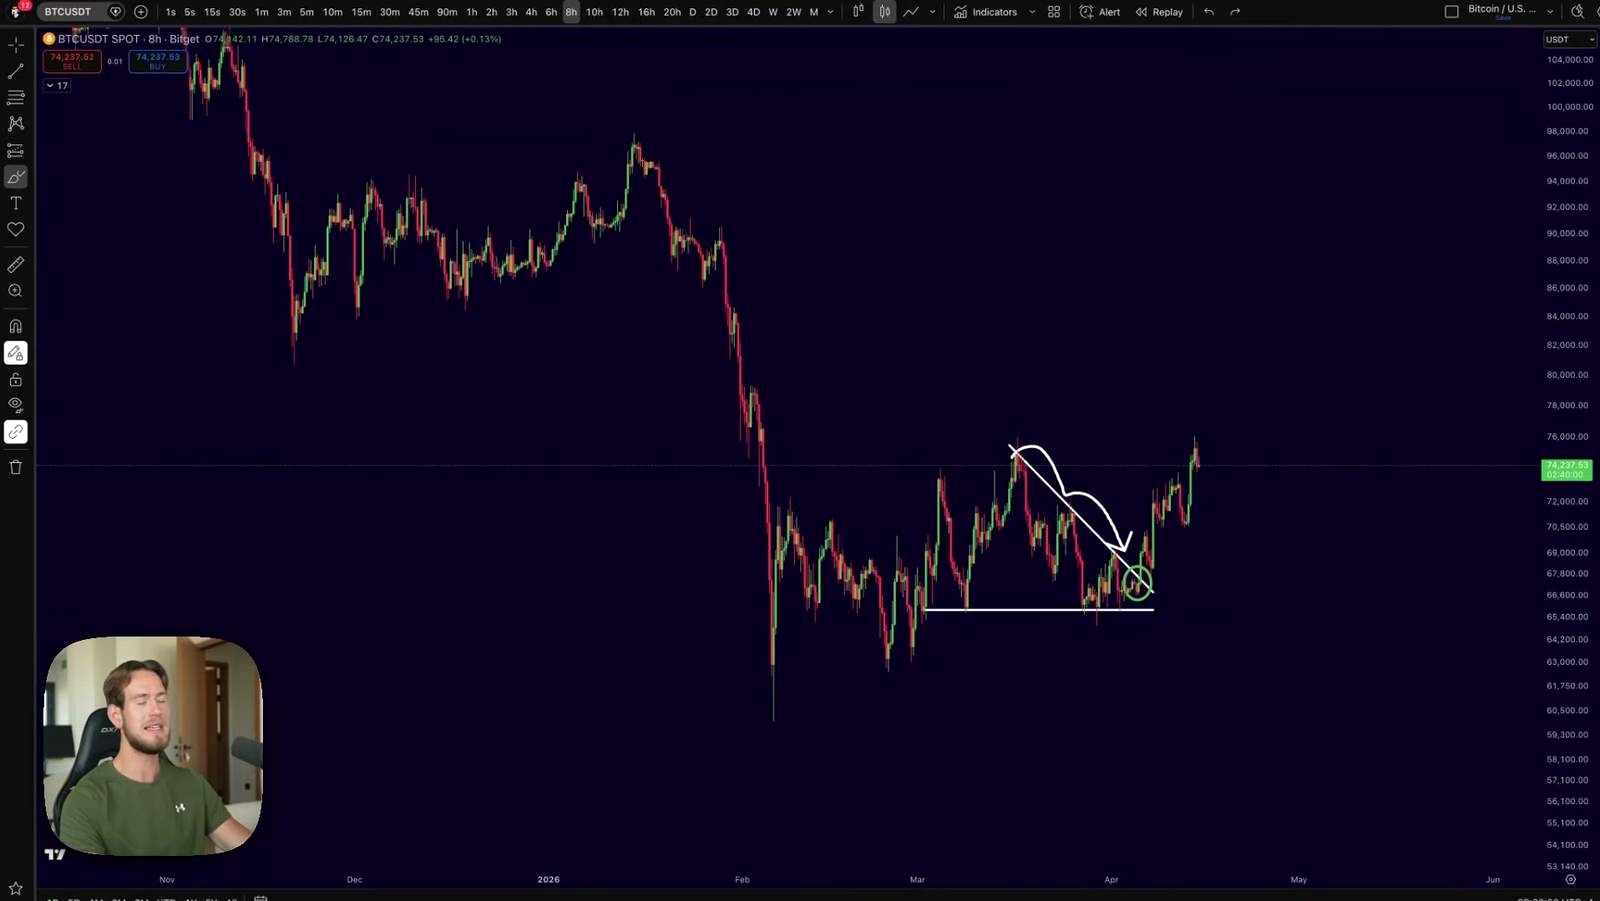
According to Mister Crypto, the current setup is bullish on the shorter time frame but dangerous to chase blindly. His central argument is straightforward: Bitcoin appears to be breaking upward from a long sideways range, and those kinds of consolidations have previously led to large directional moves. In his view, this breakout can stretch further than many traders expect, with upside extending toward a former demand zone now acting as supply between roughly $80,000 and $86,000.
At the same time, the analyst says this is not a full trend reversal. He describes the advance as a relief rally inside a broader bear market and says he is already scaling into short positions from current levels, having started one order at $74,600 and placed another at $76,200, which he said was nearly filled. He also flagged the $77,000 to $79,000 area as a zone where rejection could begin before any move into the higher $80,000s.
That makes the call somewhat contrarian. In a market that often turns euphoric on breakouts, Mister Crypto is effectively arguing for both things at once: near-term upside and medium-term weakness. That split view is not unusual in technical trading. Strong countertrend rallies are common in corrective markets, especially when price becomes stretched below major moving averages and then snaps back toward them.
The broader market context partly supports that framing. Bitcoin often rebounds sharply after liquidation-heavy drops, particularly when funding resets and positioning gets cleaner. But the challenge to this thesis is obvious: if a breakout from a long range is genuine, it can mark trend continuation rather than just a temporary catch-up move. In other words, the same price action he sees as a trap could also be interpreted as the market reclaiming structure.
How the trade is structured
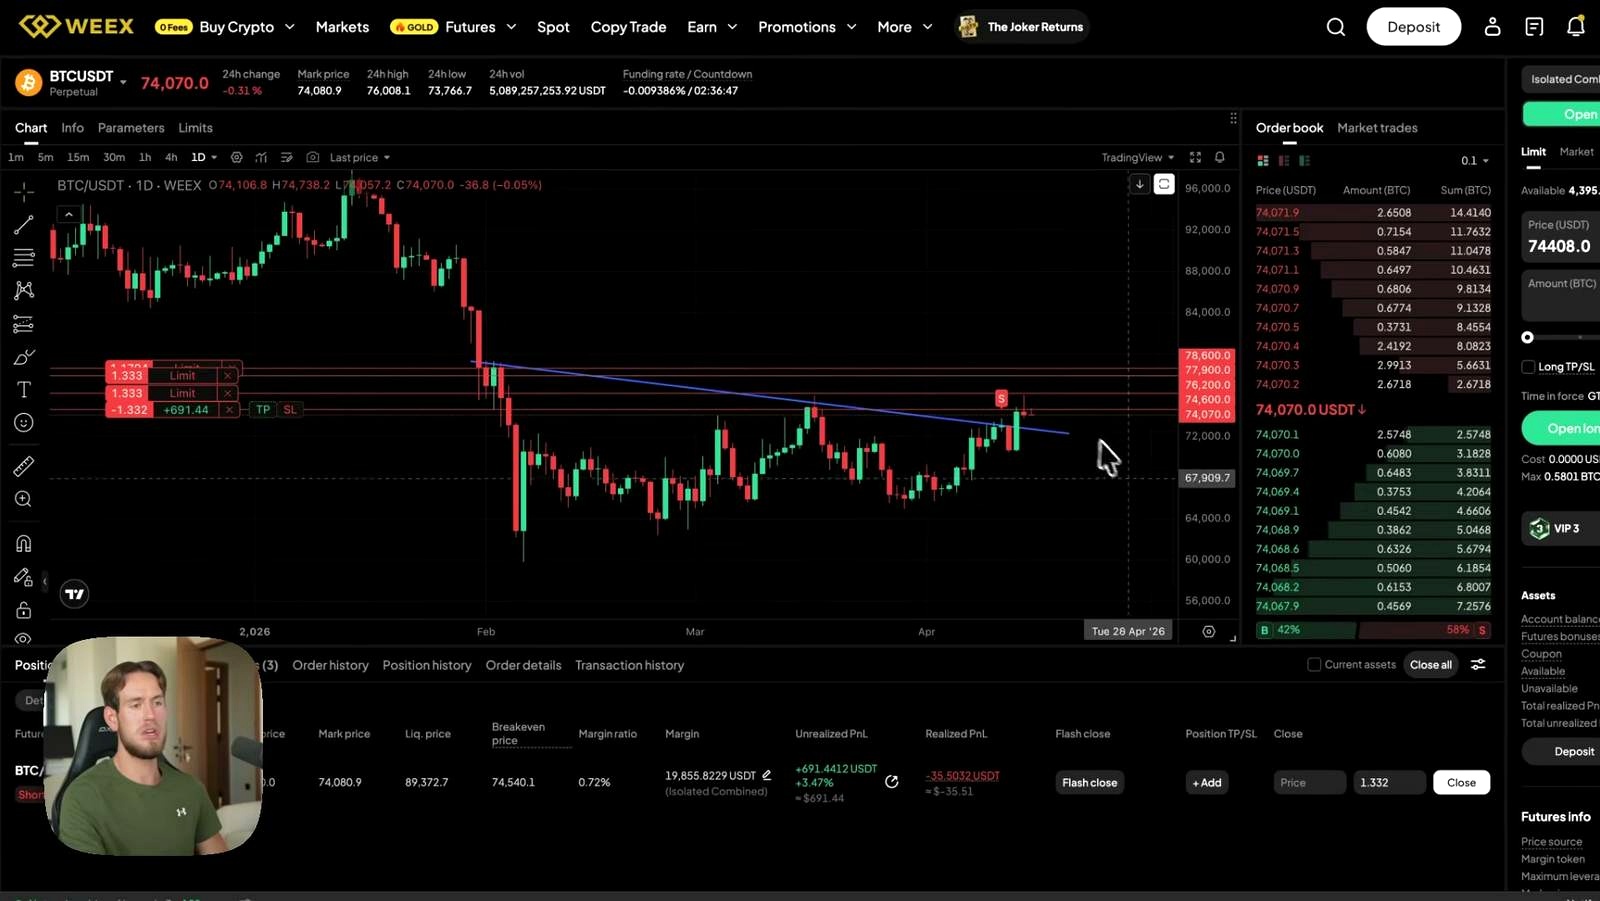
According to Mister Crypto, the tactical plan is not to short aggressively into weakness but to let price rally into resistance and then build exposure gradually. He said he wants to scale slowly into short positions with relatively low leverage, specifically citing 5x leverage and a higher margin allocation. He also made clear that he has not finalized an exact entry within the $80,000 to $86,000 supply cluster, saying that the precise level depends on how price develops as Bitcoin approaches that zone.
That distinction matters. Many traders lose money by treating resistance as a single line rather than an area. The analyst is instead framing it as a region where confirmation matters more than precision. He expects a rejection from somewhere in that broader band, not necessarily from one exact print.
He also tied the outlook to EMA ribbons, arguing that Bitcoin had been overextended to the downside and was likely to “catch up” toward those moving-average bands before resuming lower. In technical analysis, that is a familiar mean-reversion idea: fast drops can create space between price and trend measures, and rallies back into those trend measures can serve as decision points.
On the longer horizon, however, his tone changes. Mister Crypto said he is already accumulating Bitcoin for the long term through dollar-cost averaging, arguing that price is “relatively speaking” cheap even if he still expects lower bear-market lows first. He also pointed to the RSI as “setting up pretty well” for a bullish divergence on both the weekly and the two-week time frame. His broader thesis is that Bitcoin could print a double bullish divergence near a cyclical bottom, much as it previously printed a double bearish divergence near the top.
That combination, short-term long, medium-term short, long-term accumulation, is more nuanced than a simple bullish or bearish call. It reflects a trader trying to separate time horizons rather than force one directional view onto every chart.
Oil is part of the macro backdrop
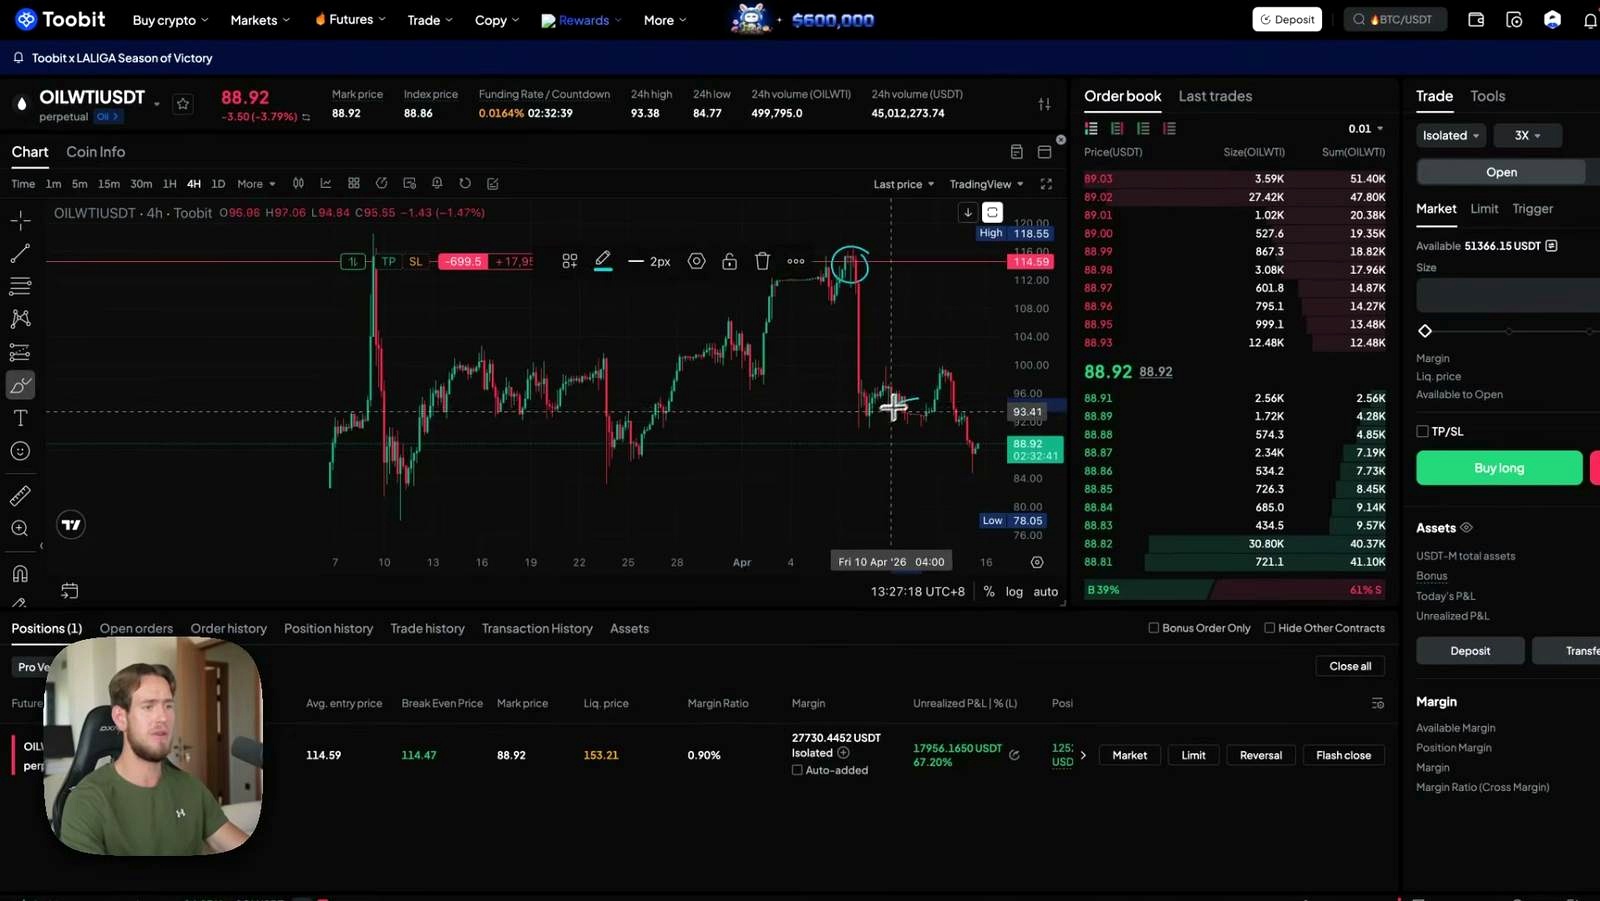
According to Mister Crypto, another piece of the puzzle is oil. He said he called the local top in oil on April 7 and has been heavily short since then, adding that he already closed 60% of the position and still held what he described as a 20K profit trade as oil broke toward the $85 level.
He did not explicitly connect oil weakness to a bullish or bearish Bitcoin outcome in detail, but the implication is that broader risk and inflation-sensitive markets are following a repeatable playbook. Falling oil can matter for crypto because it can ease inflation expectations at the margin and influence how traders think about liquidity, rate pressure, and macro risk appetite.
Still, that relationship is not stable enough to trade mechanically. Sometimes lower energy prices help risk assets by reducing inflation fears. Other times they signal weakening global demand, which can pressure cyclicals and speculative assets alike. So while the oil trade adds color to the analyst’s broader macro confidence, it does not by itself prove the Bitcoin path he expects.
What could go wrong
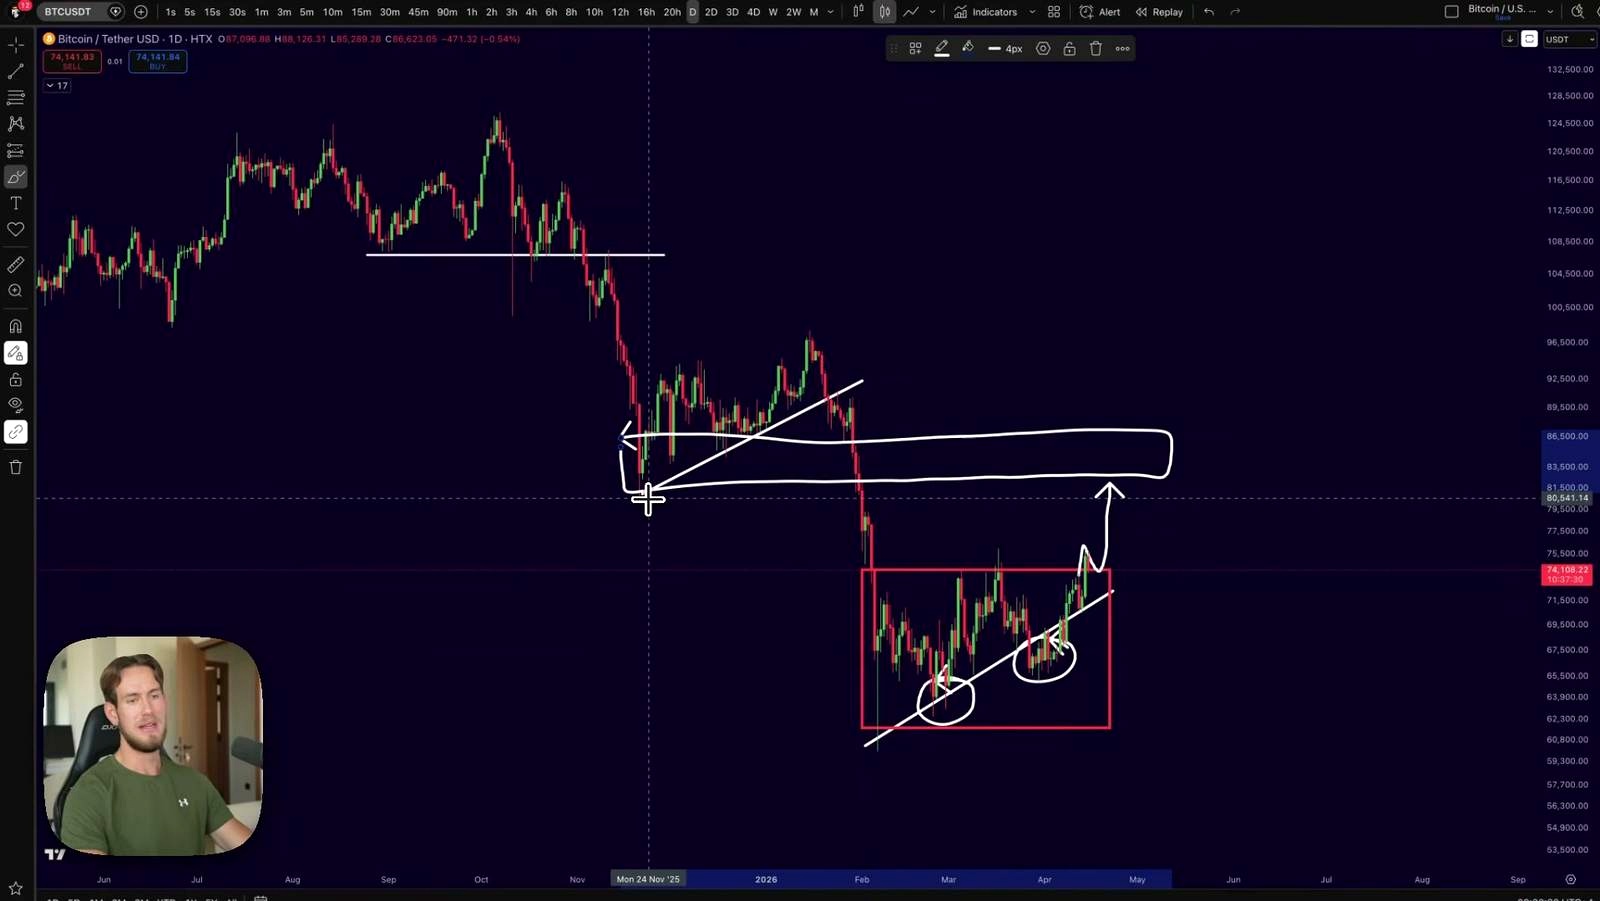
The clearest way this thesis fails is if Bitcoin breaks out and does not get rejected in the expected supply zone. If price slices through the $80,000 to $86,000 area, reclaims it on high volume, and starts turning that region into support, the “relief rally inside a bear market” narrative weakens quickly. In that case, what looks like a trap becomes a trend reversal, and scaling into shorts could become expensive.
Another risk is that the market never gives the ideal entry. Mister Crypto acknowledged that rejection could begin as low as $77,000, $78,000, or $79,000. That kind of uncertainty cuts both ways. A trader waiting for the top of the zone may miss the reversal entirely, while a trader shorting too early may be run over by one more squeeze.
There are also risks he did not dwell on. Spot ETF flows, macro policy shifts, and a sudden improvement in liquidity conditions can overpower chart-based resistance zones. So can a broad short squeeze if market positioning becomes too one-sided. And while weekly RSI divergence can be useful, divergences alone are not timing tools. Price can stay weak for longer than momentum signals suggest, or momentum can improve without producing the clean cyclical bottom traders expect.
The other side of the trade is simple: bullish traders will argue that a long consolidation followed by an upside break is exactly how strong trends resume. If they are right, pullbacks will be shallow, not catastrophic.
What to watch next
The first trigger is whether Bitcoin can sustain the breakout above its recent range rather than briefly wick above it. After that, traders will be watching two zones closely: the nearer $77,000 to $79,000 area that Mister Crypto says could produce an early rejection, and the larger $80,000 to $86,000 supply zone where he expects the downtrend to reassert itself.
If Bitcoin stalls there, loses momentum, and starts printing lower highs, the analyst’s medium-term bearish case gains credibility. If it powers through and starts holding those levels as support, the thesis is in trouble. On a higher time frame, the setup to monitor is whether weekly and two-week RSI momentum actually forms the bullish divergence he expects near a later market bottom.
FAQ
What is a relief rally in Bitcoin?
A relief rally is a rebound that happens after a sharp sell-off, often driven by short covering, oversold conditions, or price snapping back toward moving averages. It does not automatically mean the broader downtrend has ended.
What does “previous demand turning into supply” mean?
It refers to a chart area where buyers previously stepped in aggressively, but after price breaks below that zone, the same area can later attract sellers. Traders often treat those former support zones as resistance on the way back up.
What is a bullish divergence on RSI?
A bullish divergence happens when price makes a lower low while the Relative Strength Index makes a higher low. Traders interpret that as a sign that downside momentum is weakening, even if price has not yet fully reversed.
How is scaling into a short different from opening one large short?
Scaling in means building a position gradually across multiple prices instead of entering all at once. Traders use it to reduce timing risk, especially when they expect resistance to act as a zone rather than an exact level.
How does this compare with prior Bitcoin bear-market rallies?
Historically, Bitcoin has often posted sharp countertrend rallies during broader drawdowns. Those moves can reclaim major percentages before rolling over again, which is why distinguishing between a true trend reversal and a temporary squeeze is one of the hardest parts of trading BTC.
Reference Video

Omar Al-Sharif lives and works in the UAE and is involved in the blockchain technology industry. He writes articles on Bitcoin and digital assets as a personal passion, explaining complex topics in simple and understandable language.


