Bitcoin has moved from around 67,000 into a period of resistance after a bullish reversal from 60,000 on February 6. While the outlook still includes a possible move toward 80,000 to 84,000, there is also a notable bearish pattern that could point to a much deeper decline before any larger rebound.
The current setup combines short-term bullish momentum, long-term cycle analysis, and downside risk. Key levels around 60,000, 50,000, 35,000, and 80,000 to 85,000 are central to the trader’s view.
Bitcoin Price Action After the 60,000 Reversal
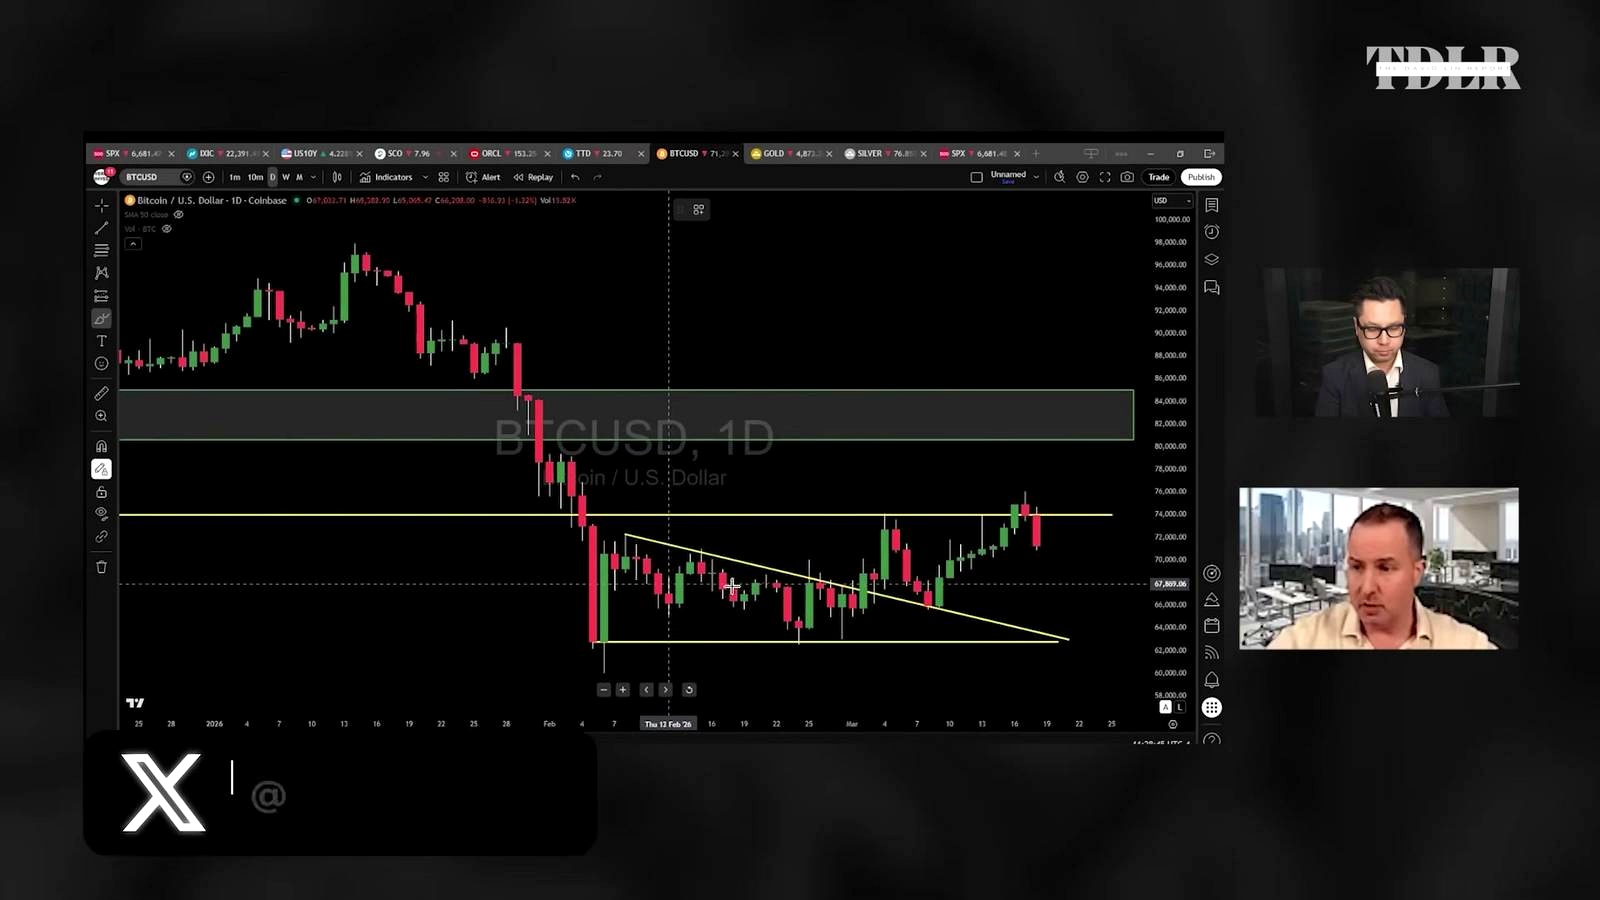
On the Bitcoin chart, the move from 60,000 on February 6 produced a bullish reversal. That setup included inside bars within a green candle, described in technical analysis as an inside bar bull flag.
At that stage, the outlook was bullish, with a projected move as high as 80,000 to 85,000. Bitcoin then topped out in early March at around 74,000, briefly touched 75,000 to 76,000, and was rejected.
That rejection has placed Bitcoin into a zone of resistance, but the expectation remains that it can move higher once fear fades.
Why 80,000 to 84,000 Is Still in Focus
The trader still expects Bitcoin to head higher toward 80,000 to 84,000. Bitcoin is described as more of a risk asset, and the view is that once the current fear is out of the way, the price can resume higher.
Another point supporting that view is relative performance. Over the last month, compared with the S&P, gold, and silver, Bitcoin has been the best performing asset. That is seen as a sign that some money is starting to move into Bitcoin after earlier levels were considered too lofty.
How Bitcoin’s Cycle May Be Repeating
A major part of the discussion centers on how Bitcoin behaved in prior cycles.
- In the last bull cycle, Bitcoin topped around 69,000 and later fell to 17,000.
- In the 2017 cycle, Bitcoin rose to 17,000 and later fell to around 4,500.
The key observation is that in the last two bull cycles, Bitcoin appeared to bottom near the previous peak.
Previous Peak as a Possible Support Zone
In 2023, Bitcoin bottomed around 15,000 to 17,000, with 17,000 matching the 2017 top. Now Bitcoin is flatlining around 67,000 to 69,000, and 69,000 was the top in 2021.
That has raised the possibility that Bitcoin is again repeating a four-year cycle where the previous bull market peak becomes a major support area.
The trader agreed that this analysis looks notable. On the charts, Bitcoin pierced the prior highs by roughly 10% to 15%, rallied to new highs, and has now pulled back into that same area. That pullback may help explain why Bitcoin is getting a bounce here.
Why the Trader Is Not Fully Convinced the Bottom Is In
Even with the cycle support argument, the trader is not sold on the idea that Bitcoin cannot go lower. One issue is timing. From the peak in October to the bottom in February, the decline was only about five months, while previous down periods were closer to about a year.
So while the levels may align well with prior cycles, the timing does not fully match.
Current Buying Strategy Between 60,000 and 70,000
The trader said he picked up a little Bitcoin, though not a full position. He is comfortable starting to leg in between 60,000 and 70,000 because he still believes in Bitcoin long term.
At the same time, he is leaving room in case Bitcoin flushes lower. Additional areas mentioned for adding more include:
- 50,000
- 35,000 to 40,000
Head and Shoulders Pattern Points to 34,000 to 35,000
The most important bearish warning in the discussion is a head and shoulders pattern on the Bitcoin chart. Head and shoulders patterns are described as bearish formations with measurable downside targets.
The target is calculated by taking the highest point of the head, measuring down to the neckline, and then projecting that same distance from the point where the neckline breaks.
Bearish Target If the Pattern Completes
Using that method, the pattern projects Bitcoin to as low as 35,000, with the completion area also described around 34,000.
The trader made clear that there are no guarantees that Bitcoin goes there, and he did not want to scare people. Still, he said that if the stock market is destined for at least a 20% correction, then there is a good chance Bitcoin gets down toward that target as well.
Bitcoin vs Gold This Year

When asked whether gold or Bitcoin was the more bullish asset this year, the answer was Bitcoin.
Even when asked whether a prolonged war would change that analysis, the response was that it would not change much. The view is that the cycles are still pretty much intact.
Why Bitcoin Is Favored Over Gold Right Now
The trader said he loves gold at 3500, but still thinks it has to get there. He compared the percentage move with a possible Bitcoin drop to 35,000 and said it could be about the same.
The main reason for favoring Bitcoin right now is that it is the asset that has been beaten up, making it due for a relief rally.
Most Important Bitcoin Levels to Watch
The outlook combines a possible near-term rebound with the risk of a deeper breakdown later.
Upside Levels
- 74,000: early March top area
- 75,000 to 76,000: recent rejection zone
- 80,000 to 84,000: expected upside target
- 80,000 to 85,000: broader relief rally zone mentioned
Downside Levels
- 69,000: 2021 top and current flatlining area
- 60,000: major level from the February reversal and key support to watch
- Sub-50,000: area to watch if 60,000 breaks
- 35,000: head and shoulders target
- 34,000: pattern completion area
What Happens If Bitcoin Breaks 60,000
The trader said that if Bitcoin takes out 60,000, he would be watching for sub-50,000. That makes 60,000 one of the most important support levels in the current structure.
For now, the path being watched is a relief rally first, potentially back to 80,000 to 85,000, followed by a decision point to see whether Bitcoin rolls over again.
FAQ
Why is Bitcoin still seen as bullish in the near term?
Bitcoin had a bullish reversal after hitting 60,000 on February 6, and the trader still expects a move toward 80,000 to 84,000 once current fear fades.
What resistance levels has Bitcoin recently faced?
Bitcoin topped around 74,000 in early March, touched 75,000 to 76,000, and then got rejected.
What is the bearish target from the head and shoulders pattern?
The head and shoulders pattern projects Bitcoin to around 35,000, with completion of the pattern described near 34,000.
Why is 69,000 considered an important level?
69,000 was the 2021 top, and Bitcoin is now flatlining around 67,000 to 69,000. That fits the idea that Bitcoin may be repeating a cycle where the previous peak acts as support.
What happens if Bitcoin falls below 60,000?
If Bitcoin takes out 60,000, the trader said he would be watching sub-50,000.
Is the trader more bullish on Bitcoin or gold this year?
The trader said Bitcoin.
Does the trader think Bitcoin has already bottomed?
Not fully. He agrees the levels are notable, but he is not convinced Bitcoin cannot go lower, especially because the timing of the decline has been shorter than in previous down cycles.
Source Video

An Indian crypto journalist covering the developments in the Bitcoin and blockchain industries. Her work helps readers understand key changes in the world of digital assets.


