Is BTC setting up for a deeper reset, or is this the kind of retest that tends to launch the next leg higher? A new market read from Transparent Fx Academy leans bullish on the bigger picture, but says the near-term path may still run through more sideways trading.
Bitcoin is sitting on what the analyst calls a major support zone
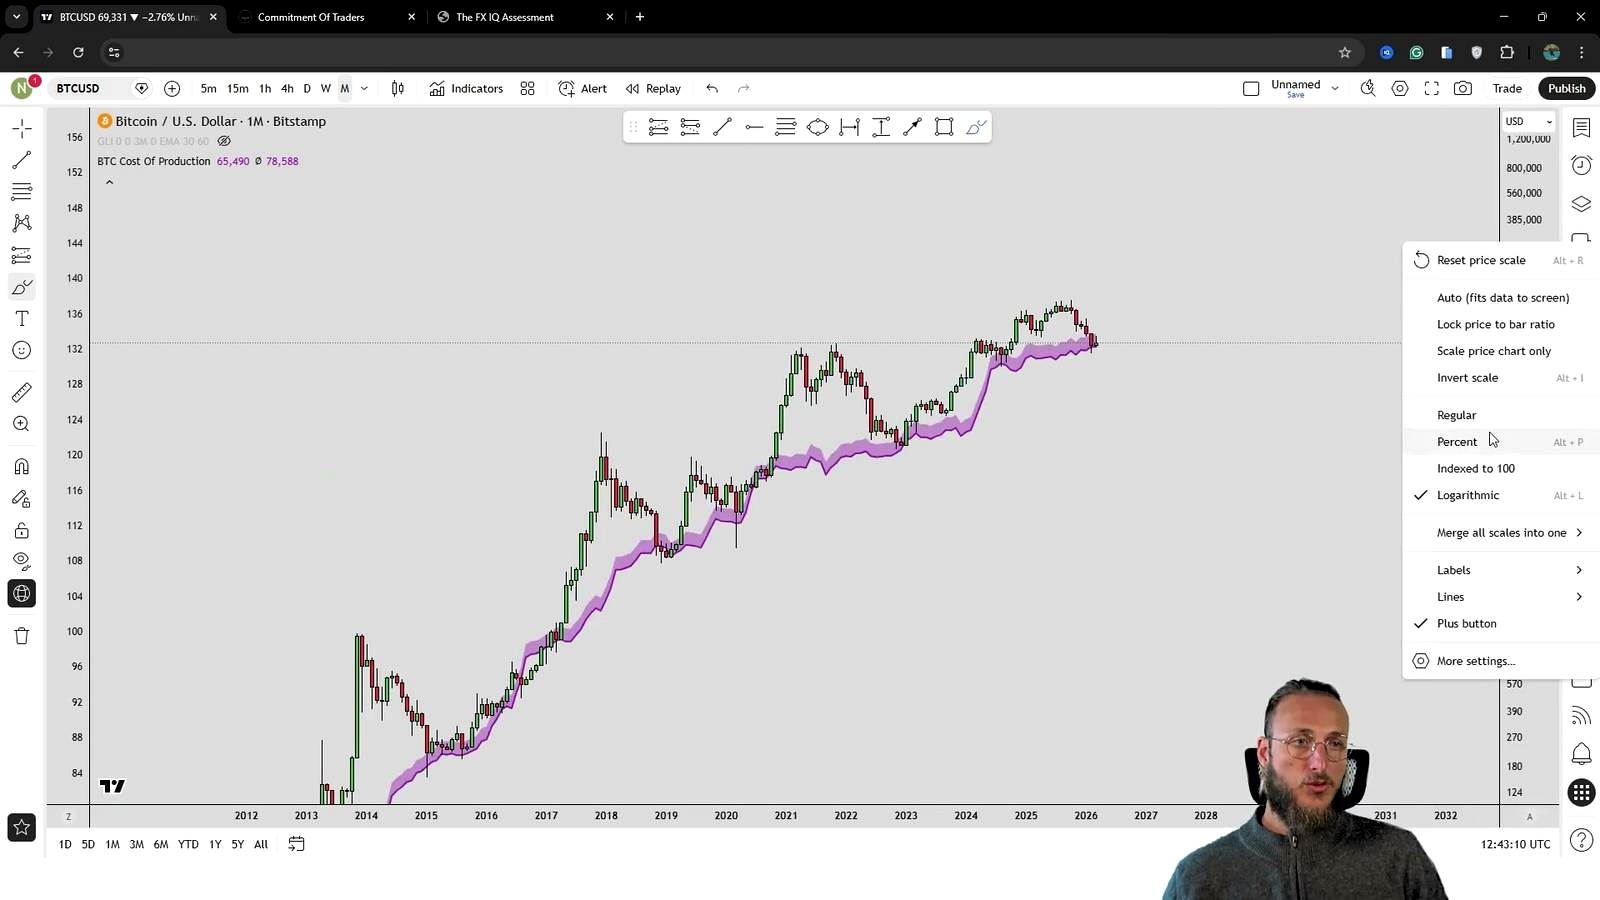
According to Transparent Fx Academy, Bitcoin is now testing two closely watched long-term areas at the same time: the previous cycle high and the network’s cost of production. That overlap is the core of the bullish case.
The host argues that this kind of setup has appeared before in Bitcoin’s history. In his framing, the market previously pushed into a bear market, later reclaimed its old highs, consolidated below resistance, broke out, and then corrected back toward the prior cycle high. He says the current structure resembles that older pattern, with BTC once again revisiting the zone that defined the earlier cycle peak.
From that pattern alone, he expects the market to attempt a recovery from the area, with the possibility of eventually moving toward new all-time highs. He does not give a specific upside target in dollar terms, but the directional call is clear: the monthly structure is being read as constructive rather than broken.
Why the cost of production matters here
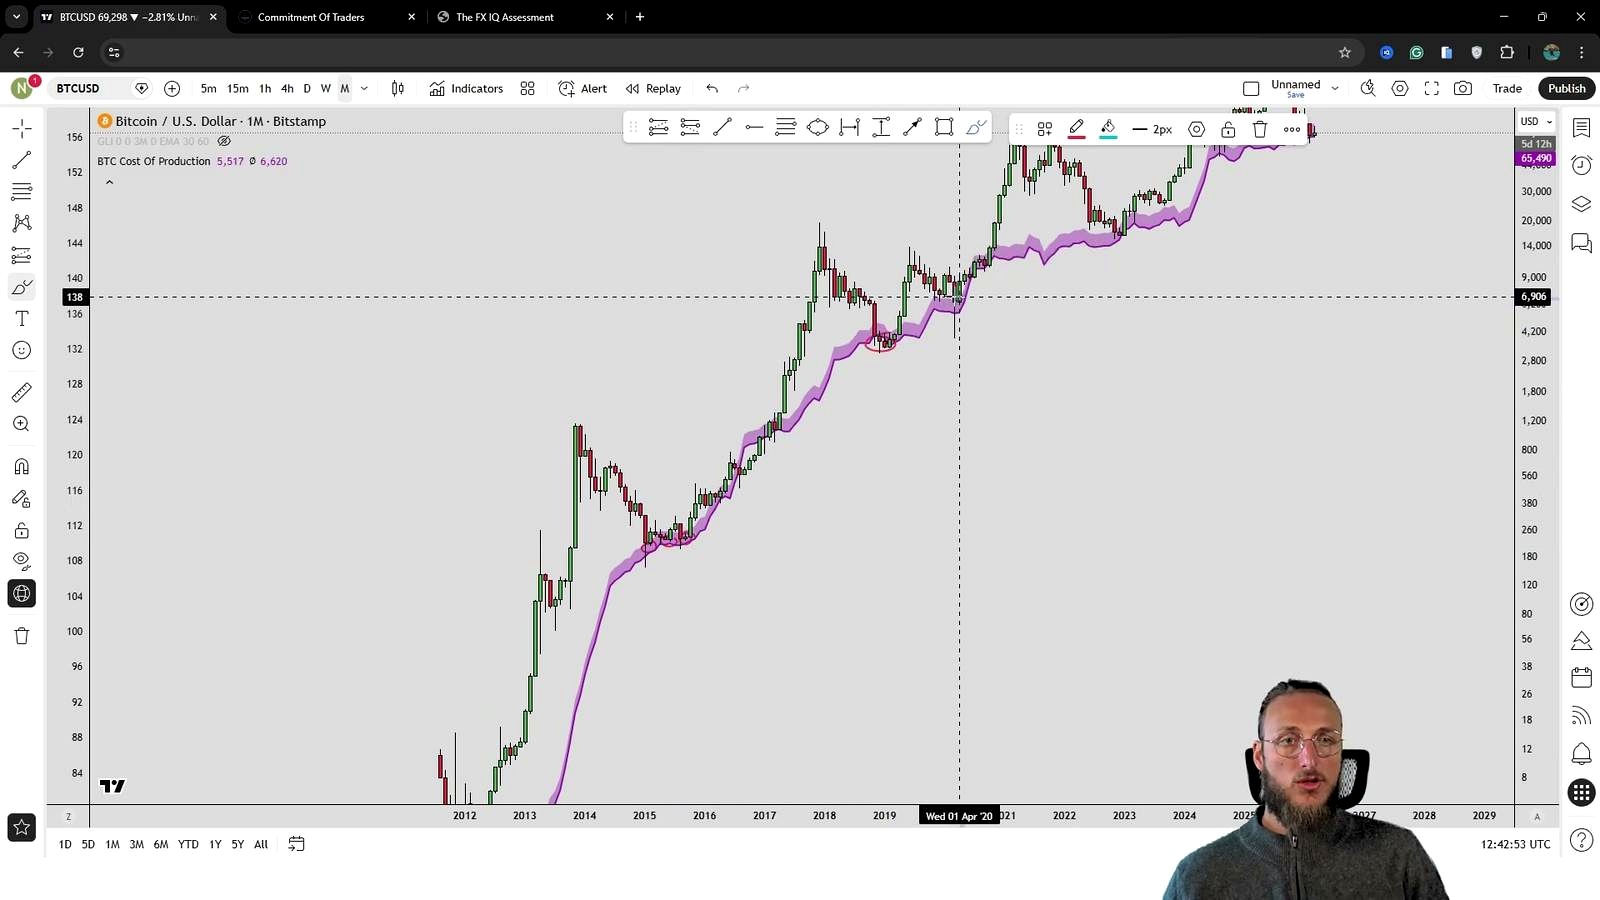
Transparent Fx Academy argues that Bitcoin’s cost of production is one of the strongest support markers on the chart. The host says BTC has “almost never” dropped and stayed below that line for long, even during severe bear markets.
That matters because the current correction has brought price back into that area. In the analyst’s view, support is stronger when multiple frameworks point to the same level. Here, the cost of production aligns with the previous cycle high, creating what he sees as a high-probability zone for bullish price action to emerge.
He also notes that, on a logarithmic view, this relationship is easier to see. The practical takeaway is not that the level must hold immediately, but that this is the kind of area where long-term buyers have historically stepped in.
Global liquidity is still supportive for BTC
Beyond chart structure, Transparent Fx Academy ties Bitcoin’s longer-term outlook to global liquidity. The host says global liquidity is closely linked to Bitcoin’s price behavior and notes that liquidity is currently at new all-time highs.
His implication is straightforward: if liquidity continues rising, Bitcoin could follow. That does not settle the next few days or weeks, but it strengthens the broader case that the current correction sits inside a larger bullish backdrop rather than marking the start of a prolonged breakdown.
Put differently, the analyst is combining price structure with macro-style context. The chart says BTC is testing a major historical floor. The liquidity backdrop says the larger environment still favors upside if risk appetite stays intact.
Institutional positioning has flipped from bearish to bullish
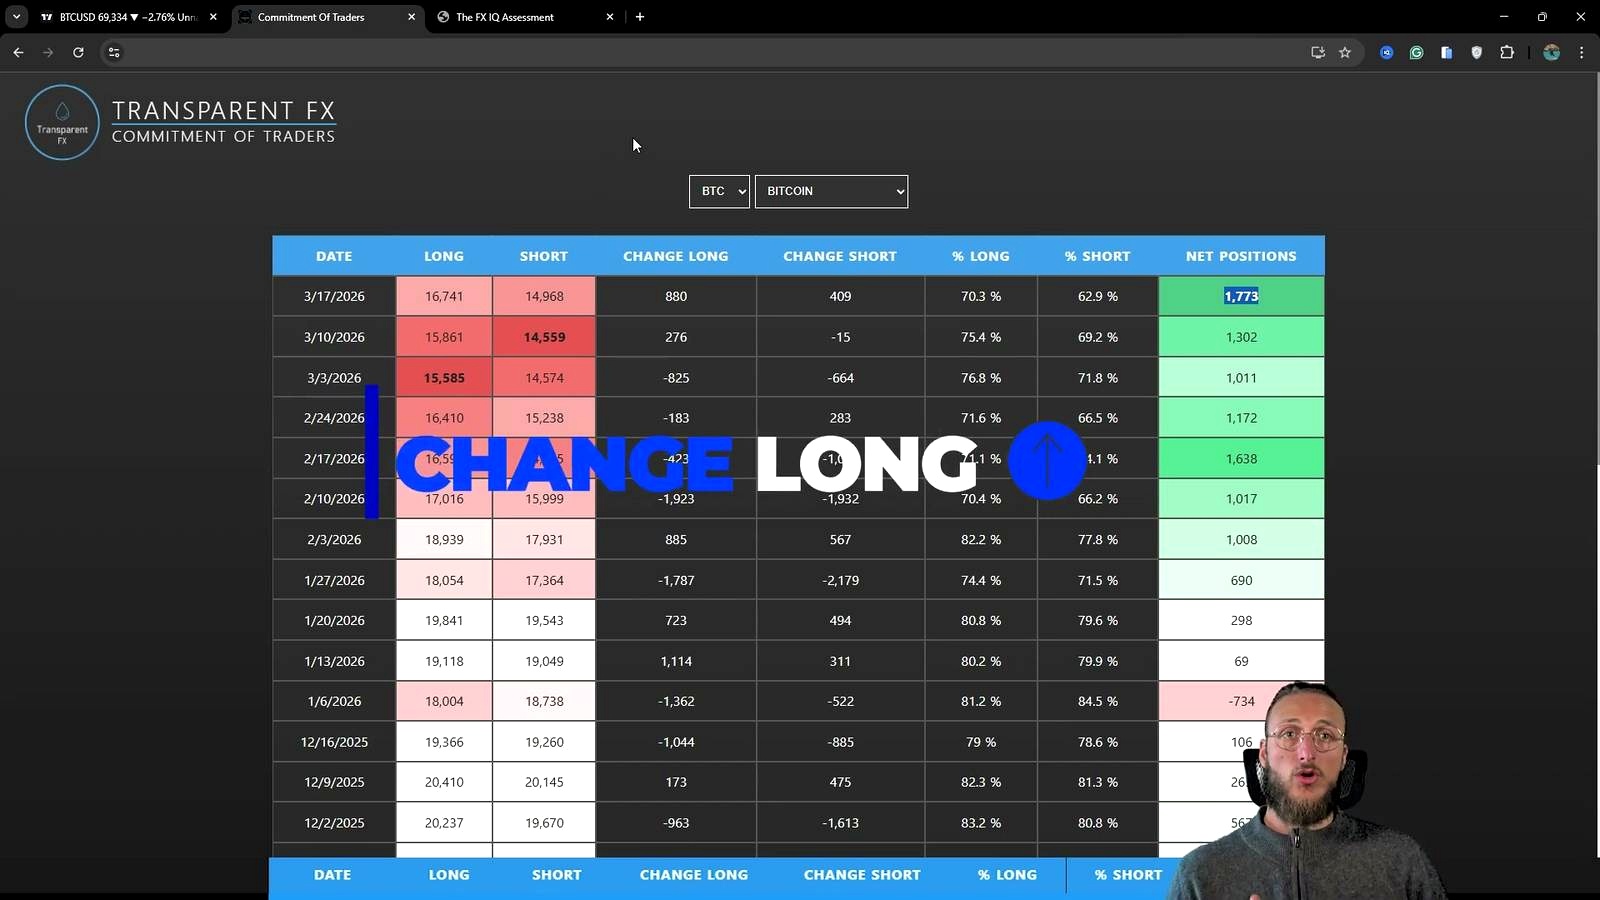
One of the more concrete data points in the video comes from Commitment of Traders positioning. Transparent Fx Academy says large institutional speculators have shifted from net short to net long exposure in Bitcoin-related positioning.
- Previous net positioning:-734
- Current net positioning:+1.7K
The host interprets that move as a meaningful change in tone. Instead of institutions holding more shorts than longs, the data now shows more longs than shorts. He presents that shift as confirmation that bigger players are no longer leaning bearish in the same way.
That does not mean price must rally immediately. But in combination with the monthly support test and the cost-of-production zone, it adds another bullish input to the overall thesis.
The near-term setup looks less explosive than the long-term case
For all the bullish long-term signals, the analyst does not describe Bitcoin as being in a clean vertical breakout. On the weekly chart, he says the market appears to have entered a horizontal accumulation zone.
That is an important distinction. His expectation is not for instant trend resumption, but for a period of sideways price action similar to what formed near prior lows before the market eventually turned higher.
On the daily chart, he says traders can already begin identifying a range high and range low. He does not provide those levels numerically, so no exact daily support or resistance prices were given in the video. Still, the framework is clear: BTC may spend time oscillating inside a developing range before making a cleaner directional move.
That range logic also shapes the most actionable short-term scenario in the analysis. If Bitcoin revisits the low of the range, the host says that area could become an attractive place for a reversal and rejection back to the upside.
What the analyst wants to see next
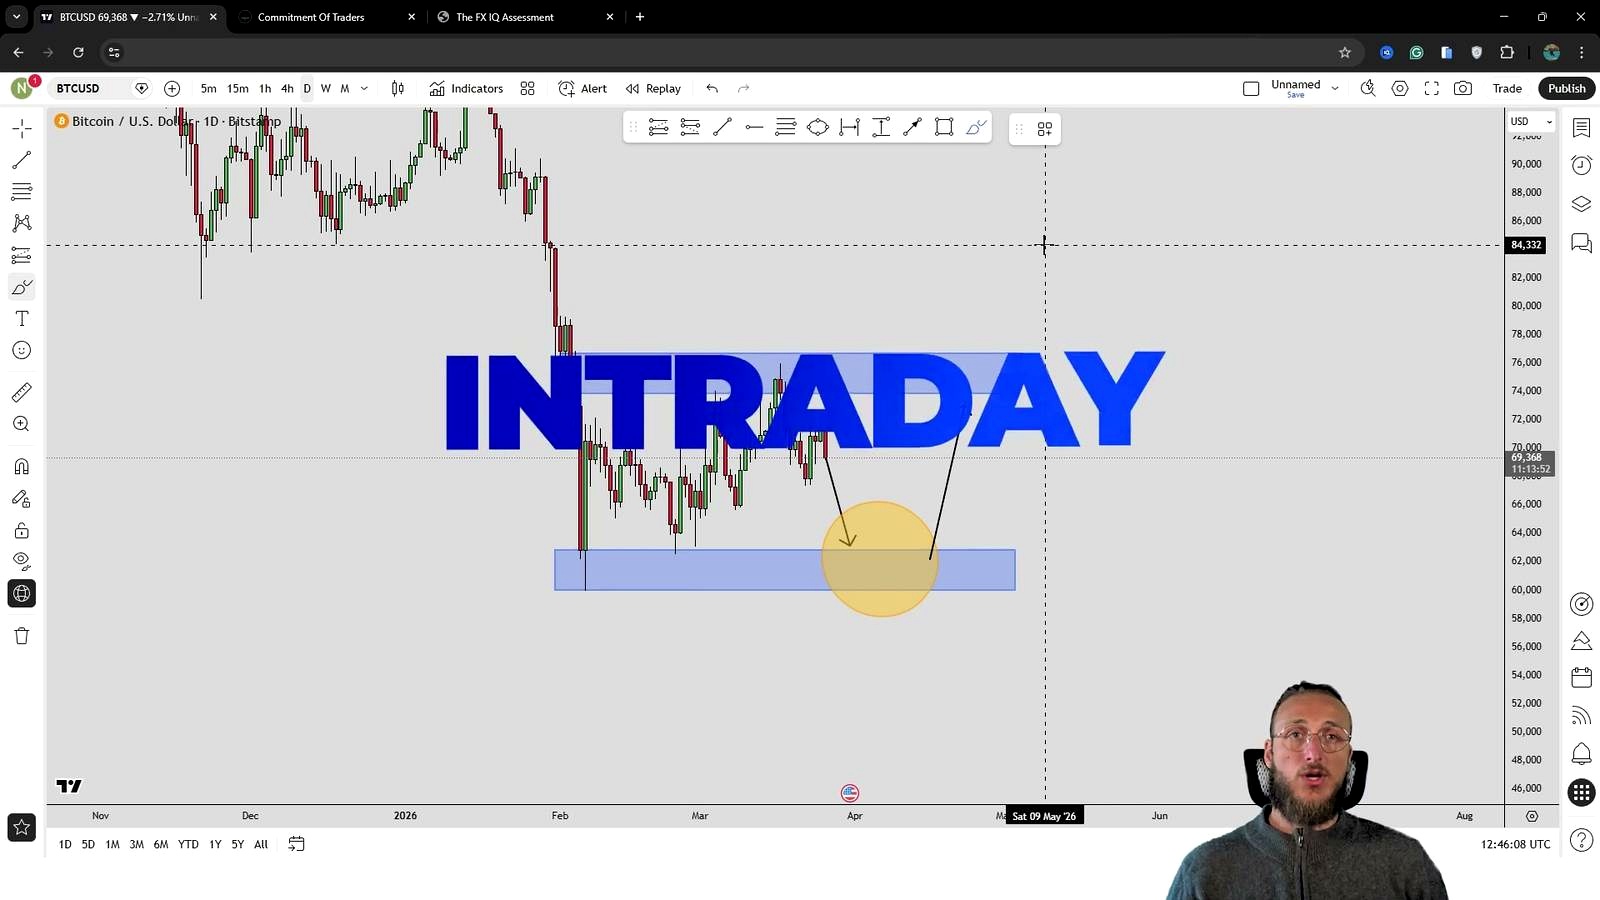
Transparent Fx Academy emphasizes a reactive approach rather than a predictive one. The host says higher time frames such as the monthly, weekly, and daily, together with COT data, are best for defining directional bias. But for spotting an early shift in trend, he looks to intraday charts.
Specifically, he highlights the 4-hour chart and lower as the best place to detect a change from intraday bearish conditions to intraday bullish ones. If that shift happens while BTC is near the lower end of the current range, he says a rebound toward the top of the range would not be surprising.
That gives traders and market watchers a practical checklist:
- Watch whether Bitcoin holds the broader support cluster around the previous cycle high and cost of production.
- Track whether the current sideways structure continues to define a clear range.
- Look for an intraday shift from bearish to bullish, especially near range support.
- Measure whether price can then rotate back toward the range high.
The numbers that matter from the video
The transcript included only a few hard figures, but they are central to the call:
- -734: earlier net institutional positioning in BTC
- +1.7K: latest net institutional positioning in BTC
- 4-hour: key intraday timeframe the host says can reveal an early trend shift
No specific Bitcoin price targets, exact range levels, or dated forecasts were given in the video.
What to watch now
The market takeaway is a tension between bullish structure and unfinished consolidation. Transparent Fx Academy sees Bitcoin resting on a historically important floor, backed by supportive cost-of-production dynamics, rising global liquidity, and improved institutional positioning. At the same time, the host does not frame the market as fully cleared for a breakout right now.
The next signal, in his view, would come from the lower time frames. If BTC tests the bottom of its developing range and then flips intraday momentum higher, that would fit the roadmap for a move back toward range resistance. If the range simply persists, that would still be consistent with his broader accumulation thesis.
For now, the key idea is simple: the long-term case remains bullish in this analysis, but the market may need to finish building a base before attempting a stronger recovery.
FAQ
Is Transparent Fx Academy calling for immediate new highs in Bitcoin?
No. The host says the bigger structure could eventually support new all-time highs, but the nearer-term expectation is more modest: sideways accumulation first, then a possible rebound if the market turns bullish on intraday timeframes.
What is the single strongest support factor in this analysis?
The cost of production is treated as the most important support metric. The analyst says Bitcoin has rarely remained below it for long, and that support now overlaps with the previous cycle high.
Why does institutional positioning matter here?
Because the COT shift shows a change in professional market sentiment. Moving from -734 to +1.7K net positions means large speculators went from net short to net long, which the host reads as a bullish confirmation.
What chart should traders monitor for the next clue?
The host points to the 4-hour chart and lower. His view is that those intraday timeframes are the best place to spot an early transition from bearish to bullish conditions.
Did the video provide exact BTC price levels to buy or sell?
No. The transcript describes a range, a previous cycle high, and the cost-of-production area, but it does not give precise BTC/USD price targets or named dollar levels.
Reference Video

John Burnell focuses on Bitcoin infrastructure, wallet security and blockchain technology. He writes educational articles explaining how Bitcoin works and how the technology evolves.


