Traders are staring at a familiar problem: Bitcoin still looks structurally bullish, but momentum has stalled just below resistance and the market is waiting for a catalyst. According to Thomas Boleto, Bitcoin Insights, that tension has now narrowed to a make-or-break zone around $78,300, with a breakout keeping the path open toward $85,000 and rejection raising the risk of a local top.
Bitcoin’s core setup: bullish trend, weak conviction
According to Thomas Boleto, Bitcoin Insights, Bitcoin’s latest daily candle printed as an indecision candle at what he described as a “very stronger zone, ” reinforcing his argument that traders should avoid rushing into positions before confirmation arrives. His central thesis is straightforward: the broader uptrend remains intact, the MACD is still trending higher, and RSI still shows bulls in control, but price is now close enough to key resistance that traders need a confirmed break rather than assumptions.
The analyst pointed to the recent high near $78,380, later rounded to $78,300, as the level that needs to be broken. If Bitcoin clears that area, he said, the market could continue higher and revisit $85,000. If it fails there, he warned the structure could resemble a double top, opening the door to a downward move.
That framing sits in the middle of current market sentiment rather than at either extreme. Many traders have spent this phase trying to reconcile a still-bullish higher-timeframe trend with increasingly messy lower-timeframe price action. In that sense, Boleto’s message is not outright contrarian. What stands out is his insistence that the market is not broken yet despite short-term hesitation.
In broader market context, this kind of setup often appears late in a trend leg: momentum indicators still lean constructive, but price begins to compress under resistance while leveraged positioning grows more fragile. That can resolve upward through a squeeze, especially if liquidity is clustered above recent highs. It can also fail sharply if buyers repeatedly test resistance without follow-through. The tension matters because the difference between a breakout and a local distribution pattern often comes down to whether price can reclaim and hold a single obvious level.
Why the analyst still leans constructive, and where the trade sits
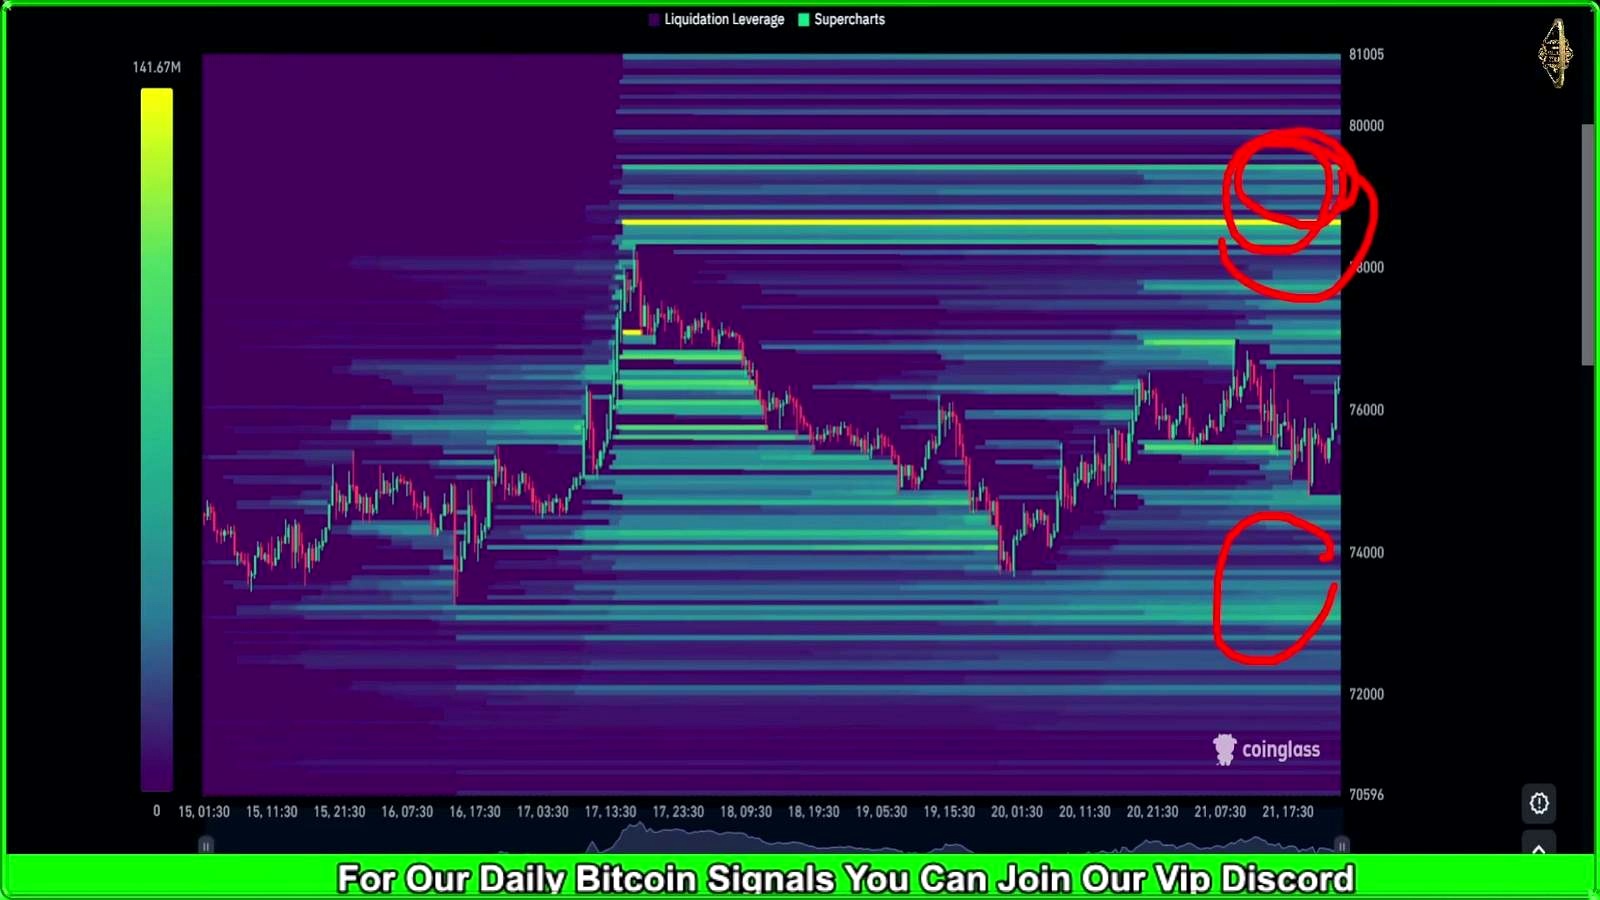
After outlining the higher-timeframe view, the host added a tactical point that helps explain the near-term risk. On a weekly liquidity heat map, he said most stop losses appear to be sitting above current price rather than below it, highlighting a liquidity zone around $78,668. That matters because markets frequently gravitate toward obvious pockets of stop liquidity, particularly when price is already pressing against a prior high.
In practice, that means Bitcoin could push upward simply to sweep overhead stops, even if the breakout later struggles. This is an important distinction. A move through $78,300 or even toward $78,668 would not automatically settle the larger question. It could still become a failed breakout if buyers cannot defend the move.
The analyst also described an earlier short trade in Bitcoin that hit a first target before he moved his stop loss to entry and got taken out. He did not give exact entry or target numbers for that trade, but the anecdote is useful because it shows how he is handling current conditions: take partial confirmation when available, reduce risk quickly, and avoid overstaying a trade in a market that has not fully resolved.
On the chart structure itself, he repeatedly emphasized that Bitcoin remains inside an ascending channel on both the daily and 4-hour timeframes. For the bullish case, he said Bitcoin may retest the top of that up-channel and continue higher. For the bearish case, he highlighted a downside break of the channel as a short trigger.
Zooming in further to the 30-minute chart, he described a cluster of possible reversal patterns: an unconfirmed head-and-shoulders, a wedge, a smaller head-and-shoulders, and even a megaphone-style formation. His practical takeaway was simple. For longs, watch a short-term downtrend line and consider a long if it breaks. For shorts, watch the lower support boundary and consider a short if that breaks instead. He also noted that he uses the Asian session as a filter and does not day trade it, suggesting he is waiting for higher-conviction moves during more active hours.
Other market signals in play: USDT dominance, Ethereum, and gold
Boleto tied his Bitcoin outlook to a few cross-market signals. On USDT dominance, he said the chart has not materially changed: it bounced from a downtrend line but failed to break a prior high. In his framework, another break there could imply a market pump, while rejection from that zone could coincide with another dump. Traders often use USDT dominance as a rough risk barometer, rising dominance can signal capital moving into stablecoins, while falling dominance can reflect renewed risk appetite, though it is best used as a secondary indicator rather than a standalone trade signal.
He also said Ethereum had spent the holiday period moving sideways, with “no real volume today, ” and attributed the broader market’s hesitation to waiting for developments related to war. He described ETH as still being in an uptrend based on moving averages, but lacking the power to push much higher. That fits a broader reading of crypto markets during event-risk windows: altcoins often stall first, while Bitcoin tests key resistance with thinner conviction.
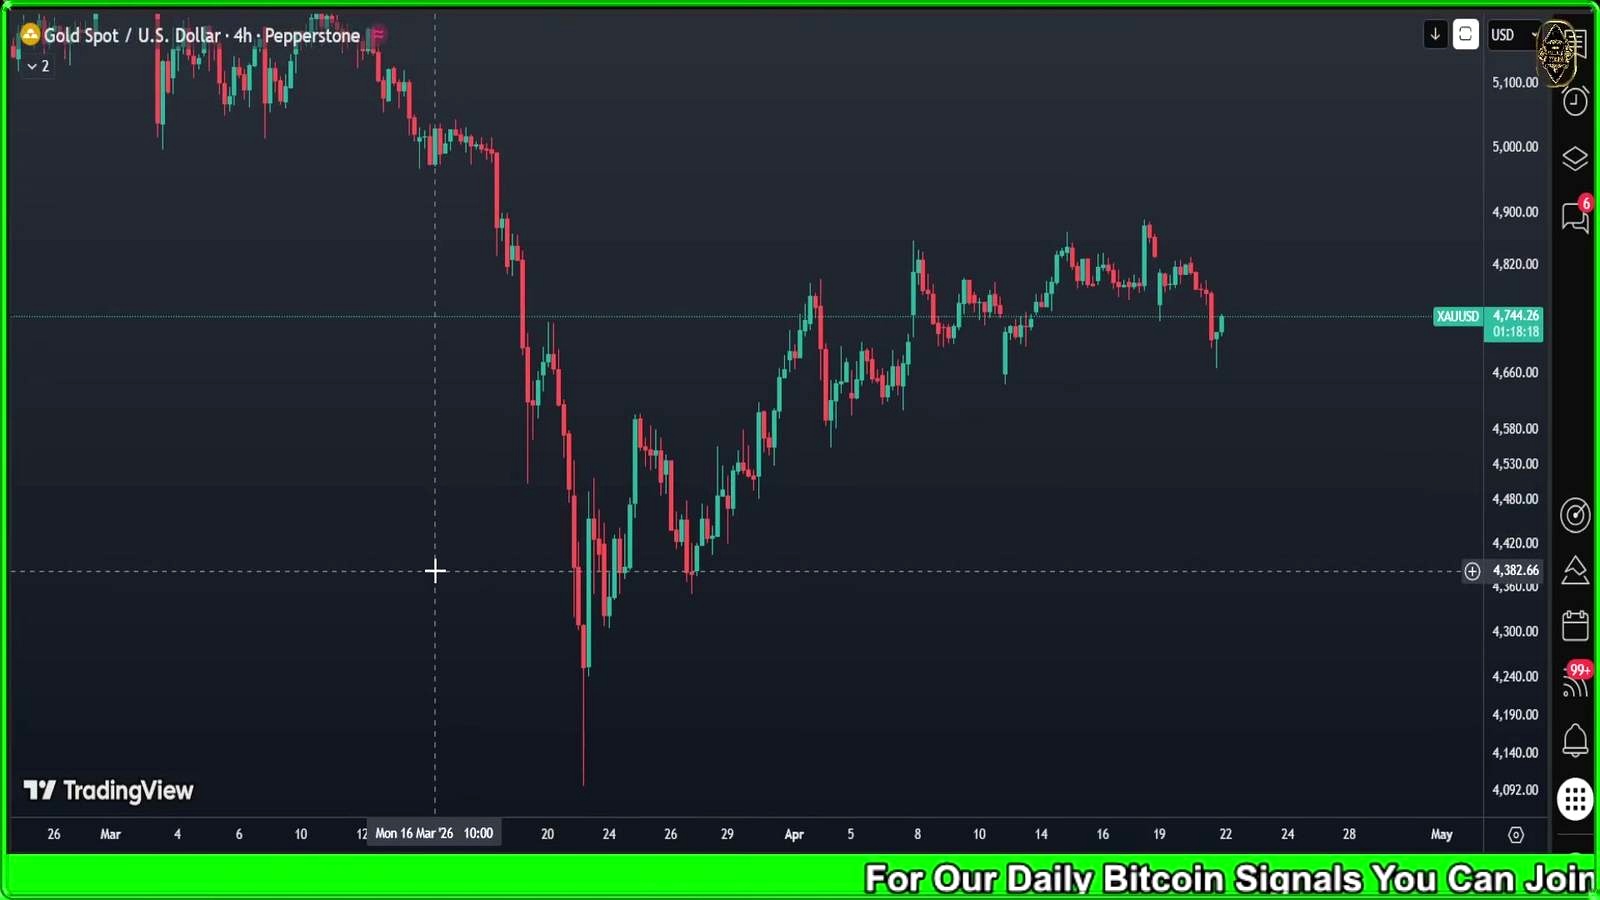
Outside crypto, the analyst said gold was trading sideways but had started breaking an uptrend, prompting his team to take a short there as well. That is not a direct Bitcoin signal, but it reinforces the larger message from the video: multiple markets are sitting in transition rather than clean trend expansion.
What could go wrong
The clearest way Boleto’s thesis breaks is if traders confuse a liquidity sweep with a true breakout. Bitcoin could push above $78,300 and even run toward $78,668, only to reverse and leave a failed breakout structure behind. In that case, the bullish trend would still face a more serious test, and the double-top scenario he mentioned would become far more relevant.
Another risk is that momentum indicators can stay constructive longer than price structure remains healthy. MACD and RSI tend to lag actual breakdowns at inflection points. That means a market can still “look bullish” on indicators while beginning to distribute underneath obvious resistance.
The analyst also did not spell out downside levels beyond the channel-break scenario, which leaves an important gap. If Bitcoin loses the channel and breaks the neckline of one of the head-and-shoulders patterns he highlighted, the move lower could accelerate quickly as late longs unwind. In a fragile macro backdrop, geopolitics, rate repricing, or a sudden risk-off move in equities could also invalidate an otherwise clean technical setup.
The other side of this trade is straightforward: bears will argue that repeated failure under resistance after a strong advance often marks exhaustion, not consolidation. If spot demand is weak and the move is being driven mostly by derivatives, any breakout attempt may lack the follow-through needed to sustain a run to $85,000.
What to watch next
The first trigger is obvious: whether Bitcoin can break and hold above $78,300. After that, traders should watch the overhead liquidity area around $78,668 for either continuation or rejection. If price clears both and consolidates above them, the path toward $85,000 becomes more credible.
On the downside, the key signal is a break below the lower boundary of the current up-channel on the 4-hour chart, especially if it comes with confirmation from lower-timeframe weakness. Traders will also be watching USDT dominance for signs that capital is rotating defensively, and whether Ethereum remains stuck sideways with low volume or begins to confirm Bitcoin’s direction.
FAQ
What is a double top in Bitcoin trading?
A double top is a bearish reversal pattern where price tests a resistance area twice and fails to break through convincingly. If the structure completes and support breaks, traders often treat it as a sign that buying momentum has weakened.
Why does liquidity above Bitcoin’s highs matter?
When many stop losses or breakout entries cluster above a prior high, price can be drawn there as market makers and leveraged traders interact. That can fuel a sharp move higher, but it can also produce a fake breakout if the move is driven more by liquidation than real spot demand.
What does USDT dominance tell traders?
USDT dominance tracks the share of crypto market capitalization held in Tether. Rising dominance can suggest traders are moving into stablecoins and becoming more defensive, while falling dominance can indicate improving appetite for Bitcoin and other crypto assets.
How is a head-and-shoulders pattern different from a wedge?
A head-and-shoulders pattern is a classic reversal setup built around three peaks, with the middle peak higher than the other two. A wedge is a tightening price formation that can break in either direction depending on trend context and volume.
What happened in past Bitcoin rallies when price stalled under resistance?
Historically, Bitcoin often pauses beneath major highs before the next directional move. In strong bull phases, those pauses can become continuation consolidations that resolve upward. But when repeated tests fail and volume weakens, the same setup can mark local exhaustion and trigger sharp pullbacks.
Source

Omar Al-Sharif lives and works in the UAE and is involved in the blockchain technology industry. He writes articles on Bitcoin and digital assets as a personal passion, explaining complex topics in simple and understandable language.


