Bitcoin traders are stuck in a range that keeps punishing conviction on both sides. The key question now is whether this chop is a prelude to another leg lower or the base for a broader relief rally. According to Chart Junkie, the market may already be transitioning out of its main selloff and into a corrective move higher, even if one more sweep of local lows comes first.
Bitcoin’s Core Setup: A Corrective Rally First, Bigger Trouble Later
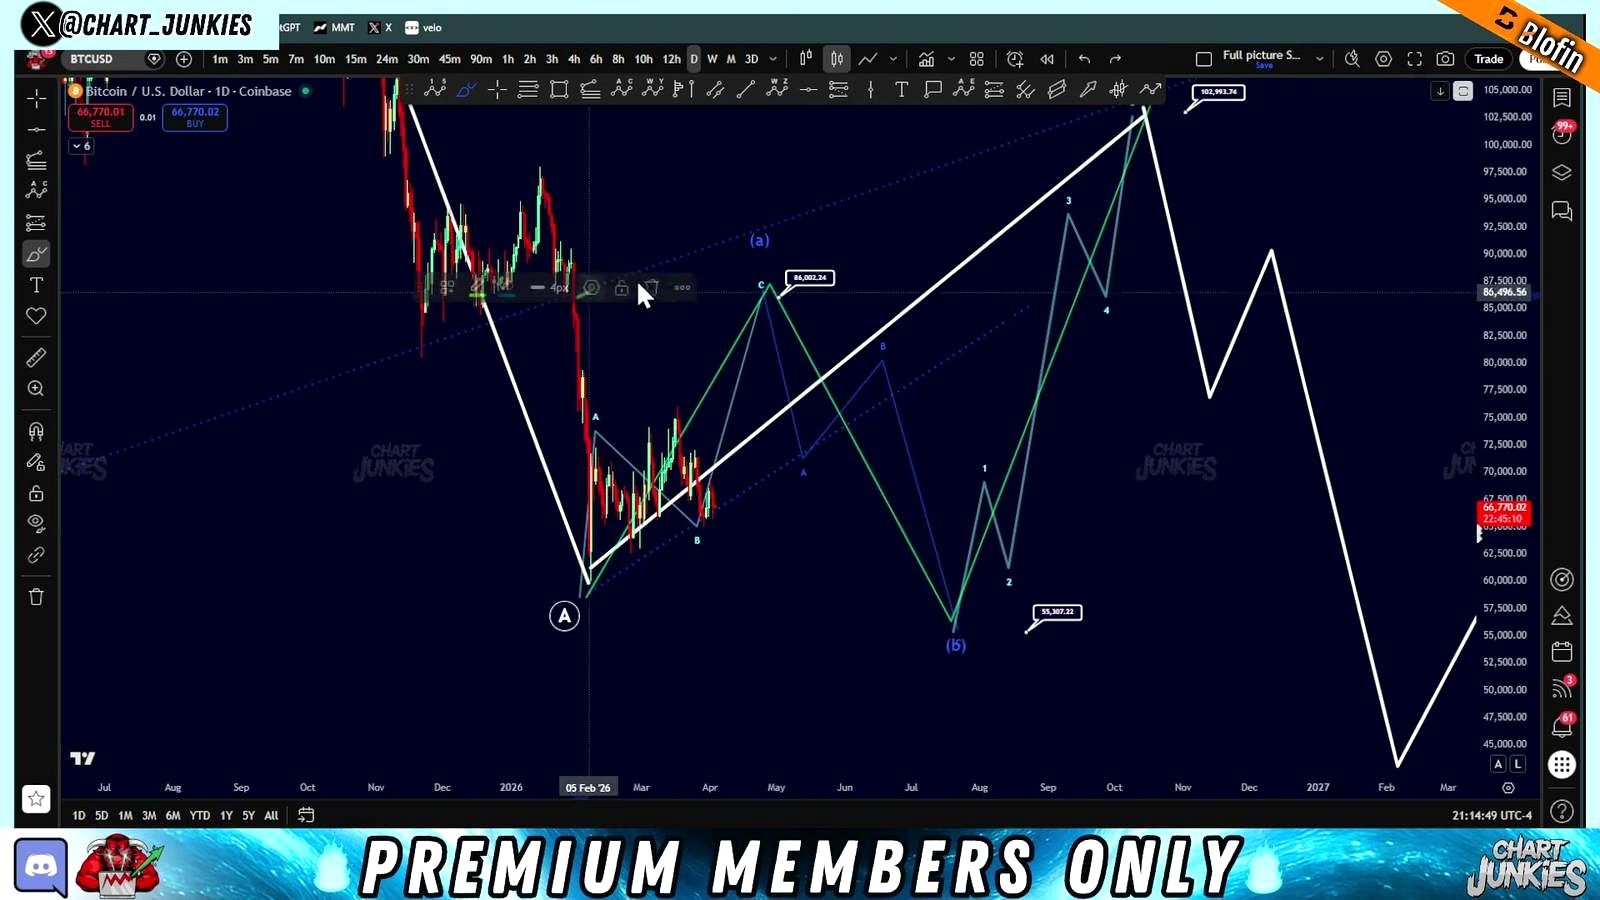
According to Chart Junkie, the main thesis is that Bitcoin has likely finished a five-wave move down and is now entering a multi-stage corrective phase rather than an immediate collapse. The analyst said he is still looking for an intermediate ABC correction that could push price into the $80,000 to $86,000 region, with a more specific near-term upside target of roughly $80,000 to $84,000. After that, he expects the market could still roll over into a larger “major C leg” lower.
That is a more nuanced stance than the outright bearish calls that often dominate after a sharp drawdown. It is also more contrarian than the view that Bitcoin simply needs one final flush and then resumes straight higher. Chart Junkie explicitly rejected the idea that the market is still in the same pure dumping phase, saying the move has gone on too long in time and that a corrective regime has likely begun.
In broader market terms, that fits a familiar Bitcoin pattern. After sharp impulse selloffs, BTC often shifts into messy, mean-reverting rebounds rather than clean trend reversals. Those rallies can be powerful enough to squeeze shorts and reset sentiment without necessarily marking a durable macro low. Traders watching derivatives data will recognize why that matters: heavily negative funding and crowded short positioning often create the conditions for upside squeezes, even when the bigger-picture chart remains contested.
At the same time, the thesis is not full-throated bullishness. The analyst repeatedly framed the expected upside as corrective, not impulsive on the macro scale. That distinction matters. A corrective rally toward the low-$80,000s would still leave open the case for a later breakdown, especially if the move stalls below prior major resistance and turns into another lower high.
Why Chart Junkie Thinks BTC Could Squeeze Higher
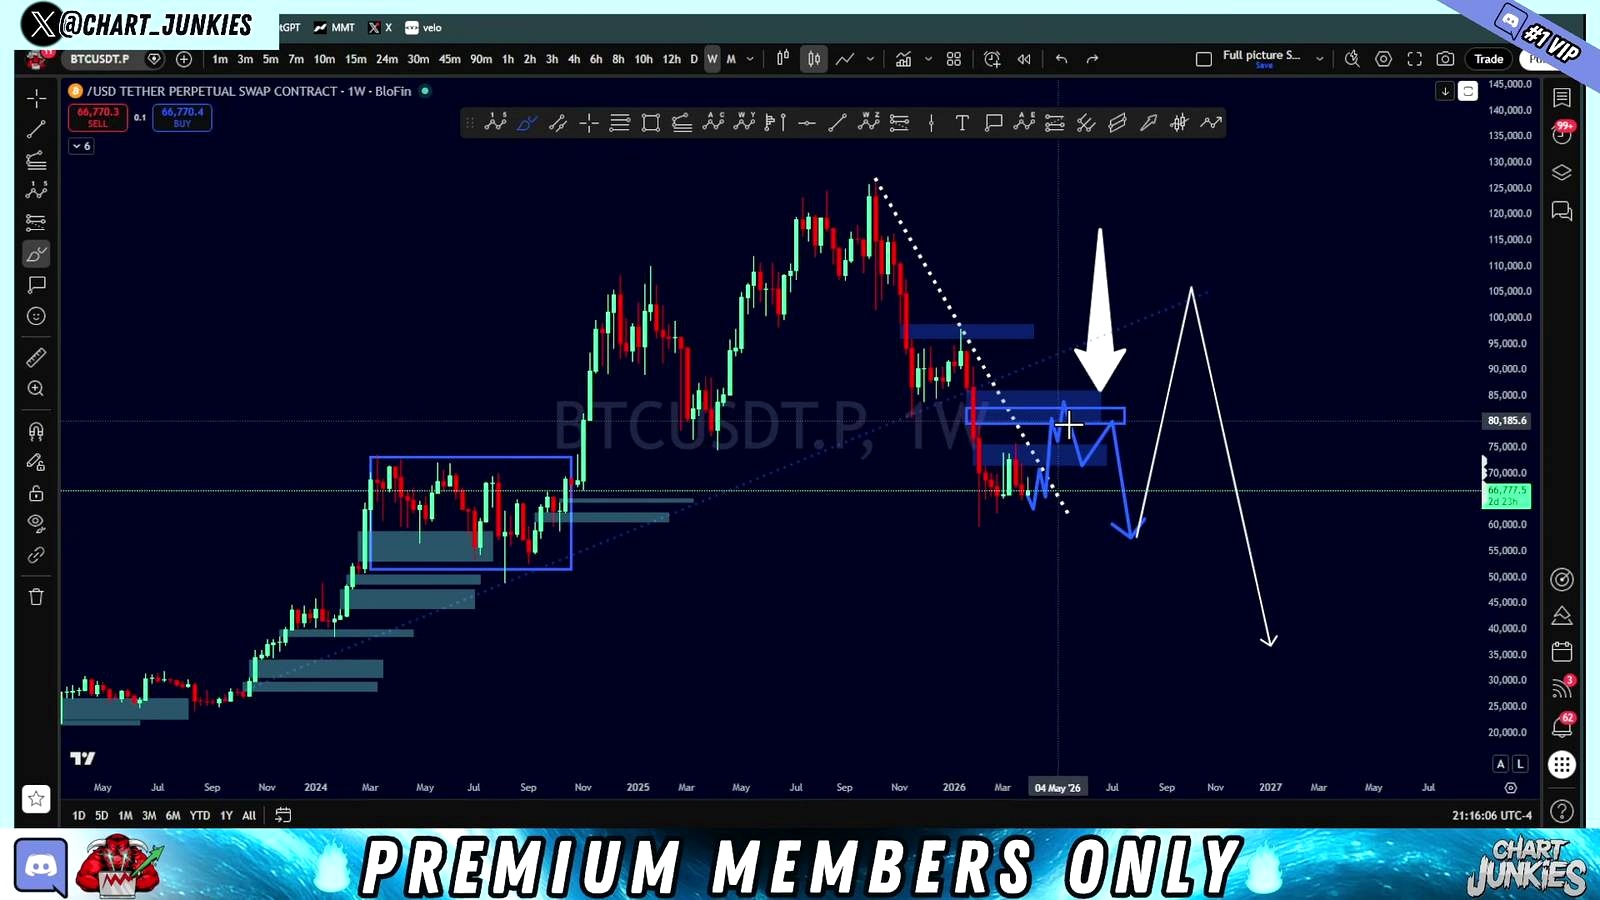
According to Chart Junkie, several signals support an upside move before any larger bearish continuation. First, he said weekly indicators are “bottomed” and pointed to a breakout in weekly RSI from a downtrend, arguing that “the trend is shifting.” He also highlighted “extremely negative” funding rates and said that when funding gets that negative, the market is often close to a more substantial reversal on the macro view.
That logic is straightforward: if too many traders are leaning short at the same time, Bitcoin does not need a major change in fundamentals to rally. It just needs enough upward pressure to force positions out. The analyst also said liquidation and stop-loss clusters are stacked above price on smaller time frames, giving the market “juice for an upside move.” In crypto, that is a classic squeeze setup.
His preferred scenario is the cleanest one: Bitcoin breaks trend-line resistance and starts a stronger move higher into the $80,000 to $84,000 area, with the broader macro correction potentially extending toward $80,000 to $86,000. He also said he would like to see a weekly candle imbalance tapped and then a retest of the broken trend line.
But he did not present that as the only path. The second scenario is a deeper drop in an ending diagonal structure toward $62,000 to $64,000 before the larger bounce begins. That would effectively complete the local downside business first, hit the lower trend line and associated liquidity, and then set up the same broader relief rally. He described that downside leg, if it happens, as likely to be “an absolute dumper.”
The third and least favored route is a max-pain, extended whipsaw structure. In that version, Bitcoin could tag liquidity around $72,000, bounce, then eventually take out lows and sweep a fuller liquidity pocket around $55,000 to $56,000. Even in that more bearish path, the analyst still sees a later rebound, with a peak target near $82,000 in an imbalance region. His objection is less about whether the path is possible and more about how long and painful it would be in time.
What This Means for Traders Right Now
According to Chart Junkie, this is still a market to trade rather than one to predict with absolute confidence. He said the range has been full of fakeouts and compared the current environment to the period before the elections, though “not as long” yet. That comparison matters because it suggests a regime defined by traps, not trend clarity.
For active traders, the message is less “buy now and forget it” than “respect the squeeze risk while staying nimble.” The analyst said he is still longing the market, but only through trades with defined invalidations and favorable risk-reward. That is an important distinction in a structure he openly described as ambiguous on the 6-hour, 4-hour, and even lower time frames.
His view also leans against the emotionally dominant narrative. He argued that the “dump happened” already and that the market may now be moving into a phase where traders can play smaller up-down corrective swings with a slight upward bias. In other words, he sees the easy momentum short as largely over, even if another downside sweep remains possible.
That does not make the bullish case consensus. If anything, it sounds like a tactical contrarian position inside a still-fragile market. Plenty of traders would argue that a rally into the low-$80,000s is exactly where late bulls get trapped before a deeper washout. The distinction will come down to structure: whether upside moves start to look impulsive and reclaim broken resistance, or whether they stay choppy and fail quickly into overhead supply.
What Could Go Wrong
The clearest way to break Chart Junkie’s preferred thesis is simple: Bitcoin fails to reclaim trend resistance and instead loses support with strong momentum. The analyst himself said his bias would change on a “monster wick to the downside.” In practice, a fast flush through nearby lows that does not reverse cleanly would strengthen the case that the market is still in a true impulsive downtrend rather than a corrective rebound phase.
There are also risks the video only touched indirectly. One is macro. A sharp deterioration in liquidity conditions, hotter-than-expected inflation data, rising Treasury yields, or broad equity weakness can overwhelm even the best-looking crypto squeeze setup. Bitcoin can remain reflexive and short-squeezable, but it does not trade in a vacuum when macro stress intensifies.
The other risk is structural. Negative funding alone is not a bottom signal. Markets can stay crowded and oversold longer than traders expect, especially in cascading deleveraging phases. If the market starts moving toward the analyst’s lower alternative targets around $62,000 to $64,000 or even $55,000 to $56,000, traders expecting an immediate breakout could get chopped badly before any real reversal appears.
The bear case, then, is not just “Bitcoin goes lower.” It is that this entire range is distribution, the rally targets in the low-$80,000s never fully print, and every bounce remains corrective until a much deeper reset is complete.
What to Watch Next
The first trigger is whether Bitcoin can decisively break and hold above the trend line Chart Junkie is watching on the daily and weekly structure. If that happens, traders will likely start focusing on the $80,000 to $84,000 zone, and potentially the broader $80,000 to $86,000 region.
If instead price breaks lower impulsively, the next areas to watch are the analyst’s $62,000 to $64,000 downside target and then the deeper liquidity pocket around $55,000 to $56,000. A stop-hunt near $72,000 also fits his max-pain scenario.
Beyond price, derivatives positioning matters. If funding stays deeply negative while Bitcoin stops making lower lows, that would support the squeeze thesis. If funding normalizes but price still weakens, the market may be signaling that the downside is not finished.
FAQ
What is a flat correction in Elliott Wave analysis?
A flat correction is a three-part corrective structure, usually labeled ABC, where price moves against the main trend in a choppy way rather than a clean impulse. In crypto trading, it often shows up as a frustrating range with repeated fakeouts before a larger move resumes.
What does negative funding mean for Bitcoin?
Negative funding usually means short traders are paying long traders in perpetual futures markets. That often signals bearish positioning is crowded. It can support an upside squeeze, though it is not a guarantee of a bottom.
Why do traders watch liquidation heatmaps?
Liquidation maps show where leveraged positions may be forced out if price reaches certain levels. Markets often move toward those zones because forced liquidations can accelerate momentum and create fast, self-reinforcing moves.
How is a corrective rally different from a new bull trend?
A corrective rally is a rebound inside a broader uncertain or bearish structure. It can be sharp and tradable, but it does not necessarily mean the larger downtrend is over. A new bull trend usually shows stronger impulsive structure, sustained reclaim of resistance, and better follow-through after pullbacks.
What happened in prior Bitcoin rebounds after heavy short positioning?
Historically, Bitcoin has often produced violent relief rallies after funding turns deeply negative and traders crowd into shorts. Some of those rallies marked durable lows, while others were only temporary squeezes before another leg down. The difference usually becomes clear only after key resistance levels are reclaimed or rejected.
Video Reference

Omar Al-Sharif lives and works in the UAE and is involved in the blockchain technology industry. He writes articles on Bitcoin and digital assets as a personal passion, explaining complex topics in simple and understandable language.


