Markets are stuck between two competing narratives: a breakout back into trend or the start of the larger unwind many bears have been calling for. According to VisionPulsed, Bitcoin’s short-term momentum now looks strong enough to delay the long-expected slide toward $50,000, with a break above $70,000 potentially opening the door to another sharp rally first.
Core thesis: bullish momentum now, macro risk later
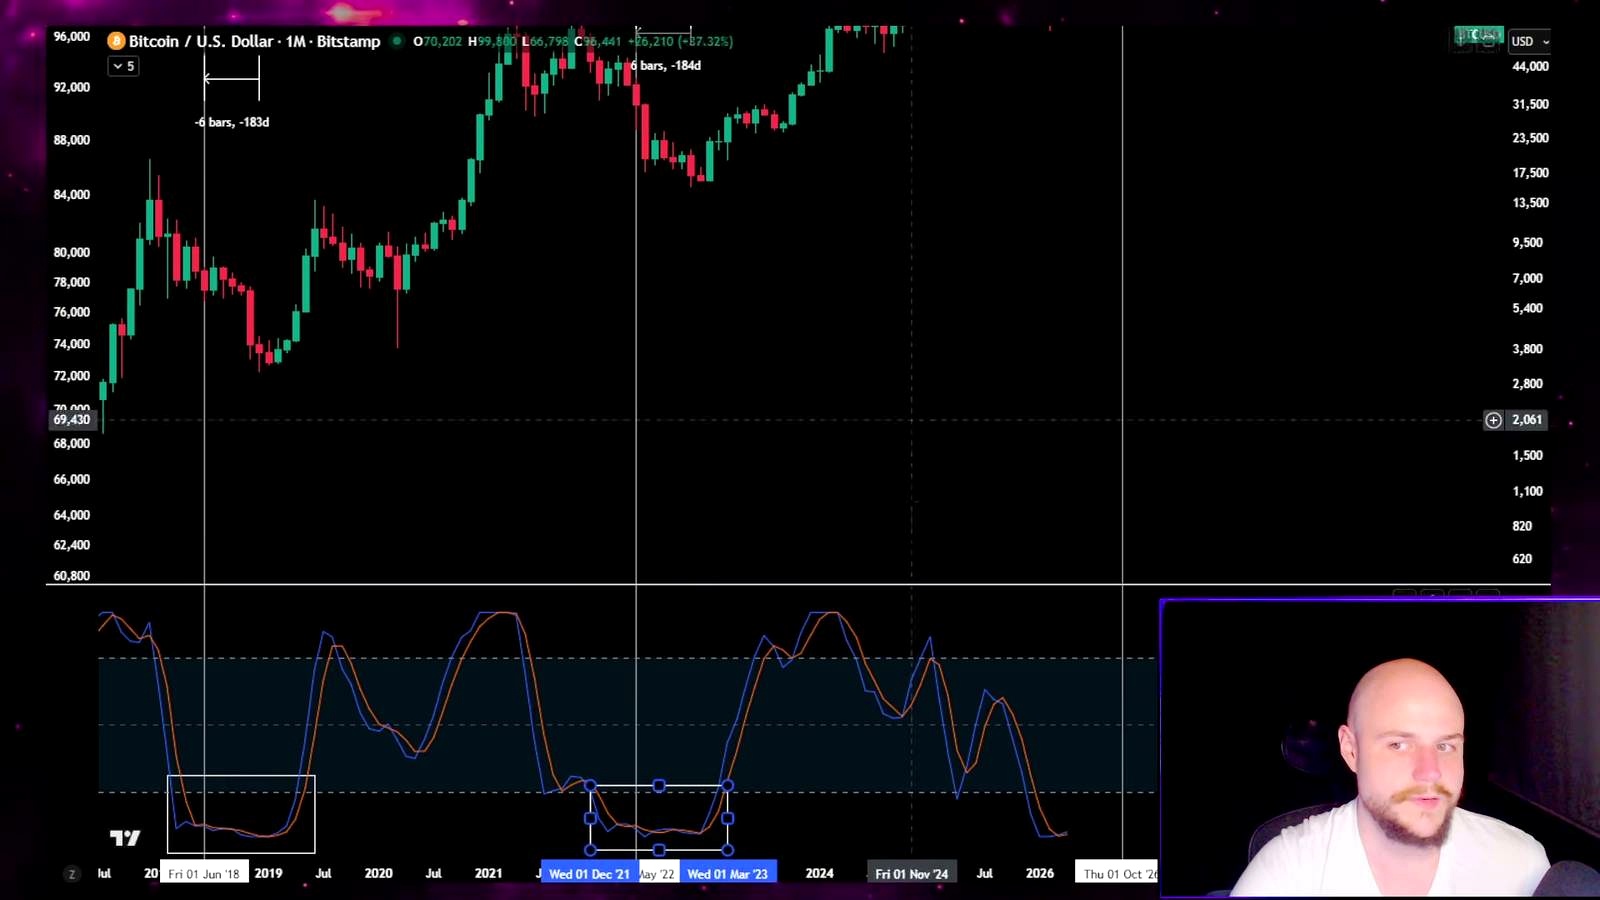
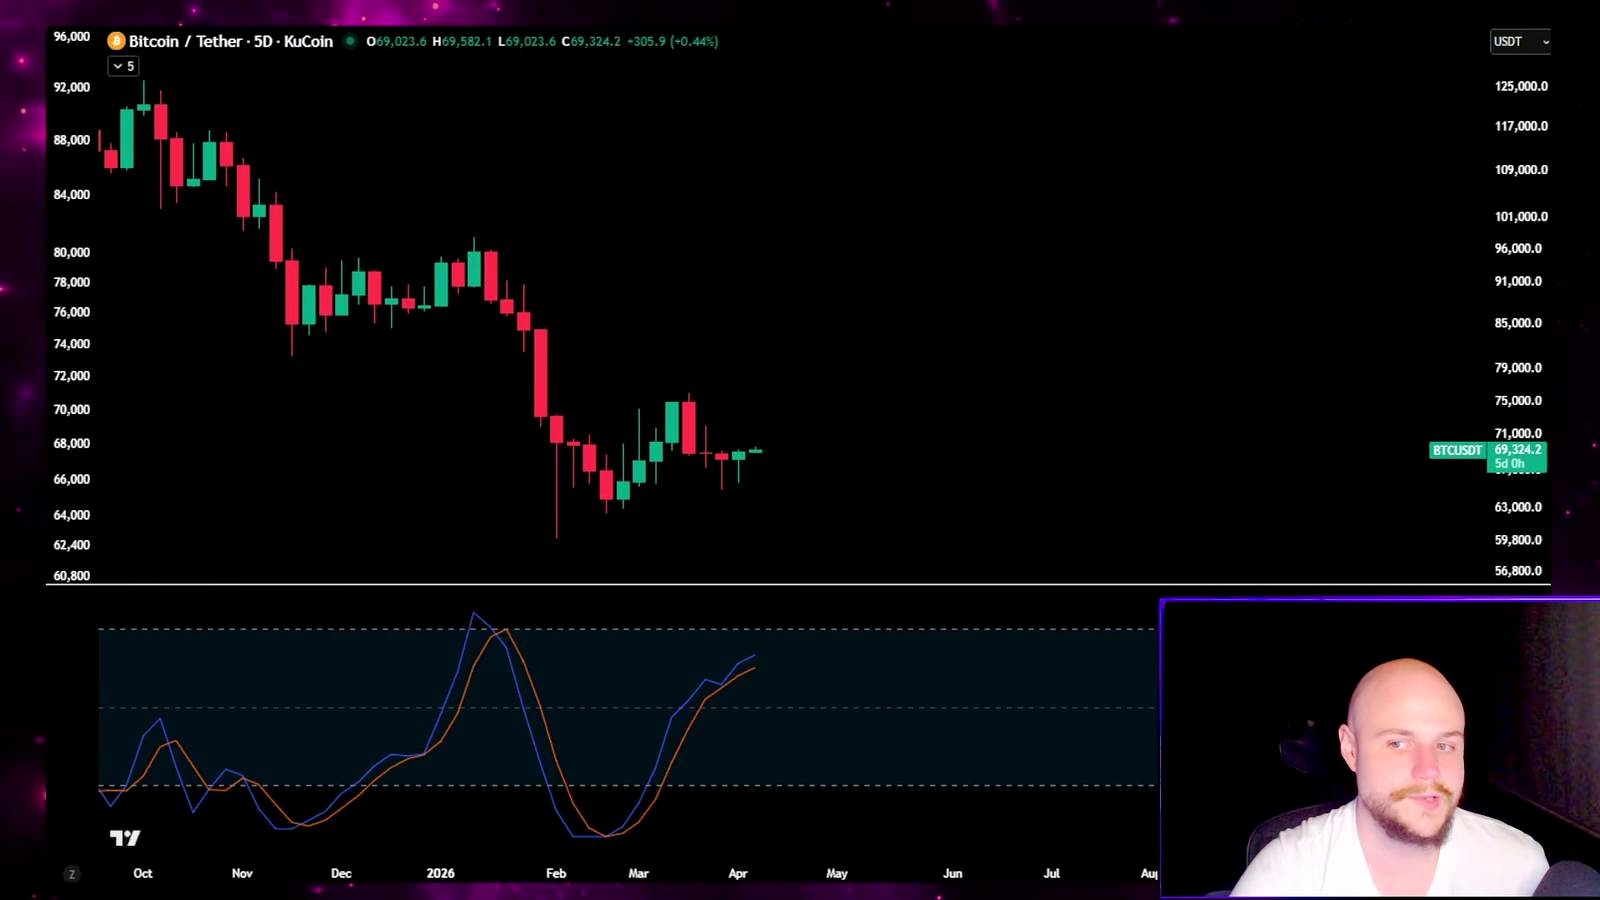
According to VisionPulsed, the key change in Bitcoin’s setup is that short-term momentum has turned bullish even as the broader market structure still looks fragile. The analyst says he can no longer argue confidently for an immediate move to sub-$50,000 because the 5-day stochastic RSI is rising and Bitcoin has printed a weekly higher high. In his view, that combination leaves room for a near-term upside move even if the larger bear-market thesis remains intact.
The clearest level in the video is $70,000. VisionPulsed argues that a break above that threshold could trigger a “monster rally, ” especially if a trendline break coincides with short-term momentum pushing into overbought territory. He also flags the next FOMC meeting as a possible catalyst if it lands at the same time the 5-day stochastic RSI reaches an extreme. He stops short of making a directional macro call from the Fed alone, but the implication is that timing matters: technical momentum plus a macro event can amplify price moves.
That stance sits in an awkward middle ground relative to broader market sentiment. On one side, structurally bullish traders point to Bitcoin’s resilience near prior highs, steady institutional access through spot ETF-era demand, and the market’s habit of squeezing shorts when momentum indicators re-accelerate. On the other, macro-sensitive traders remain wary of sticky rates, fading liquidity, and the fact that late-cycle rallies often fail once momentum exhausts itself.
Historically, Bitcoin can remain bid longer than bearish cycle models imply, especially when derivatives positioning gets too one-sided. But the opposite is also true: momentum indicators can improve during broader distribution phases without marking the start of a durable bull leg. That is why VisionPulsed’s framing matters right now. It is not an all-clear call. It is a warning that the bearish timetable may be slipping even if the bearish destination has not changed.
Supporting analysis: the rally setup, Coinbase divergence, and Dogecoin spillover
VisionPulsed’s supporting case rests on a distinction between short-term momentum and macro trend. The host says the market has spent roughly 6 months in a bear phase and that his historical model had pointed to weakness in January, February, March, and April. But because March did not deliver the expected breakdown, and April may not either, he says traders need to respect what real-time price action is showing rather than force an older template onto current conditions.
The technical trigger is straightforward: if Bitcoin clears $70,000, the analyst believes upside could accelerate. He adds that the move could unfold over the next 2 to 3 weeks, not necessarily in a single burst. He also says he would rather acknowledge that possibility now than after the market is already trading at $75,000.
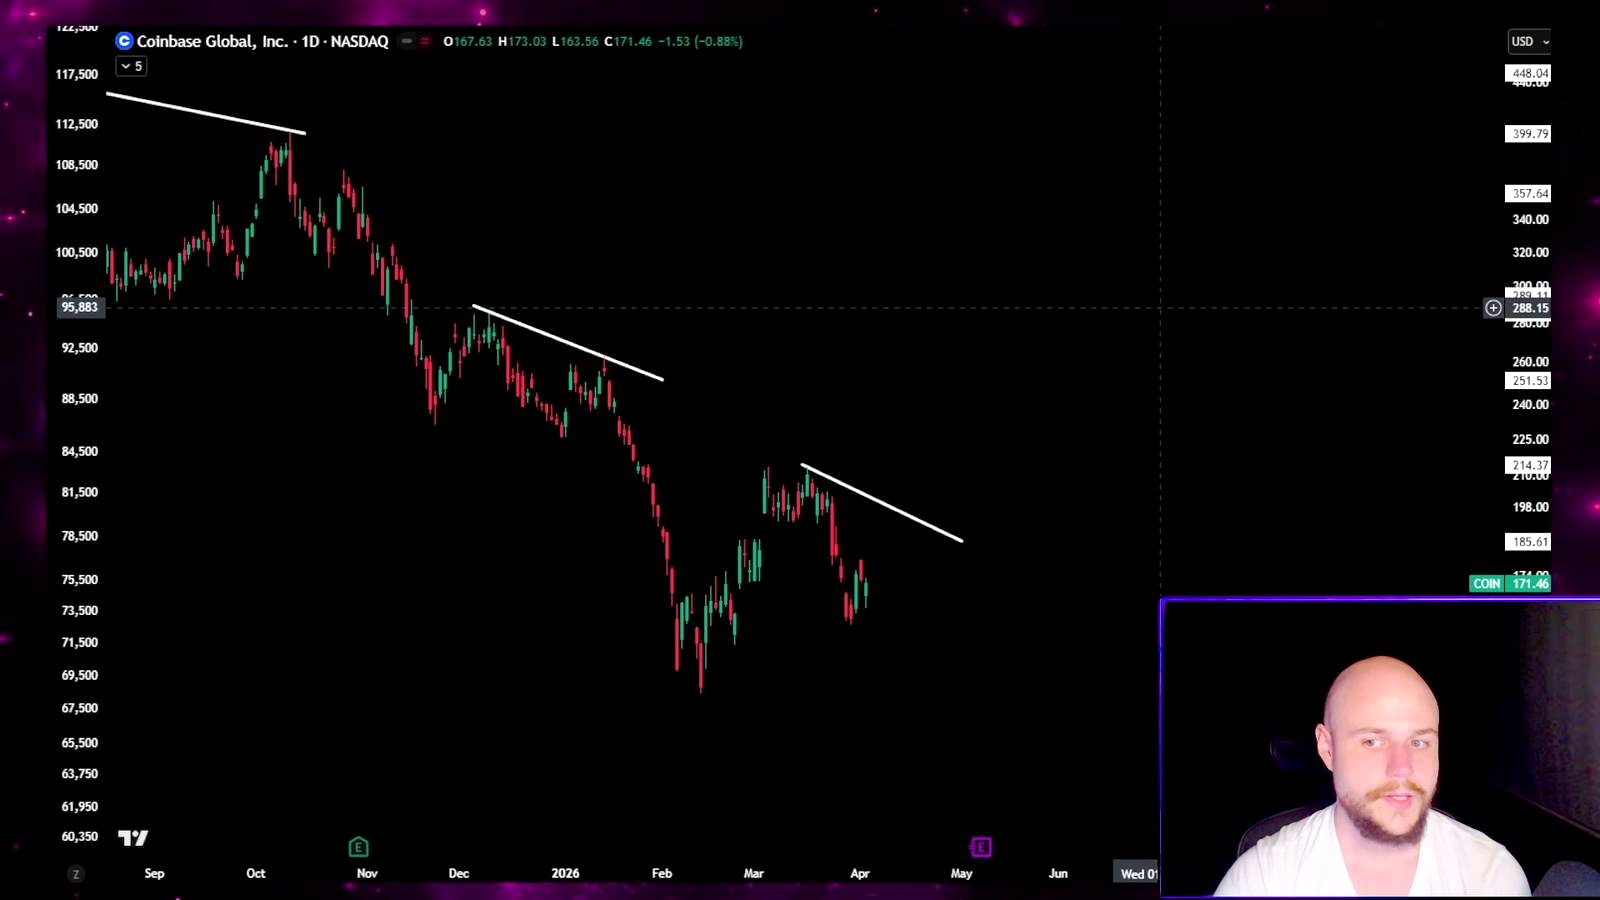
At the same time, VisionPulsed keeps returning to market-internals style confirmation signals rather than price alone. The main one is Coinbase. He argues that if Coinbase stock makes another lower high while Bitcoin rallies, that would be a bearish divergence and a warning that the move lacks healthy participation. He points to similar lower-high behavior between July and October, again in January, and during prior cycle turning points, including 2022. He extends the same logic to MicroStrategy: if Bitcoin pushes up but proxy equities lag, he sees that as a “bear signal flashing.”
That is a useful framework because crypto-equity underperformance has often shown up when spot enthusiasm outruns broader risk appetite. It is not a perfect signal, but it can help differentiate a sustainable expansion from a squeeze-driven move.
The video also broadens the setup to Dogecoin. VisionPulsed says Dogecoin’s 5-day momentum is also bullish, which makes an immediate crash to $0.05 harder to argue. His view is that another green candle in DOGE would no longer be surprising. But he still expects that strength to fail later, warning that a meme-coin spike could drag retail back into the market just as the broader cycle becomes more dangerous.
The broader implication is familiar to crypto veterans: late-stage reflex rallies often spread first from Bitcoin into high-beta names, creating the appearance of an “alt season” before momentum reverses. VisionPulsed explicitly warns that if such a push happens, many traders may mistake it for the start of a new bull run.
What could go wrong
The most obvious risk to VisionPulsed’s thesis is that the market never gets the clean upside confirmation he wants. A failure below $70,000, especially if accompanied by weakening momentum or a sharp rejection around resistance, would undercut the case for a final upside squeeze. If Bitcoin rolls over before the stochastic RSI reaches the kind of overbought condition he is watching for, the delayed-crash narrative starts to look less like patience and more like a missed timing call.
There is also a more structural counterargument. VisionPulsed repeatedly describes the market as being in a bear phase for 6 months, but many participants would dispute that framework outright, especially in an environment where Bitcoin has traded close to all-time highs and institutional access has broadened. If this is not a bear-market analogue but rather a mid-cycle consolidation, then a breakout above $70,000 might not be a trap at all. It could be continuation.
Another weakness is signal dependence. Coinbase and MicroStrategy can diverge from Bitcoin for company-specific reasons, equity market rotations, or valuation compression unrelated to spot crypto demand. Treating their lower highs as definitive proof of a bearish setup can produce false negatives.
Finally, the analyst’s downside thesis leans heavily on historical timing analogues, including the idea that the next 6 months should be the worst stretch and that around 183 days pre-bottom has marked a dangerous zone in past cycles. The problem is that Bitcoin’s market structure changes over time. ETF flows, corporate treasury exposure, options market depth, and macro policy expectations can all distort older cycle templates. History rhymes in crypto, but it rarely repeats cleanly.
What to watch next
The first trigger is simple: whether Bitcoin can break and hold above $70,000. If that level gives way with expanding momentum, VisionPulsed’s rally case strengthens materially. The second is whether the 5-day stochastic RSI pushes into overbought conditions as price rises, especially around the next FOMC meeting.
After that, traders should watch confirmation from related equities. If Bitcoin rallies but Coinbase and MicroStrategy print lower highs, the analyst would treat that as evidence the move is vulnerable. On the downside, a bearish engulfing candle after an overbought momentum reading would be one of the clearest invalidation signals for the short-term bullish case and a potential green light for the larger bearish thesis to reassert itself.
FAQ
What is stochastic RSI, and why do Bitcoin traders watch it?
Stochastic RSI is a momentum indicator built from the relative strength index rather than price directly. It is designed to show whether an asset’s momentum is accelerating toward overbought or oversold extremes. Crypto traders use it to spot potential trend continuation, exhaustion, or reversal zones, especially on shorter time frames like the 5-day signal discussed here.
Why would Coinbase or MicroStrategy matter for a Bitcoin rally?
Both are widely used as proxy trades for Bitcoin exposure in traditional markets. When Bitcoin rises but crypto-linked equities fail to confirm the move, some traders read that as a sign that broader risk appetite is weak or that the rally is narrow and vulnerable. It is not a perfect read-through, but it can provide context beyond spot price alone.
What is a bearish engulfing candle?
A bearish engulfing candle is a candlestick pattern in which a red candle fully overtakes the body of the previous green candle. Traders often treat it as a reversal warning, especially after a strong run-up or when momentum indicators are already overbought.
How is this different from calling for a new Bitcoin bull run?
The distinction is duration and structure. VisionPulsed is arguing for a possible short-term or medium-term rally driven by improving momentum, not necessarily the start of a sustained multi-month expansion. In his framework, a breakout could still be followed by a larger decline once that momentum fades.
What happened in past crypto cycles around the market’s midpoint?
In prior cycles, Bitcoin and altcoins have sometimes staged sizable countertrend rallies around the middle of a broader drawdown before eventually making lower lows or enduring long recovery periods. Traders study those periods because they often create the most confusion: the move feels bullish enough to attract fresh buyers, but not all of those rallies turn into durable trend reversals.
Source

Omar Al-Sharif lives and works in the UAE and is involved in the blockchain technology industry. He writes articles on Bitcoin and digital assets as a personal passion, explaining complex topics in simple and understandable language.


