Is this the start of a deeper BTC washout, or the setup for the next major long entry? Crypto Rover says the market is already breaking key structure, with downside levels now coming into focus fast.
According to Crypto Rover, Bitcoin is losing momentum at the same time it is breaking a support zone that had held multiple times before. His core takeaway is clear: the chart has turned fragile in the short term, and he sees a meaningful chance of a move into the mid-$50, 000 range, with an extreme downside scenario near $45, 000.
The key level now is the mid-$50, 000s
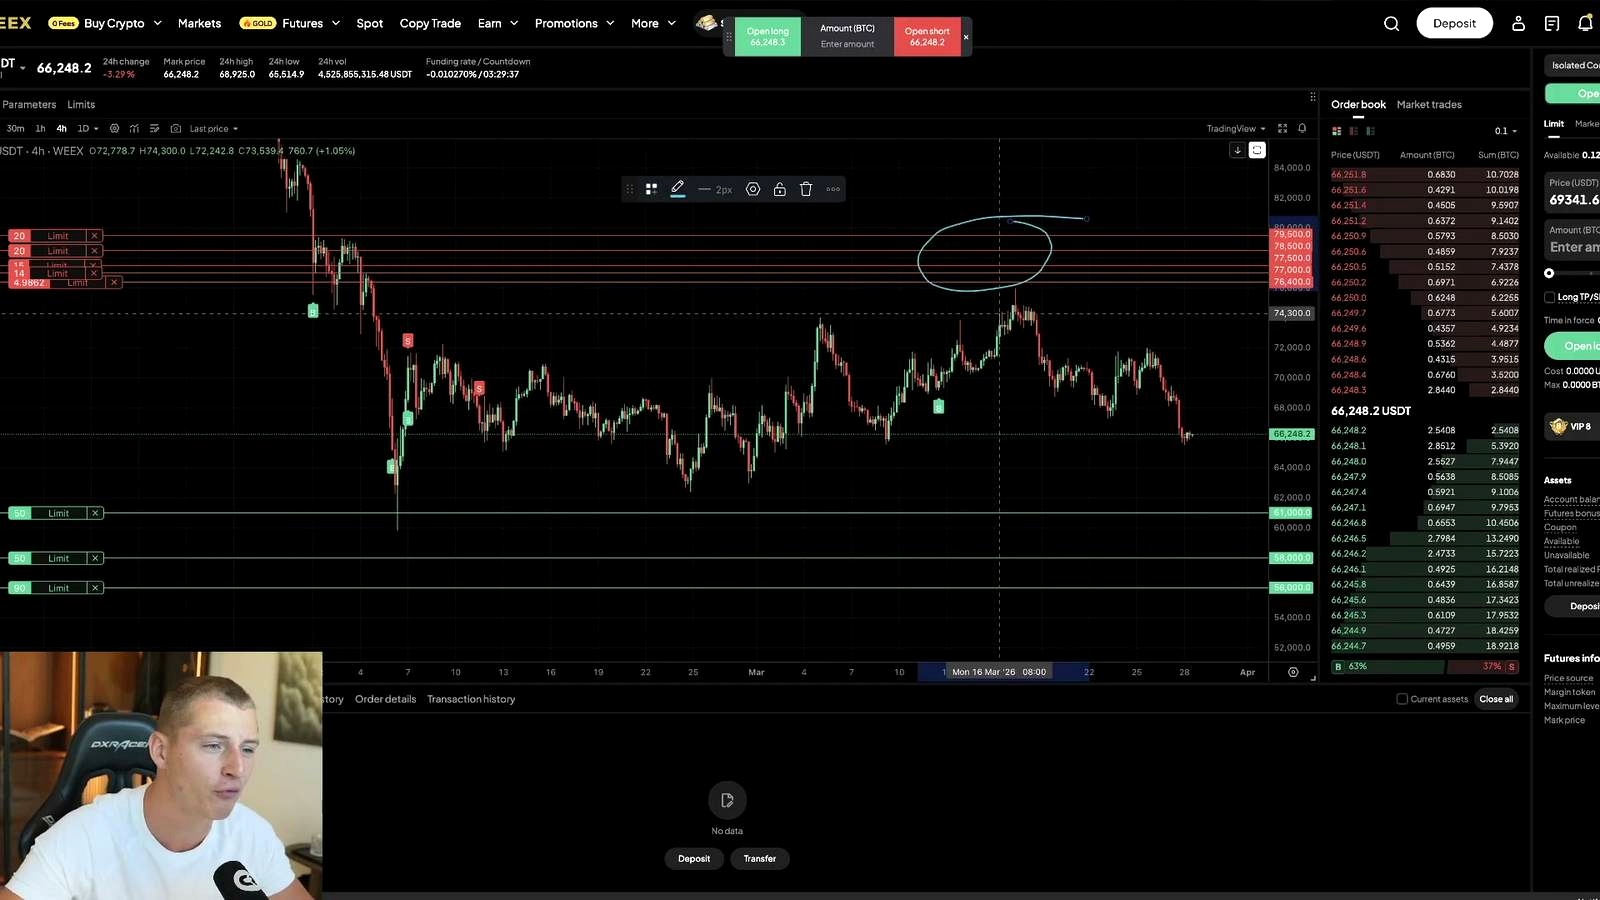
The most actionable part of the call is not the warning itself, but where the analyst says he would respond. He identifies major support between $54, 000 and $57, 000, and repeatedly points to roughly $57, 000 as a major level. He also says his preferred accumulation zone begins around $60, 000 and lower.
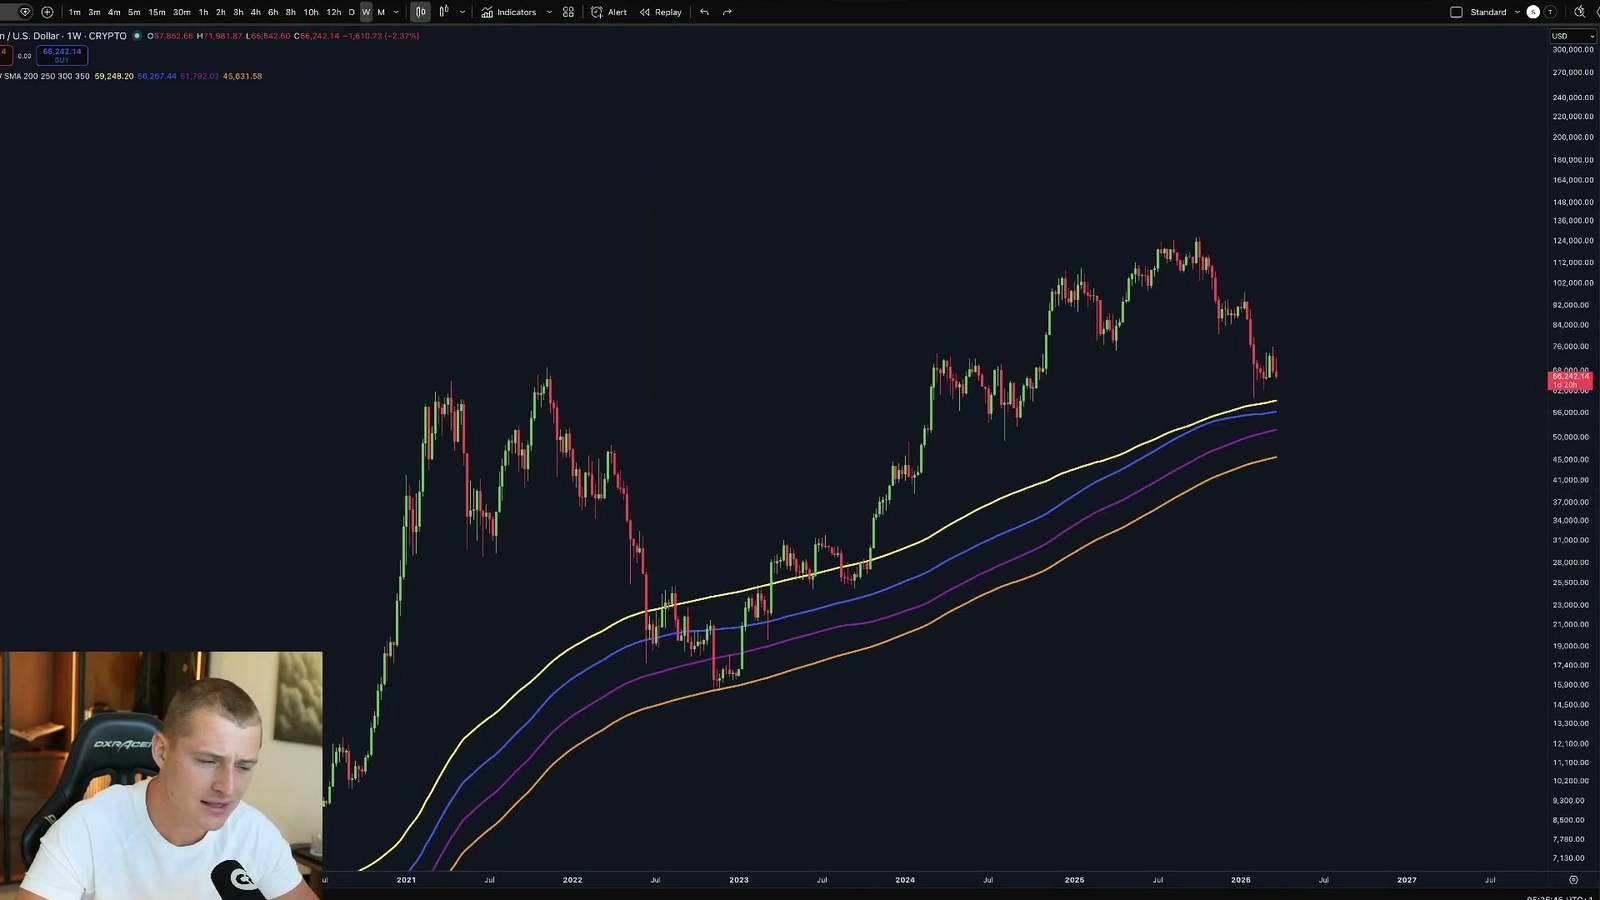
That makes this a two-stage framework. First, Bitcoin has to deal with the immediate damage from a technical breakdown. Then traders need to watch whether price can stabilize in the upper- to mid-$50, 000s. If not, Crypto Rover argues that the “ultimate worst-case scenario” would be a drop toward the 350-week moving average, which he places around $45, 000.
- $60, 000 and lower: area where he says he would begin building a large long position
- $54, 000, $57, 000: major support zone highlighted in the video
- $57, 000: singled out as a key support level
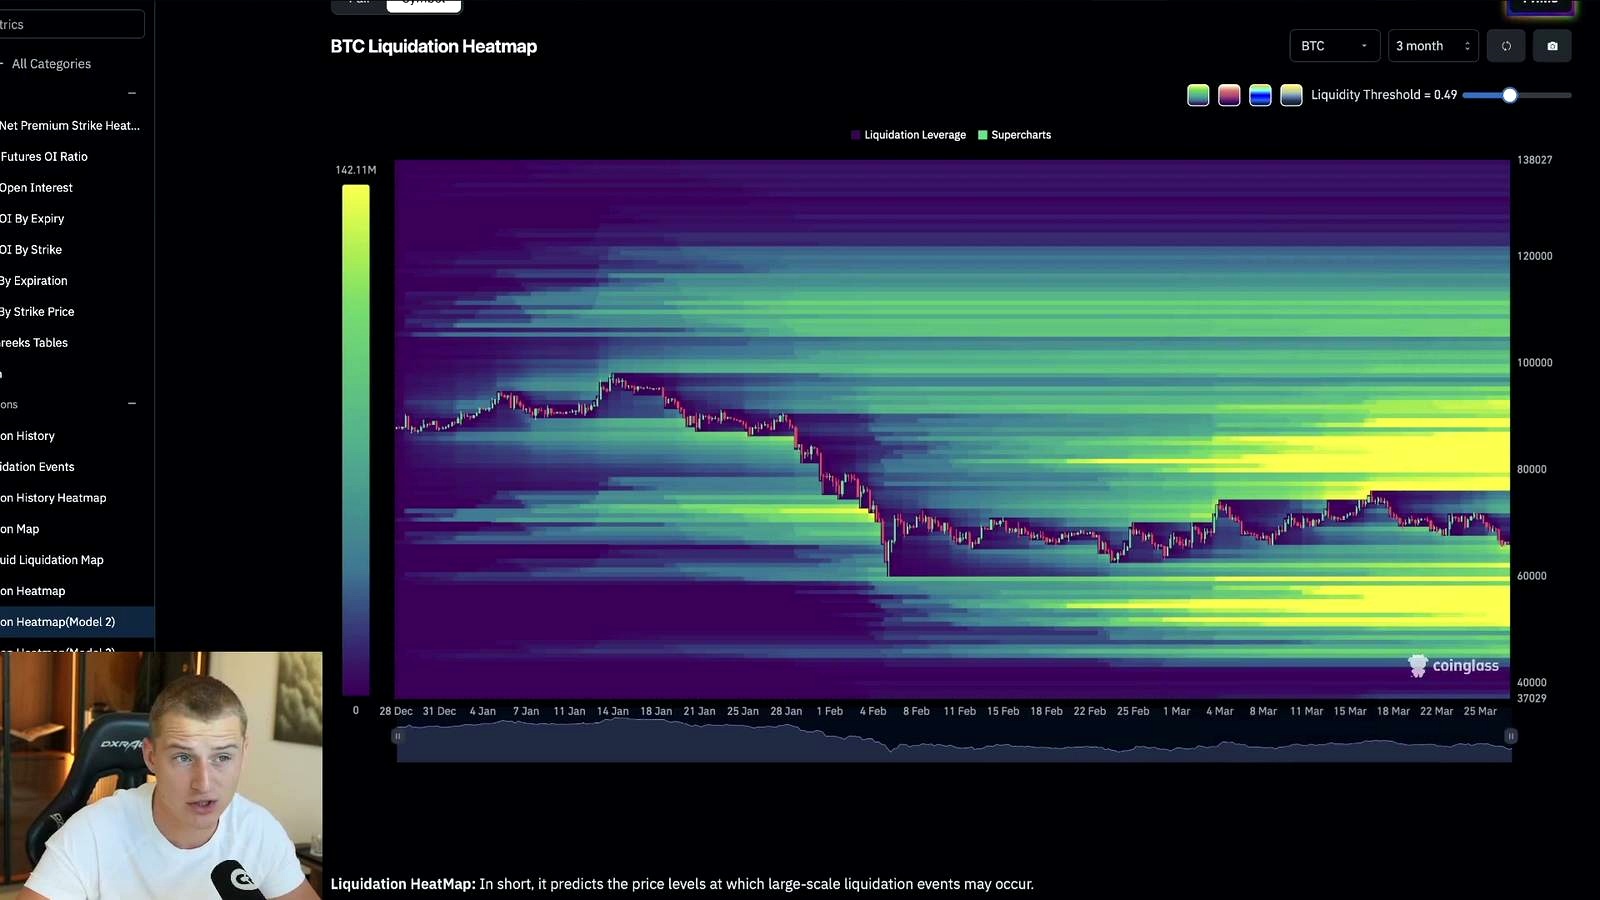
- $50, 000: liquidity heatmap area he says is worth watching
- $45, 000: worst-case target tied to the 350-week moving average
Why he thinks Bitcoin is breaking down
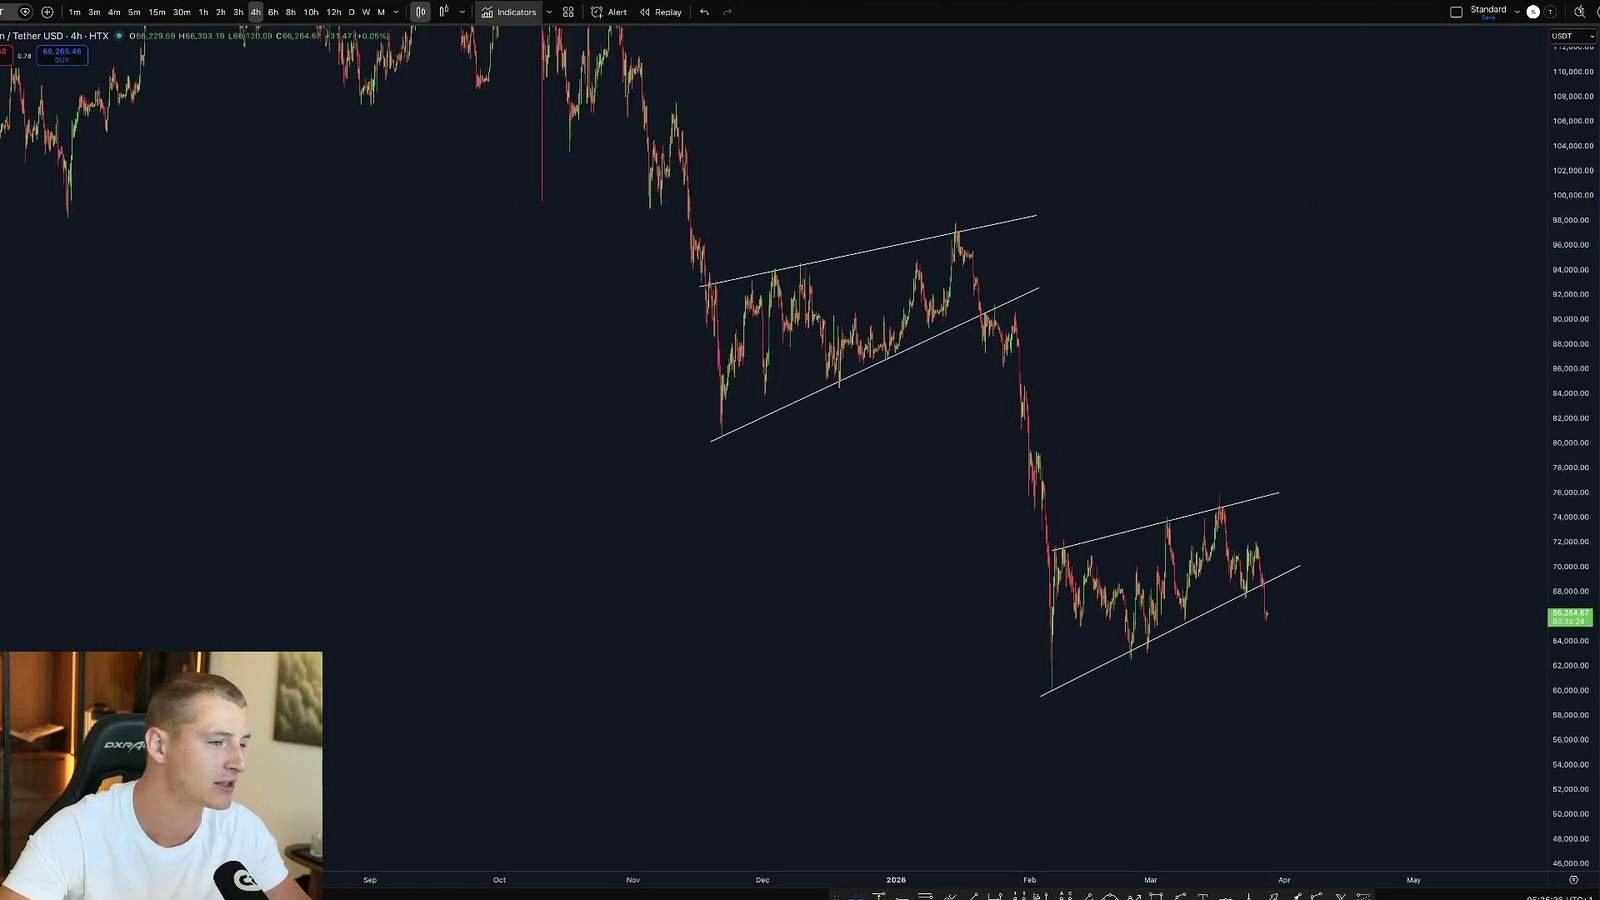
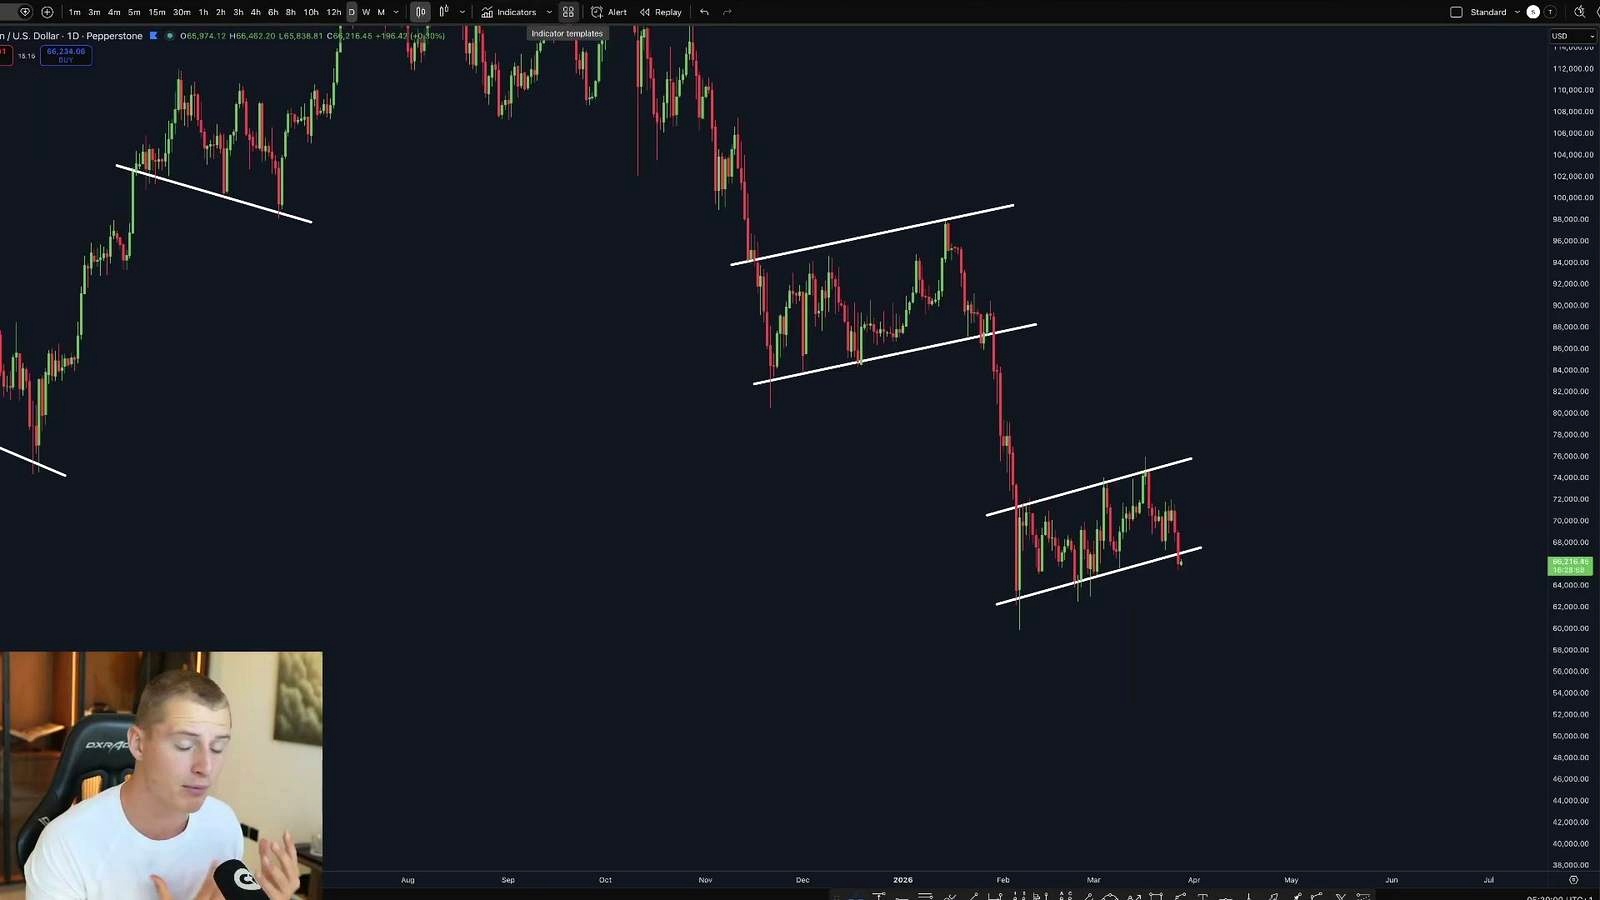
Crypto Rover’s bearish near-term view rests on both chart structure and macro pressure. On the technical side, he says Bitcoin has broken one of its most important support levels after bouncing from it more than four times. He also describes two bearish formations: a rising wedge and a bear flag on the daily timeframe.
His argument is that these patterns matter more once support gives way. He says the last retest of the support area failed, and the break was followed immediately by a sharp move lower. In his reading, any retest of the broken level could now act as resistance rather than support.
That is the technical backdrop for his warning. In plain terms, he sees Bitcoin as having shifted from a market trying to hold structure to one that is starting to break it.
The macro trigger: oil, inflation, and rate expectations
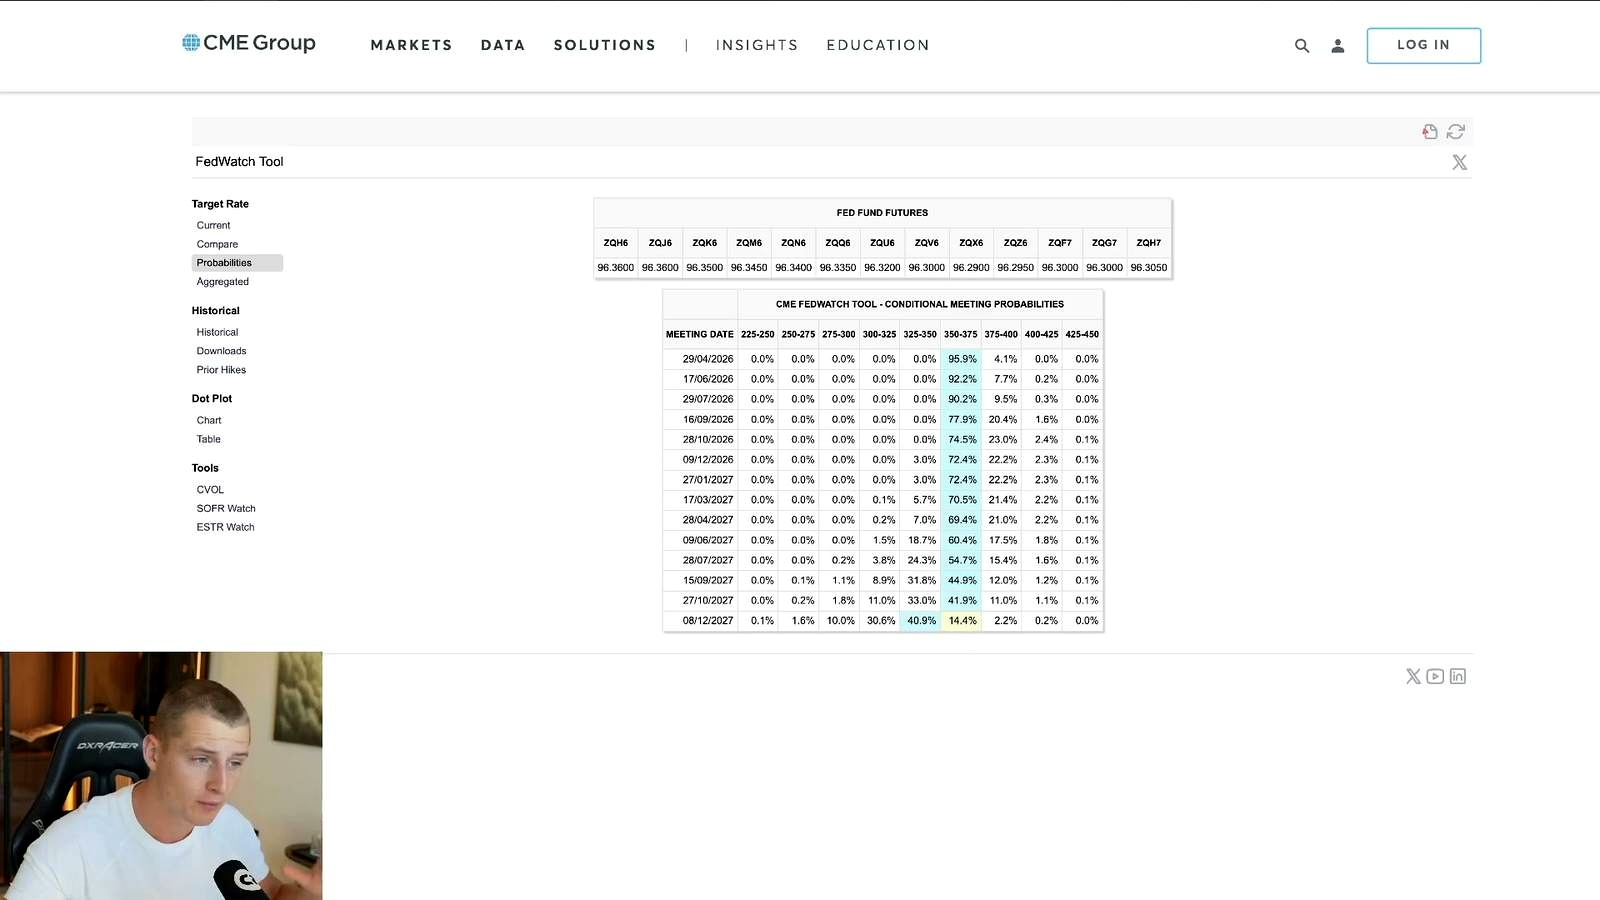
Crypto Rover argues that the broader catalyst sits outside crypto. He ties the current weakness to a surge in oil prices linked to conflict in the Middle East. His macro logic is straightforward: higher oil and gas prices raise inflation pressure, which can force tighter policy and reduce the odds of near-term rate cuts.
He says markets had previously been leaning toward a rate cut at the next meeting, but that expectation has changed. In his telling, there is now a 20% to 23% chance of a rate increase in 2026, compared with what he describes as previously a 0% chance.
The host also frames oil shocks in historical terms. He says that when oil prices surge more than 50% unexpectedly, recessions have followed in prior episodes. The dates he references are 1975, 1980, the 1990s, 2001, 2008, and 2020.
For Bitcoin traders, his point is less about a detailed recession forecast than about market sequencing. In the short term, he sees rising energy costs as bearish because they tighten financial conditions. Over a longer horizon, however, he says recessions tend to bring aggressive easing and stimulus, which historically helps risk assets recover strongly later.
What the S&P 500 has to do with BTC
Crypto Rover does not view Bitcoin in isolation. He says the S&P 500 had already been flashing a bearish rounding top, and he believes the index has now broken lower from that structure. If equities continue falling, he expects that weakness to weigh on Bitcoin as well.
This matters because his BTC view is partly conditional on what happens in traditional markets. A deteriorating equity backdrop would support his bearish short-term case. A fast improvement in the macro situation, on the other hand, could soften or interrupt the decline.
He leaves room for that possibility, saying conditions could improve quickly. But the thrust of his update is that current market structure still points down.
His timing call: a bottom may still be weeks away
One of the more specific timing remarks in the video is his estimate that the cycle may need another 50 days before a bottom is formed. He also says there could be strong countertrend bounces on the way down, citing a previous move where Bitcoin rebounded about 50% after retesting long-term weekly moving averages.
That combination is important. He is not describing a straight-line collapse. He is describing a market that could continue trending lower while still producing sharp rallies that complicate positioning.
His liquidity heatmap reference points to interest down to about $50, 000, reinforcing the idea that lower levels may act like a magnet before the market finds a more durable floor.
How he plans to trade it
Crypto Rover says he intends to build a large Bitcoin long position on the way down rather than wait for one exact bottom print. His framework starts below $60, 000, becomes more aggressive in the $54, 000 to $57, 000 range, and would intensify again near $45, 000 if price reaches that area.
He explicitly says he would reopen longs even after liquidation as part of trying to catch a major bottom. He presents that as a strategy aimed at securing a strong average entry during a bear-market-style low and then holding through a later bull market advance.
He also compares this plan with a past trade he says he opened at $17, 000, roughly $400 to $500 above the prior bear market bottom, before later closing it at $35, 000. This time, he says, he would aim to hold longer.
That trading plan is his own approach, not a neutral market description. The cleaner market takeaway is that he sees value emerging lower, but not yet enough evidence to declare the correction finished now.
What to watch next for Bitcoin
The next checkpoints are straightforward. First, watch whether Bitcoin confirms the breakdown from the broken support and bear flag rather than reclaiming the lost structure. Second, monitor the major support area between $54, 000 and $57, 000. Third, keep an eye on macro signals tied to oil, inflation, and rate expectations, as well as whether the S&P 500 extends its own decline.
If those pressures intensify, Crypto Rover’s lower targets stay in play. If macro conditions calm quickly and Bitcoin reclaims broken levels, the market could interrupt the bearish setup before it reaches the deeper support zones he outlined.
FAQ
What is Crypto Rover’s main Bitcoin price target right now?
His primary support focus is $54, 000 to $57, 000, with $57, 000 mentioned as a major level. He says he would start building longs around $60, 000 and lower.
Did he give a worst-case scenario for BTC?
Yes. He points to about $45, 000 as the extreme downside case, tying that level to the 350-week moving average.
Why does he think macro matters so much here?
He links Bitcoin weakness to higher oil and gas prices, which he says can increase inflation pressure and reduce the chance of easier monetary policy. In his framework, tighter policy is bearish for both stocks and BTC in the short term.
Is he calling for an immediate bottom?
No. He says Bitcoin could still be in the early phase of a breakdown and estimates there may be another 50 days before a bottom is formed, even if tradable bounces happen before then.
What outside market is he watching alongside Bitcoin?
The S&P 500. He says its bearish rounding-top structure and lower break could drag Bitcoin down further if equities continue to weaken.
Original Video

John Burnell focuses on Bitcoin infrastructure, wallet security and blockchain technology. He writes educational articles explaining how Bitcoin works and how the technology evolves.


