Bitcoin is once again building up a major amount of liquidity below current price, and historically when liquidity builds on only one side, it tends to get grabbed. At the same time, key chart structures, larger support zones, and rising 10-year yields are creating a cautious backdrop for Bitcoin and the broader market.
The short-term chart remains critical, while the bigger picture suggests that Bitcoin may still move lower before a stronger relief rally appears. Market conditions are also being pressured by rising yields, weakening economic data, and growing concerns around recession risk.
Bitcoin Liquidity Is Building Below
A major focus right now is the liquidity sitting below current Bitcoin price. The view presented is that whenever liquidity builds up on only one side, Bitcoin usually moves to take it. At the moment, that lower-side liquidity is seen as a major factor that could pull price down further.
The liquidation heat map shows a large cluster of liquidity below. Because of that, the expectation is that Bitcoin will ultimately grab this liquidity before the market decides where the next major zone will form.
Why This Matters
- Bitcoin is building a major amount of liquidity below current price.
- Historically, one-sided liquidity tends to get filled.
- A large lower liquidity cluster is viewed as difficult to ignore.
- The next major liquidity zone after that is seen around $67,000.
Short-Term Bitcoin Chart Levels to Watch
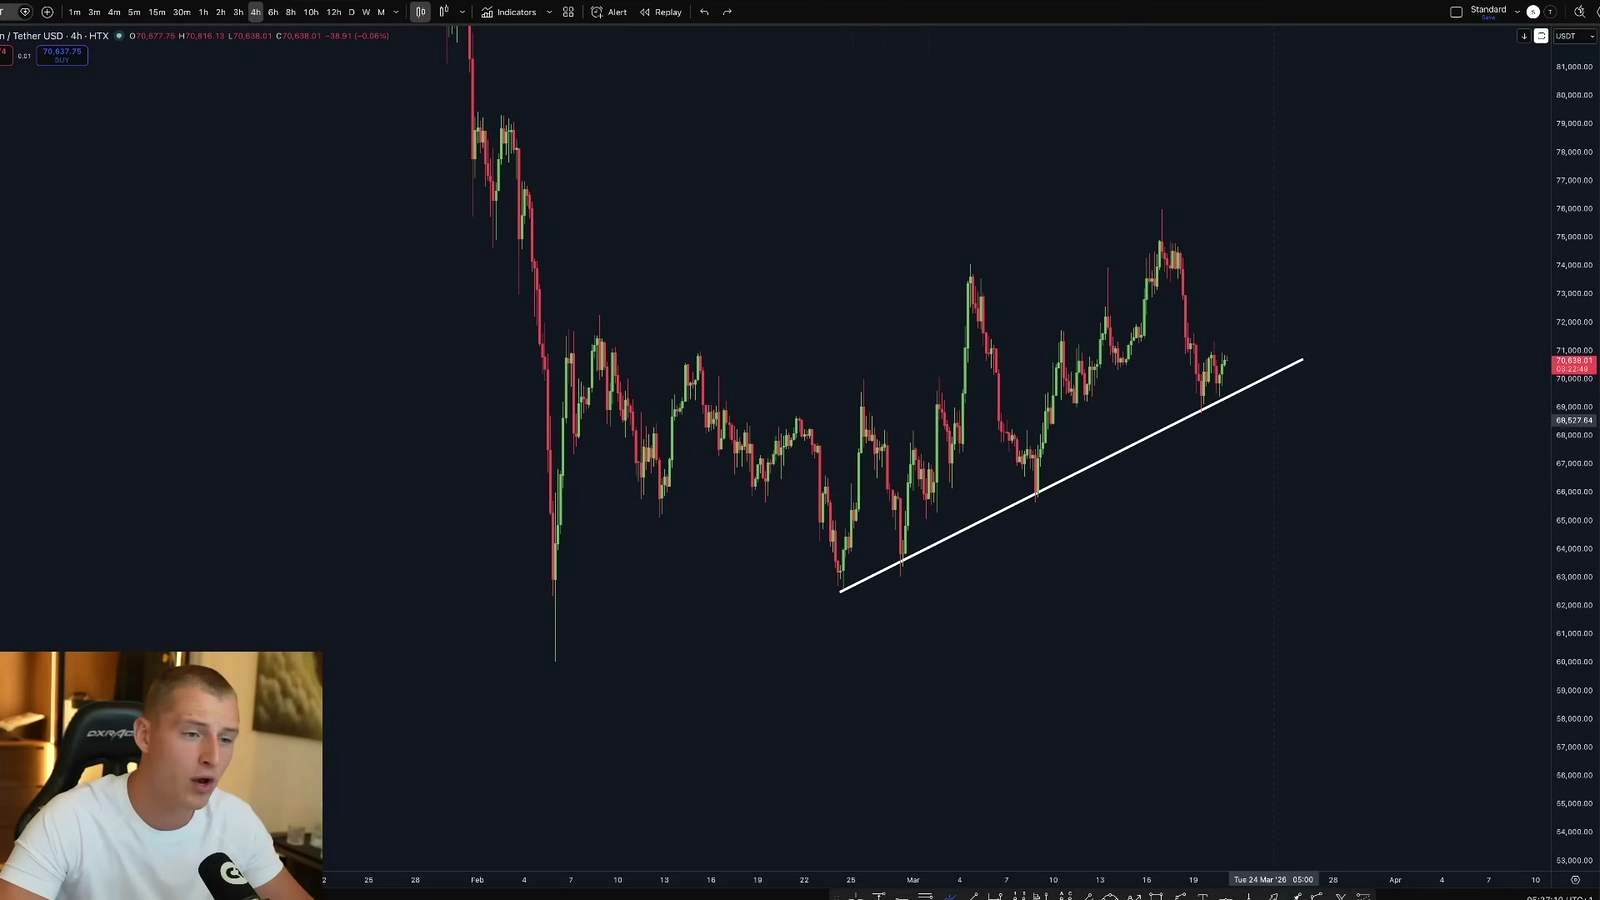
In the imminent short term, a major upward sloping support line remains one of the most important levels on the chart. As long as Bitcoin holds above it, the market is considered to be holding up relatively well. But the moment this exact level breaks, the expectation is for a continuation to the downside.
A previous breakdown from a similar support line marked the beginning of a larger move lower. Because of that, this current support line is described as crucial to monitor closely.
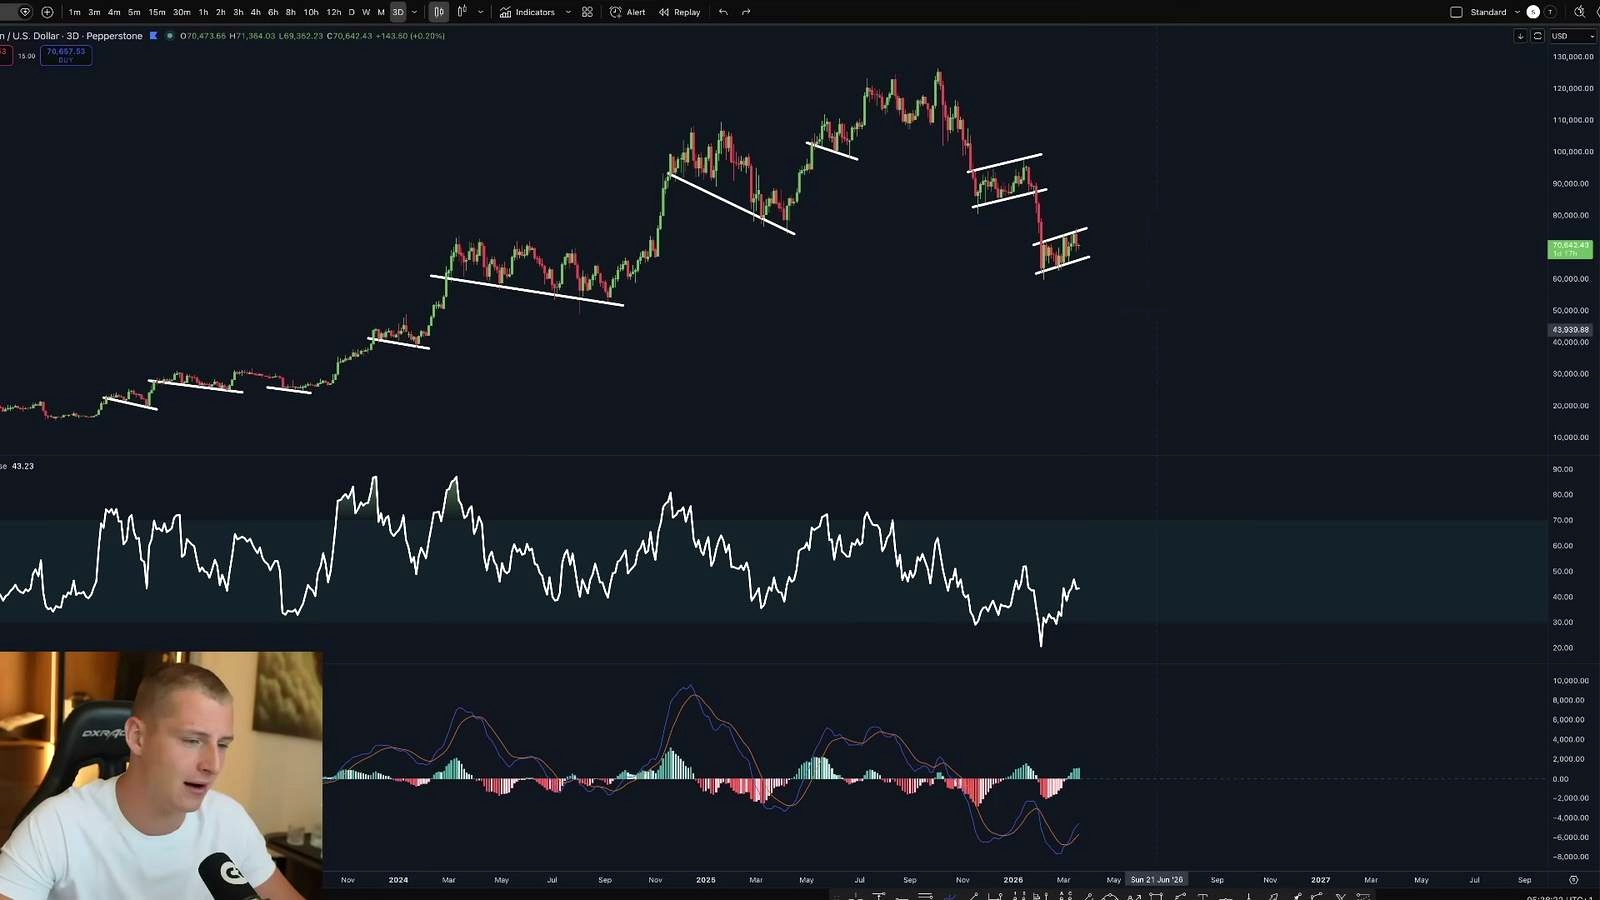
Rising Wedge and Bear Flag Structure
There is also a developing top-side resistance, which can be interpreted as a rising wedge pattern. This pattern is described as a typical bearish continuation structure. At the same time, Bitcoin is still seen as forming a bear flag pattern, reinforcing the idea that a final bottom may not be in yet.
The current relief is acknowledged as meaningful, but not as the final bottom. The expectation remains that Bitcoin could still move lower before a stronger relief rally begins.
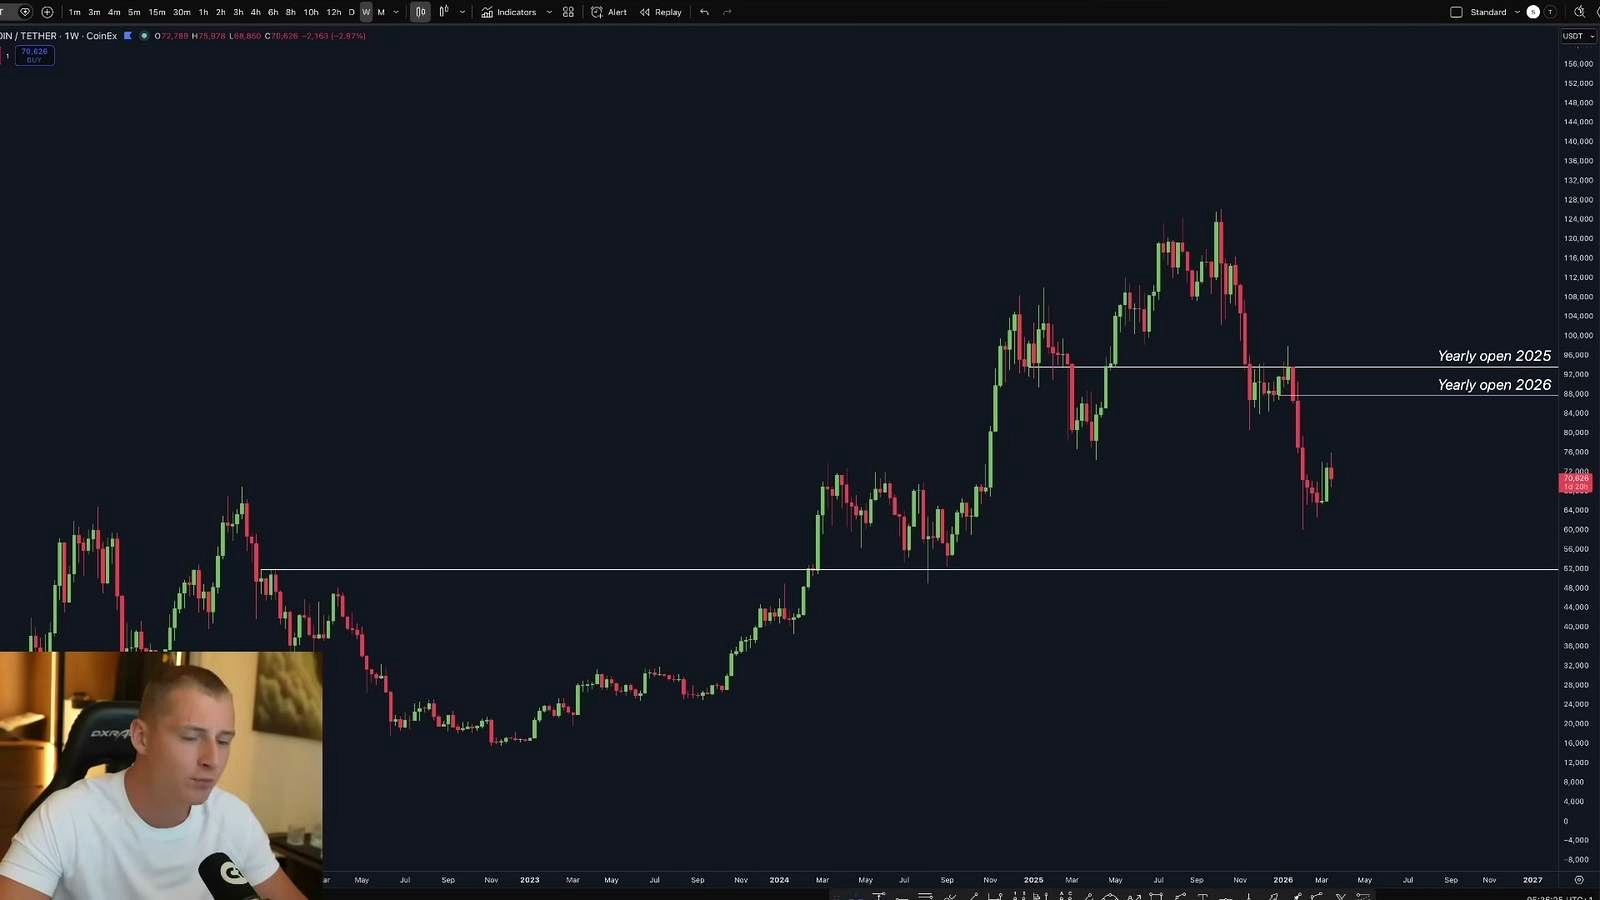
Expected Bitcoin Support Zones
The projected lower region for Bitcoin is around the $50,000 to $55,000 area, where a local bottom could potentially form. More specifically, the larger support targets highlighted are between $57,000 and $54,000, which are described as key areas of interest for accumulation.
Orders are said to be set up on the lower side at $61,000, $58,000, and $56,000. If price moves lower into those regions, top-side short orders would be canceled. If instead Bitcoin revisits higher levels first, the plan remains to look toward a short position because liquidity above is still expected to be filled at some point.
Key Price Levels Mentioned
- $61,000
- $58,000
- $56,000
- $57,000 to $54,000 as bigger support targets
- $50,000 to $55,000 as a possible local bottom region
- Approximately $67,000 as the next liquidity zone after lower liquidity is taken
Why the Bottom May Not Be In Yet
The current market structure is not viewed as a completed bottom formation. Momentum charts are part of the reason for that view, along with long trading experience observing similar setups. The argument is that Bitcoin has produced a relief bounce, but not the exact final bottom.
Funding rate conditions are also not seen as matching a larger market bottom formation. Instead, the broader setup still looks like a bearish continuation pattern, which adds weight to the expectation of more downside before a more meaningful recovery.
S&P 500 Could Add More Pressure
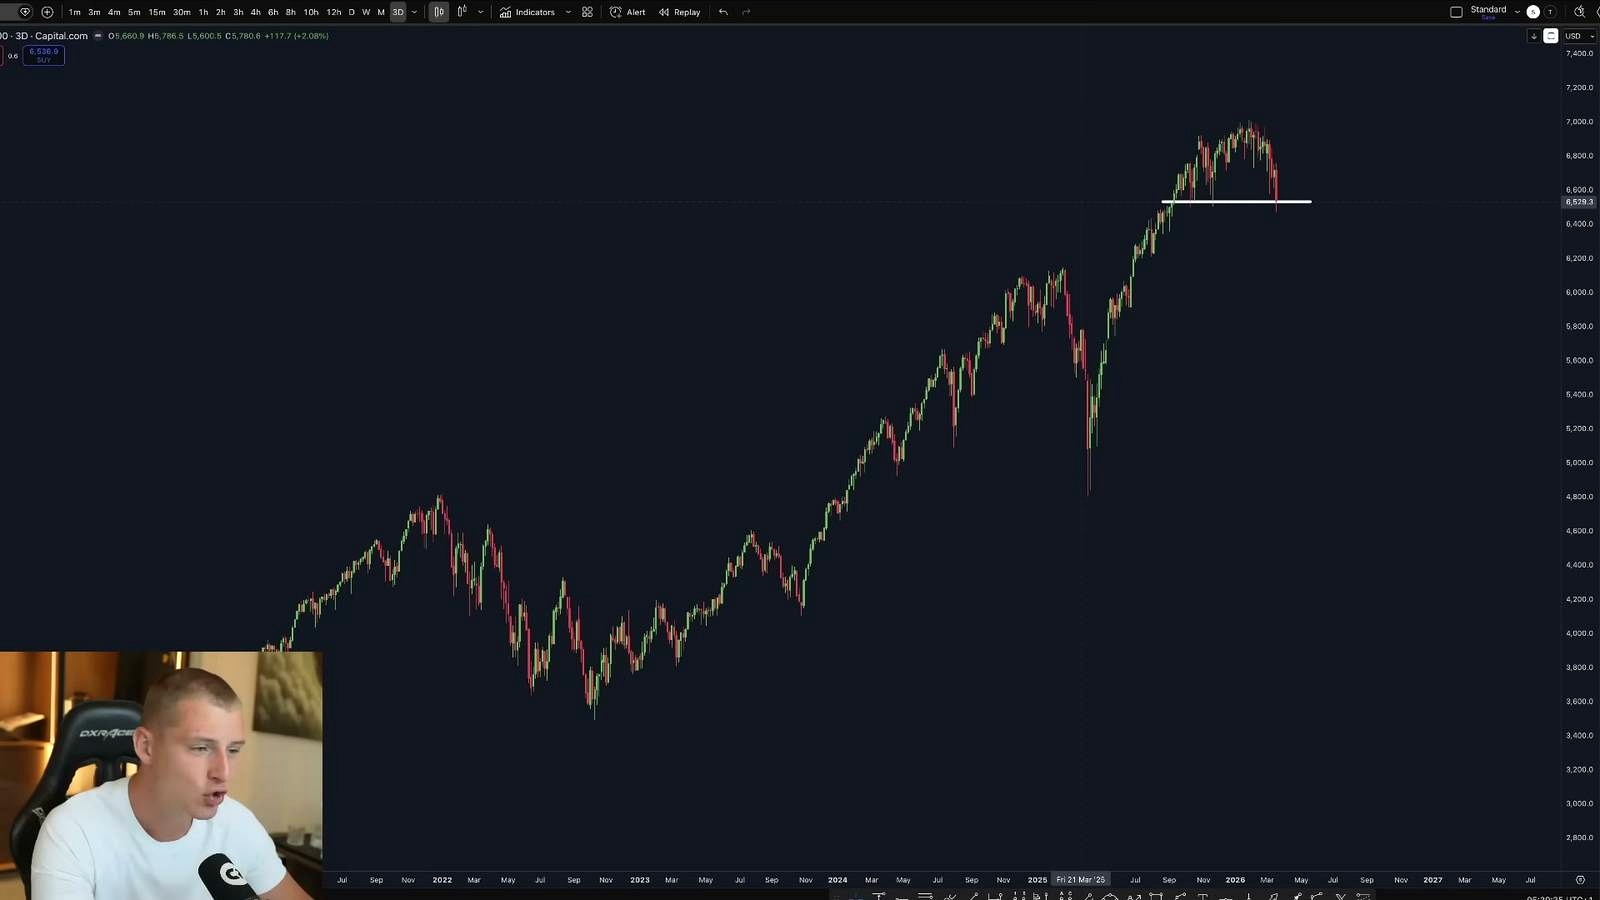
The S&P 500 is highlighted as important because Bitcoin often follows it quite closely. The current structure on the S&P 500 is described as a rounding top. If that neckline breaks, the expectation is for a rapid move lower.
If the S&P 500 does fall sharply, it could drag Bitcoin lower as well. That link between equity weakness and Bitcoin weakness is one of the reasons a further drop in Bitcoin remains part of the outlook.
Why the S&P 500 Setup Matters for Bitcoin
- Bitcoin usually follows the S&P 500 quite a lot.
- The S&P 500 is seen as forming a rounding top structure.
- A neckline break could lead to a fast move down.
- That kind of move could pressure Bitcoin further.
Bitcoin Cycle Outlook and Timing
The four-year Bitcoin cycle is still considered to be in play. It is argued that the bull market top aligned with the cycle in the same way Bitcoin has topped historically, so until this framework is invalidated, it remains the main model being followed.
Based on that view, the likely timing for a Bitcoin bottom is still expected between June and October 2026. The bottom is not considered to be found yet, and the next 50 to 100 days are presented as an important period for this process to continue developing.
Cycle-Based Outlook
- The four-year cycle is still viewed as active.
- The previous top is seen as having followed the cycle closely.
- The current bottom is not believed to be in yet.
- A bottom is expected between June and October 2026 unless the framework is invalidated.
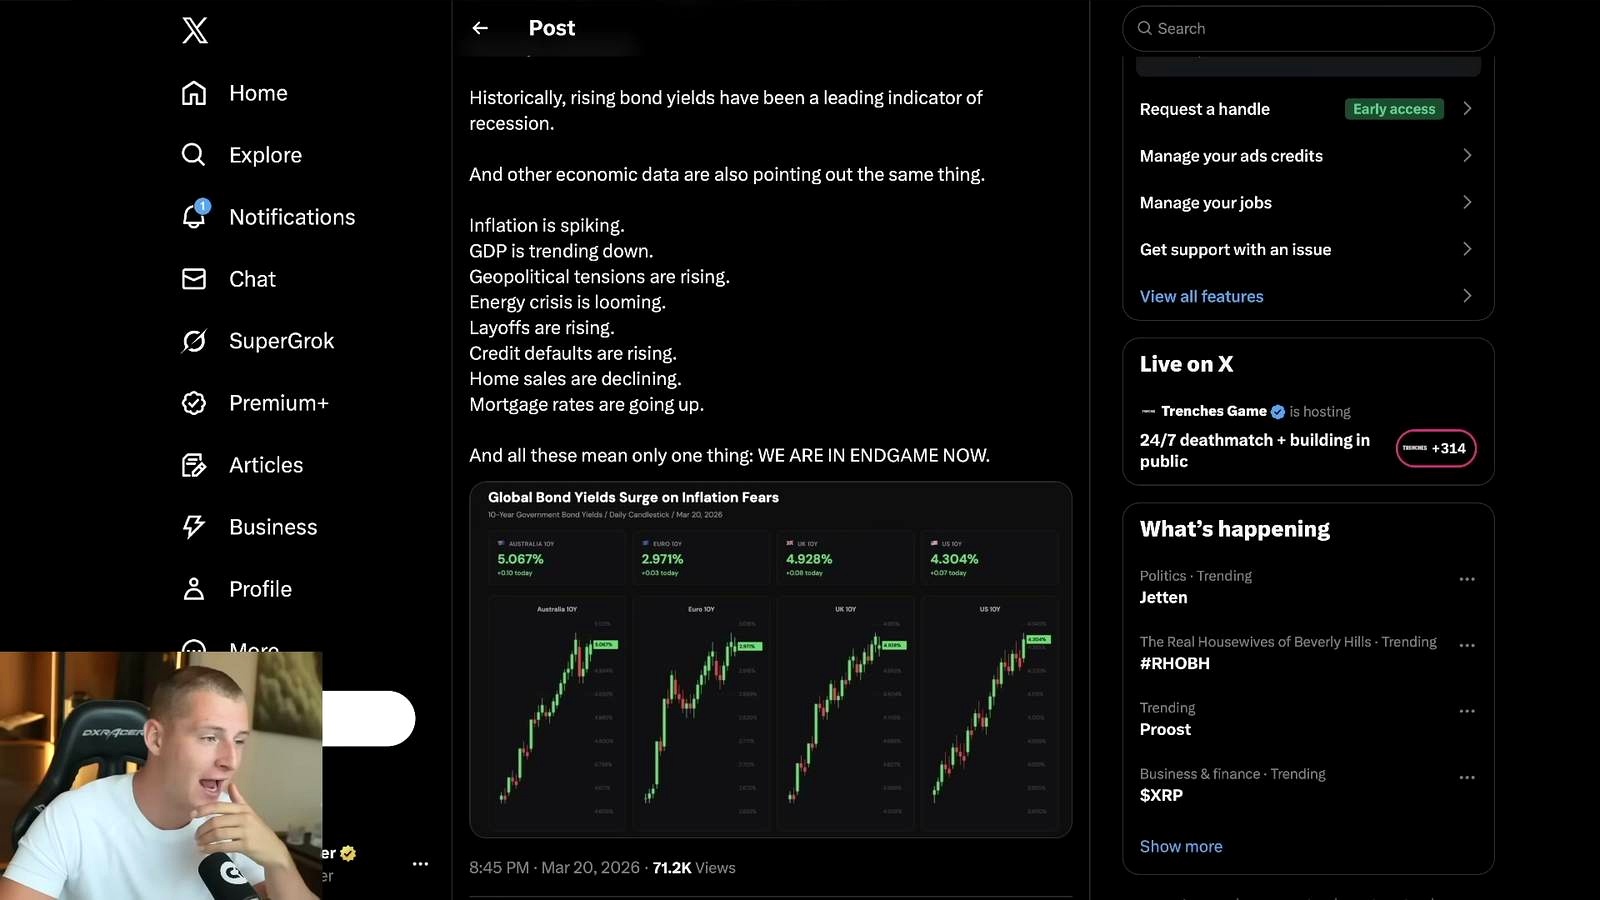
Rising 10-Year Yields and Recession Risk
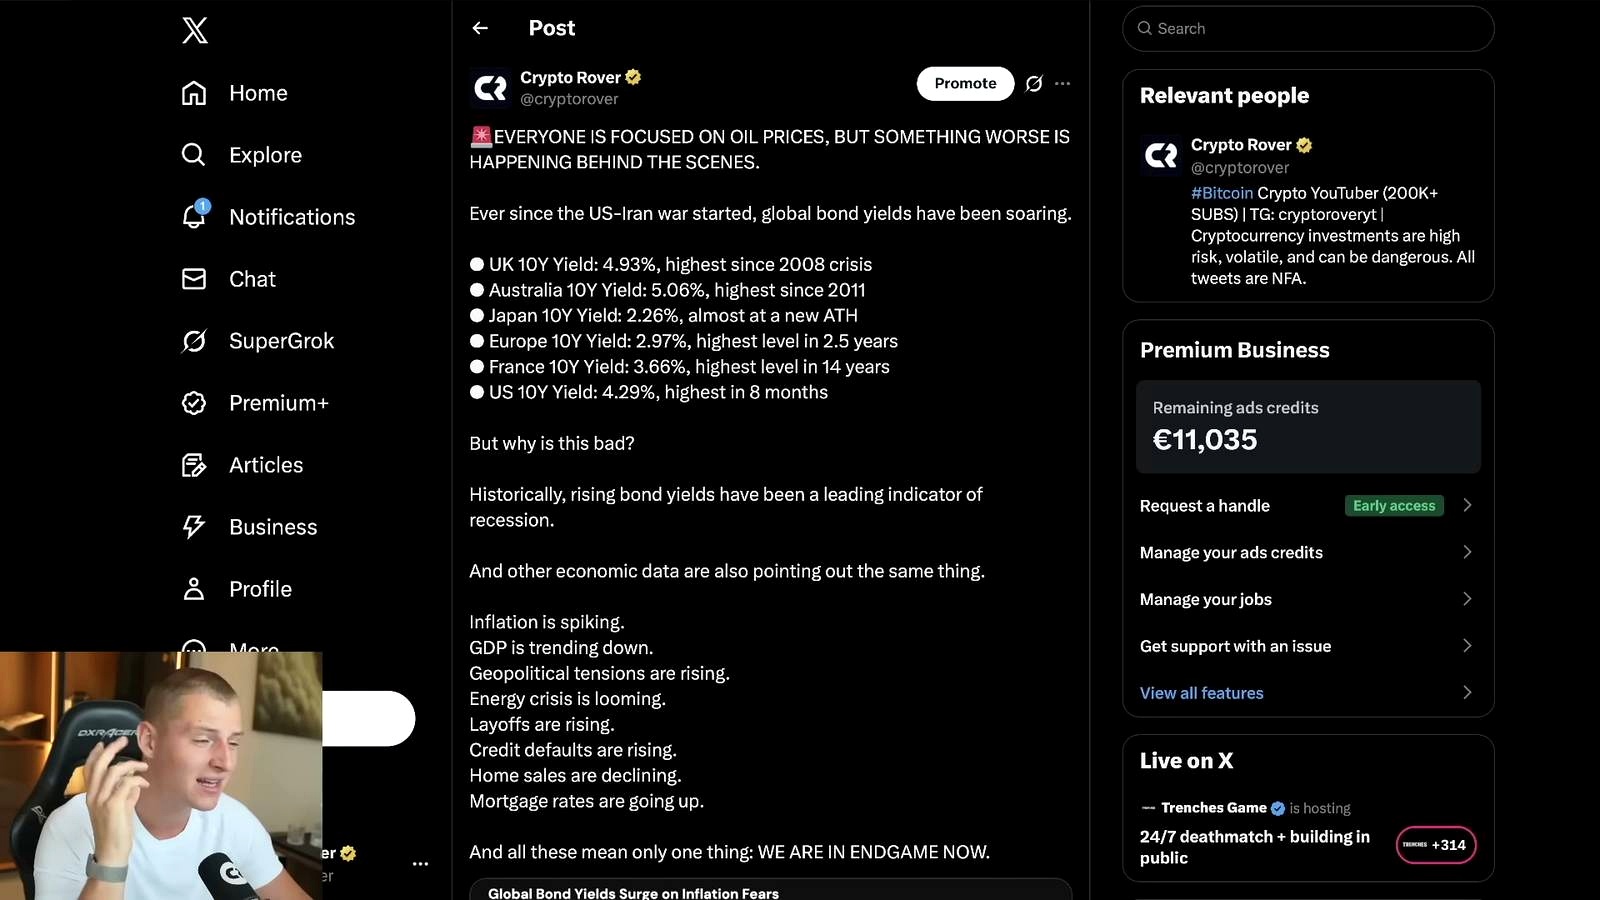
Another major warning sign comes from 10-year yields, which are rising across the UK, Australia, Japan, Europe, France, and the US. These yields are moving close to new highs, and this is described as a very bad sign for markets.
Historically, when the 10-year yield rises this aggressively, it is viewed as a leading indicator for recession. That makes the broader macro environment increasingly dangerous, especially for risk assets.
Economic Warning Signs Mentioned
- 10-year yields are rising across major regions.
- Inflation is looking ready to spike again after oil prices surged.
- GDP is clearly trending down in the US and Europe.
- Geopolitics is described as extremely bad.
- An energy crisis is seen on the horizon.
- Layoffs are rising, especially in the US.
- Credit defaults are rising.
- Home sales are declining.
- Mortgage rates are going up due to rising yields.
All of these signals are presented as evidence that the market may be entering an end game phase where conditions could become much worse. While no one knows exactly whether Bitcoin will lead or take a large hit next year, the overall picture is described as dangerous and increasingly fragile.
Middle East Tensions and Market Risk
Tensions in the Middle East are also seen as a factor that could accelerate these risks. The view is that these tensions could speed up the timeline of broader market stress, making an already difficult environment even more unstable.
That is why the current chart setup and macro backdrop are both being treated with caution. The warning is not only technical but also economic.
Ethereum Outlook
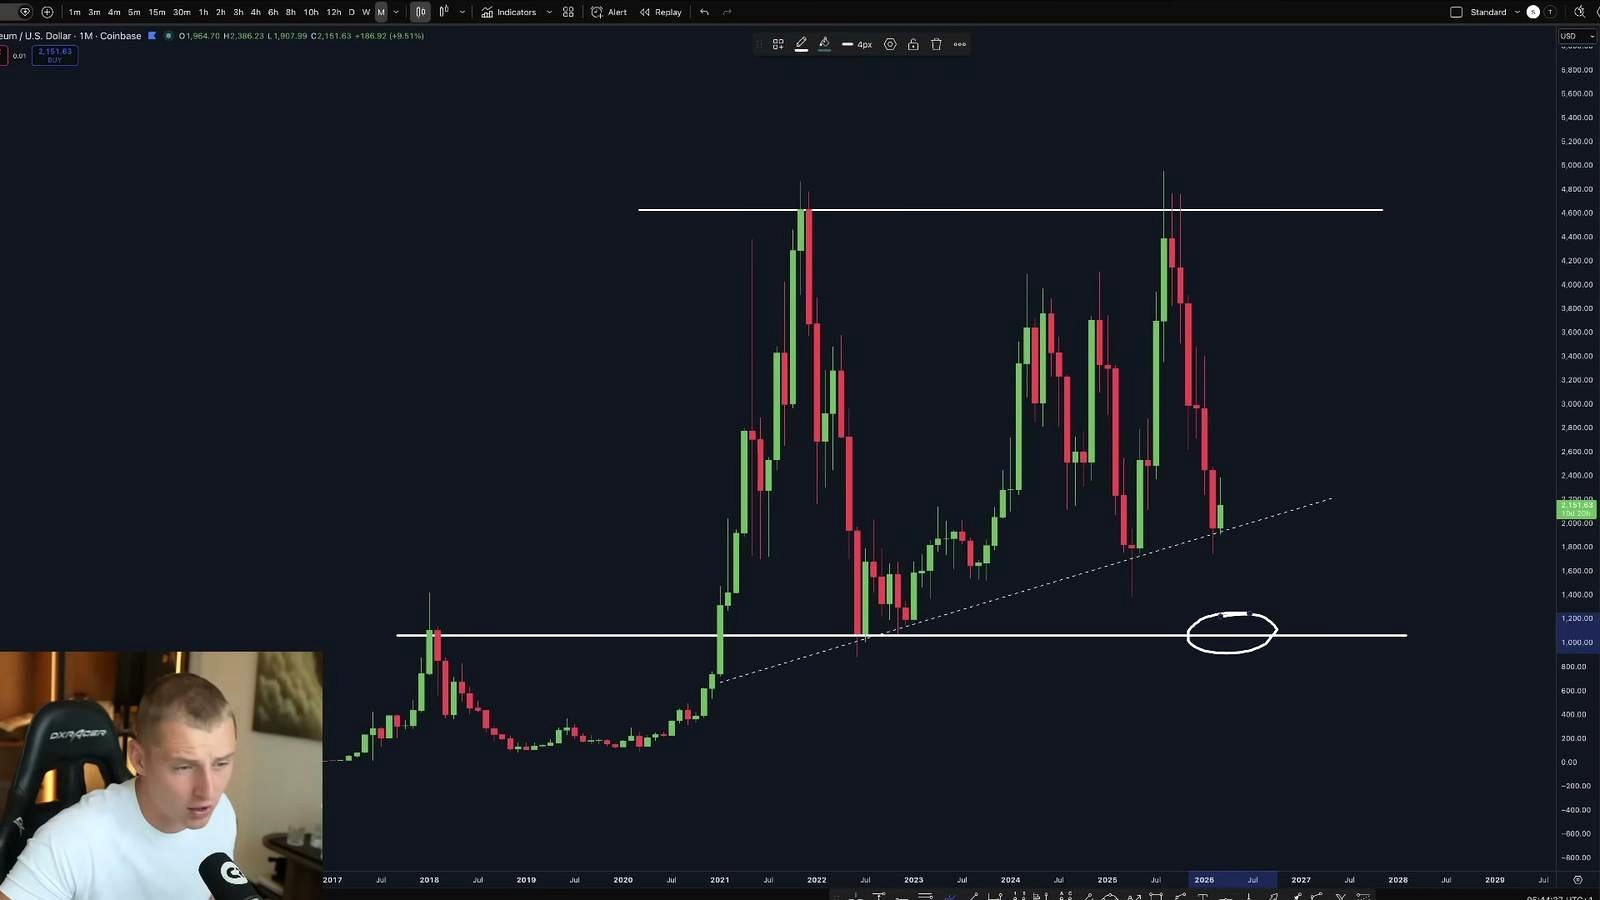
Ethereum is expected to follow Bitcoin, which is why detailed separate analysis is not emphasized. Bitcoin is treated as the leading indicator for the crypto market.
If Ethereum returns to the referenced zone, the plan is to double down on ETH. The broader direction, however, remains dependent on Bitcoin.
Trading Plans and Group Access

Current trade planning includes lower-side orders and the possibility of entering short positions if higher liquidity zones are revisited first. There is also mention of a private Telegram group where trades, scalp trades, and updates are shared by multiple traders.
The group includes not only the speaker’s trades but also trades from others, with recent profits from the last two to three days described as very strong. WEX is also mentioned as a platform where Bitcoin can be traded with a 25% fee rebate, with a possible bonus up to $10,000 available by completing tasks.
FAQ
Why is the current Bitcoin setup considered a major warning?
Bitcoin is building a large amount of liquidity below current price, and the current chart structure still looks bearish. Rising 10-year yields and broader economic weakness are adding more pressure to the overall market outlook.
What Bitcoin levels are being watched most closely?
The major upward sloping support line is crucial in the short term. Lower-side levels mentioned include $61,000, $58,000, $56,000, and the broader support zone from $57,000 to $54,000, with a possible local bottom in the $50,000 to $55,000 region.
Is the Bitcoin bottom already in?
The view presented is that the bottom is probably not in yet. The current relief is seen as a bounce, but not the final bottom.
What is the significance of the rising wedge and bear flag?
Both are treated as bearish continuation patterns. Together, they support the idea that Bitcoin may still move lower before forming a stronger relief rally.
Why does the S&P 500 matter for Bitcoin?
Bitcoin is said to follow the S&P 500 quite a lot. If the S&P 500 breaks down from its rounding top structure, that could lead to a sharper move lower in Bitcoin as well.
What is the concern with 10-year yields?
10-year yields are rising across several major economies and are nearing new highs. This is described as a leading indicator for recession and a negative sign for the market.
When is a Bitcoin bottom expected based on the cycle view?
Based on the four-year cycle outlook, a bottom is expected between June and October 2026, unless that framework is invalidated.
What is the Ethereum outlook?
Ethereum is expected to follow Bitcoin. If it returns to the referenced zone, the plan is to double down on ETH.
Video Source

An Indian crypto journalist covering the developments in the Bitcoin and blockchain industries. Her work helps readers understand key changes in the world of digital assets.


