Something has shifted, even if the market still looks frozen on the surface. Fear is everywhere, Bitcoin has been trapped below $75,000 for 27 days, and yet the case for buying is suddenly getting louder, not quieter.
That tension is the whole story. While most people have given up, a string of overlooked developments is building a very different picture for Bitcoin heading into the next phase.
Bitcoin Is Stuck, but the Pressure Is Building
Bitcoin has remained below $75,000 for 27 days. Oil is hovering around $100, the Fed appears paralyzed, and the fear and greed index sits at 26. That combination has pushed many traders into a defensive mindset.
But the argument here is not that nothing is happening. It is that a lot is happening underneath the surface, and the market may be missing it.
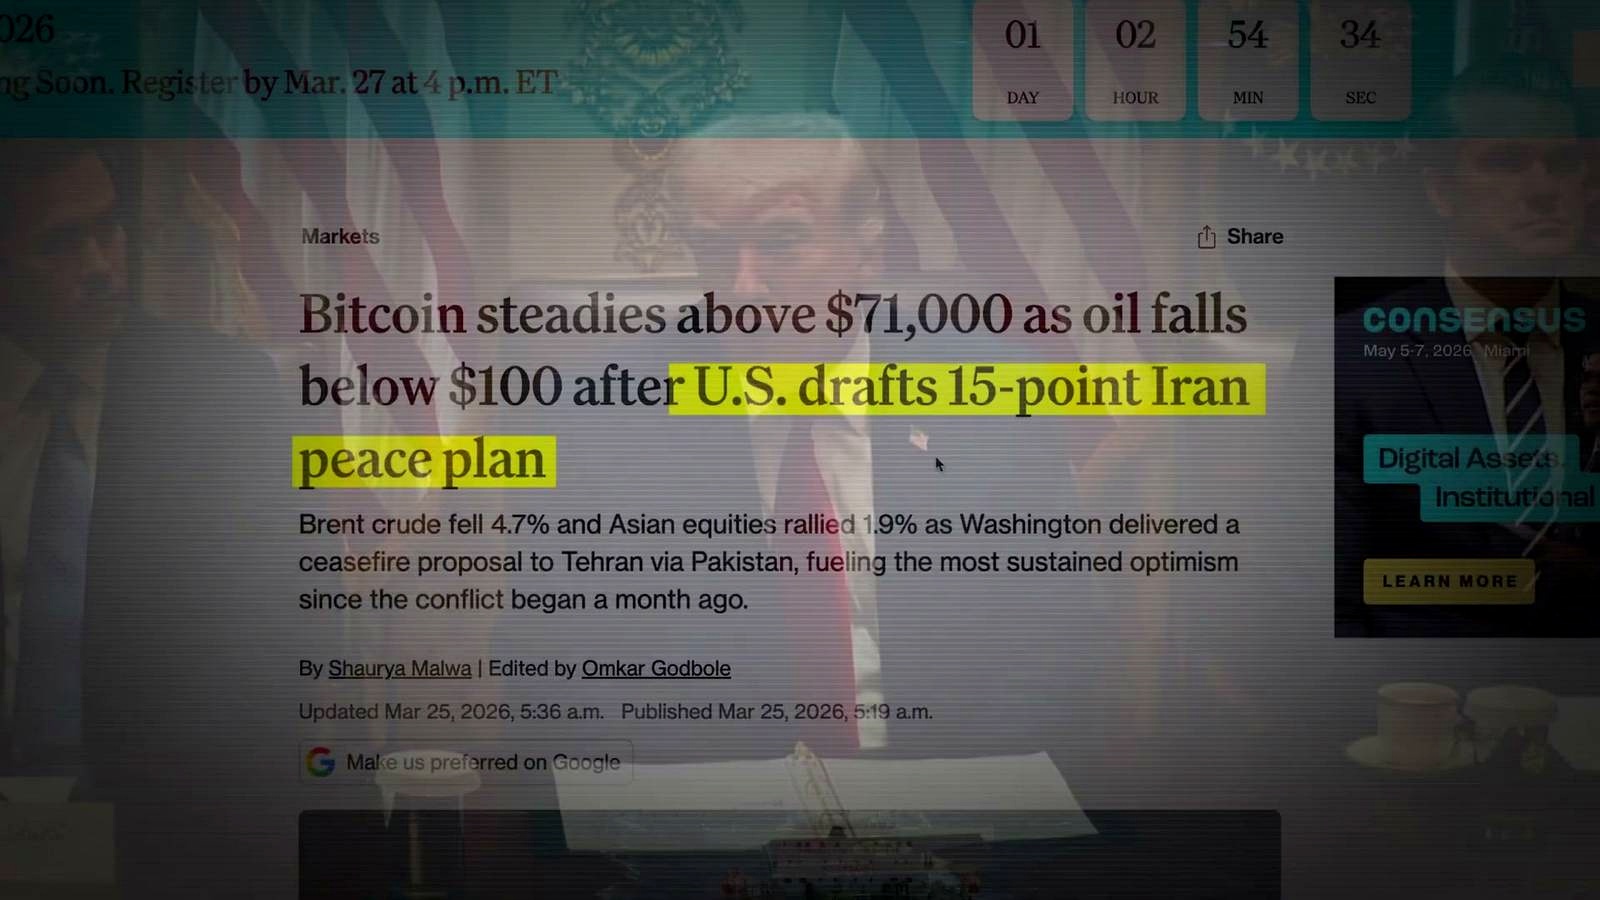
The peace plan that changed the mood
One of the biggest developments in the last 24 hours was the report that the US drafted a 15-point Iran peace plan. That implies active negotiations, and it came alongside reports that Trump was postponing Iran strikes.
The result was immediate market chaos:
- More than $415 million in liquidations
- $280 million in short liquidations
- $136 million in long liquidations within a 4-hour window
Shortly after, Iran denied that communication was taking place. That denial only added more confusion. It also fueled accusations that Trump was trying to move markets through public comments.
Still, the core idea remains the same: if negotiations are real and a ceasefire arrives, Bitcoin may react hard.
What Happened the Last Time a Ceasefire Appeared

The bullish case leans heavily on one historical example. The last time a ceasefire was introduced between the US and Iran, Bitcoin rallied 26.7% shortly after.
That move stands out even more because Bitcoin was already trading near $100,000 at the time. Despite that elevated level, the ceasefire still helped trigger nearly a 30% jump.
Why this time could be even stronger
The current setup is presented as more explosive for a few reasons:
- Bitcoin exchange reserves are now at an all-time low
- Even a small bullish catalyst could move price aggressively
- The war has escalated dramatically since June 2025
The logic is simple: if a ceasefire had that kind of effect before, a more serious conflict ending in a tighter supply environment could hit much harder.
Oil May Be the Hidden Trigger
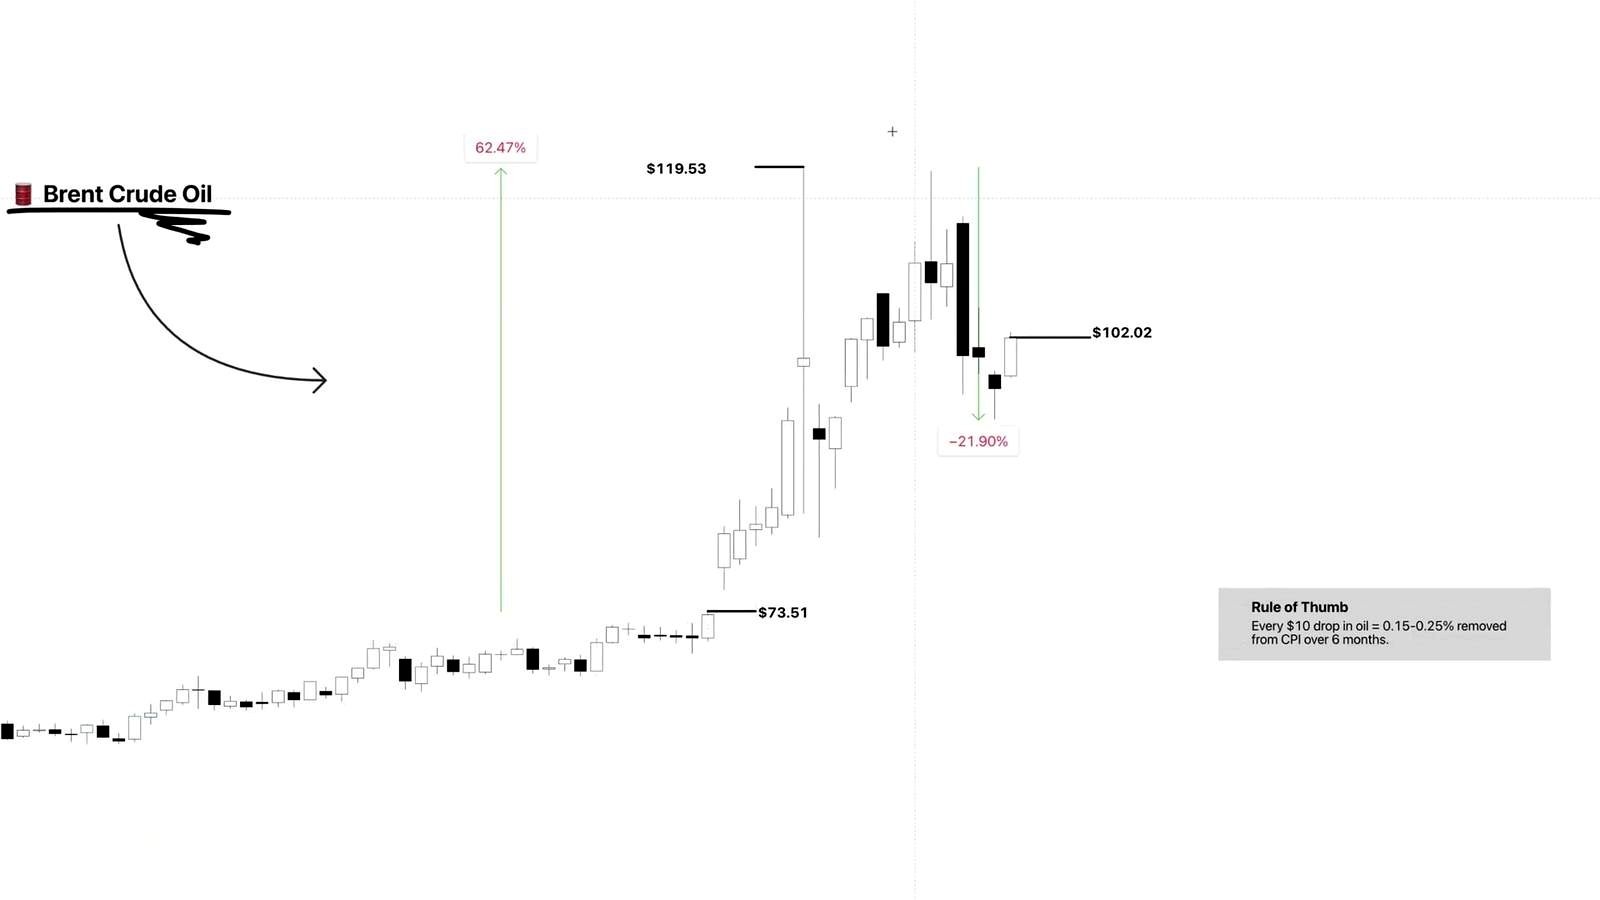
Crude oil is a major part of this thesis. Before the strikes, oil was trading around $73 per barrel. It then surged and peaked at $120, and now sits near $102.
What matters here is not just the rise, but the weakness that has already appeared. Oil saw a 2-day crash of 32%, followed by another 3-day drop of nearly 22% just days later.
Why weaker oil matters for Bitcoin
The view is that this does not look like oil-induced stagflation. Instead, oil has already shown unusual weakness in a short amount of time.
The rule of thumb used here is clear:
- Every $10 drop in oil can remove 15% to 25% from CPI over 6 months
If a ceasefire pushes oil back toward the pre-strike area around $73, the inflation narrative that has frozen the Fed could disappear fast. That would change the entire market conversation.
The Fed Is Hawkish, but One Date Stands Out
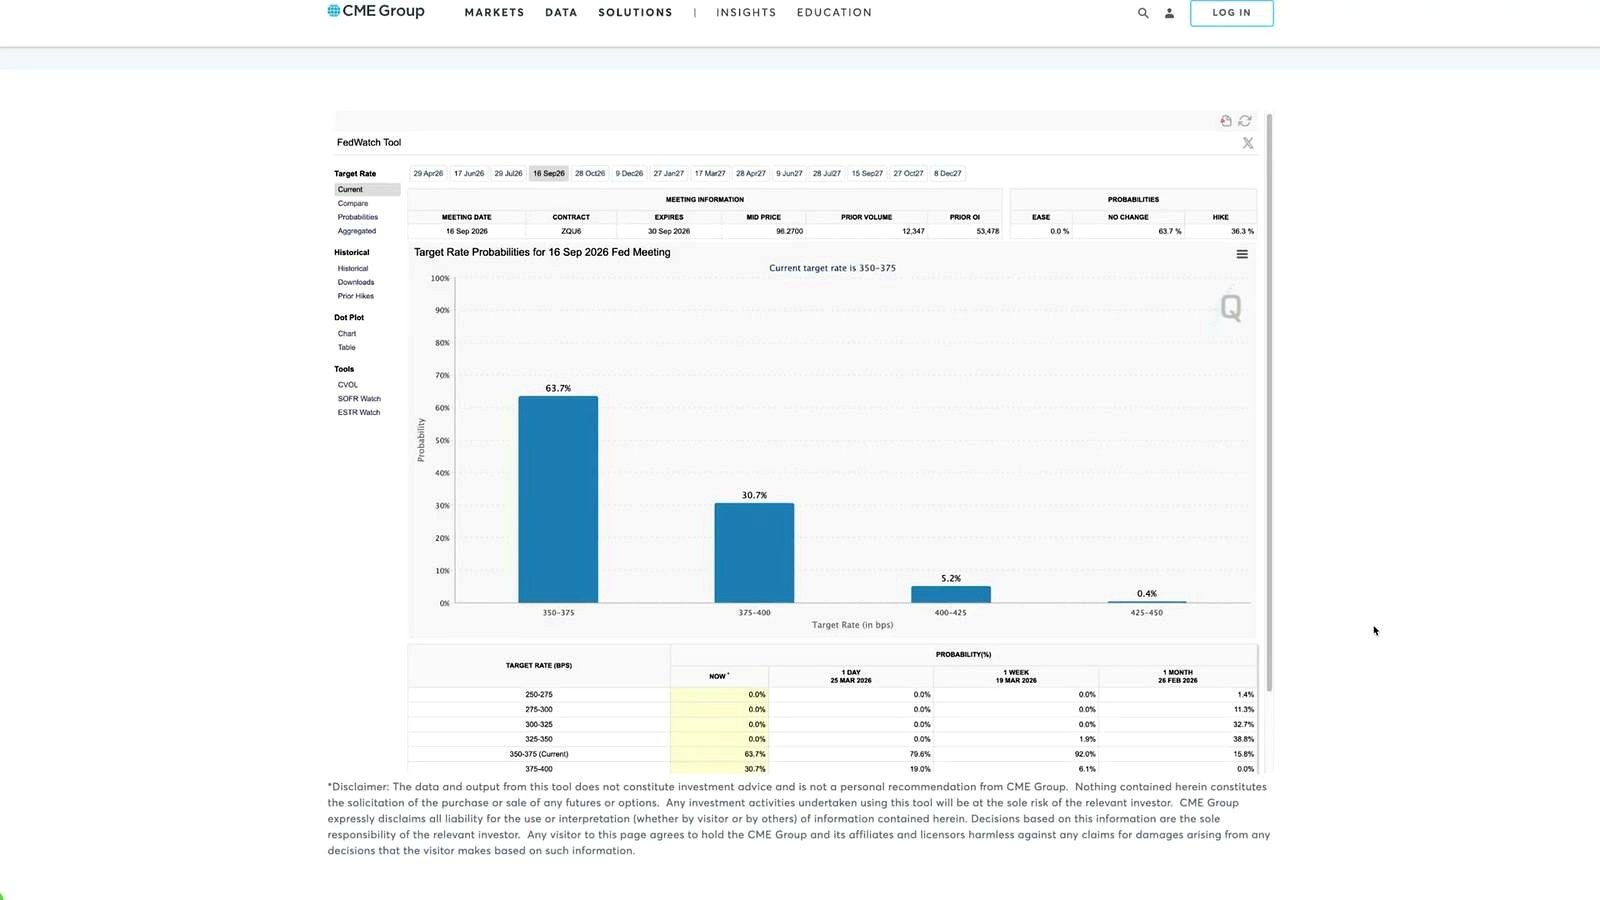
Right now, the market is positioned in its most hawkish way in three years. April carries little expectation for a rate cut, and the possibility of a rate hike has become more visible.
But the article’s focus is on one event: the PCE reading on April 9.
Why April 9 could shock the market
If that PCE print comes in softer than expected, the rate cut narrative could return quickly. And if that happens, Bitcoin could start pricing in higher liquidity expectations almost immediately.
That is why the current pause matters. The market may not yet have the data needed for a breakout, but the setup could change very fast.
The “Final Trap” Scenario Before a Bigger Move
This is not a straight-up bullish call with no downside risk. In fact, the argument openly allows for one more painful drop first.
There are large order clusters sitting below current price:
- $65,000
- $60,000
- $55,000
The expectation is that Bitcoin could make a fast move toward $75,000, then crash toward $60,000 or even $55,000 before turning sharply higher. That is the “final trap” idea.
Why that downside could actually strengthen the setup
The best-case scenario in this framework is that Bitcoin runs those downside orders, clears the liquidity, forms a final bottom, and then opens up immense room to the upside.
That potential bottom lines up with several signals mentioned in the material:
- The 200-week moving average near 59,262
- The MVRV Z-score approaching historical bottom conditions
- A weekly RSI pattern that has often appeared near Bitcoin bottoms
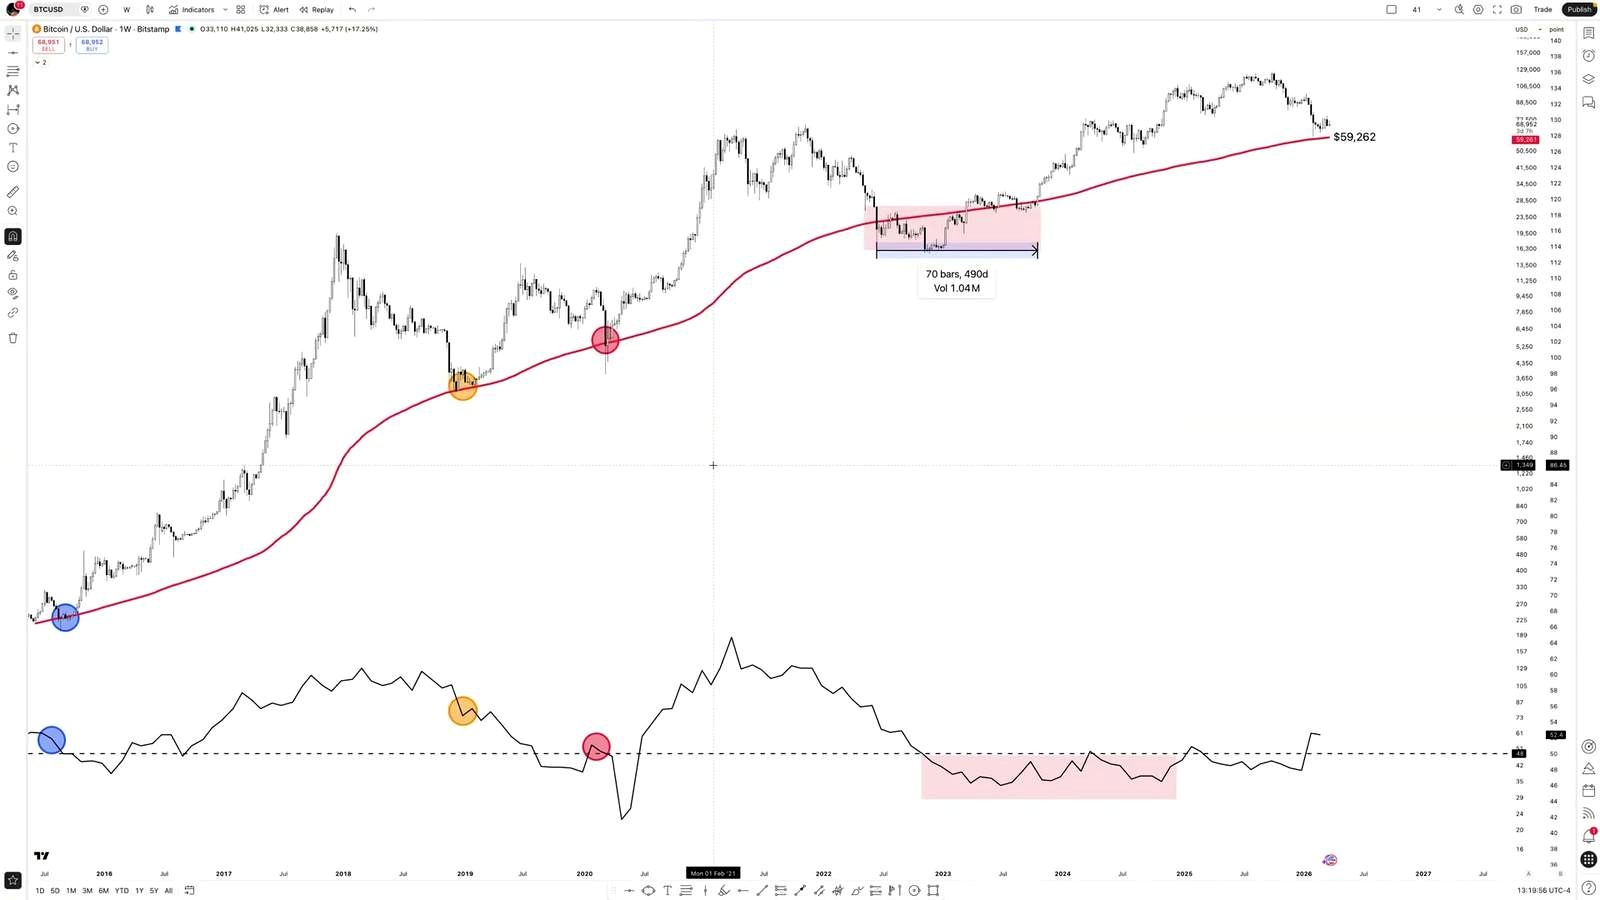
The 200-Week Moving Average Is Back in Focus
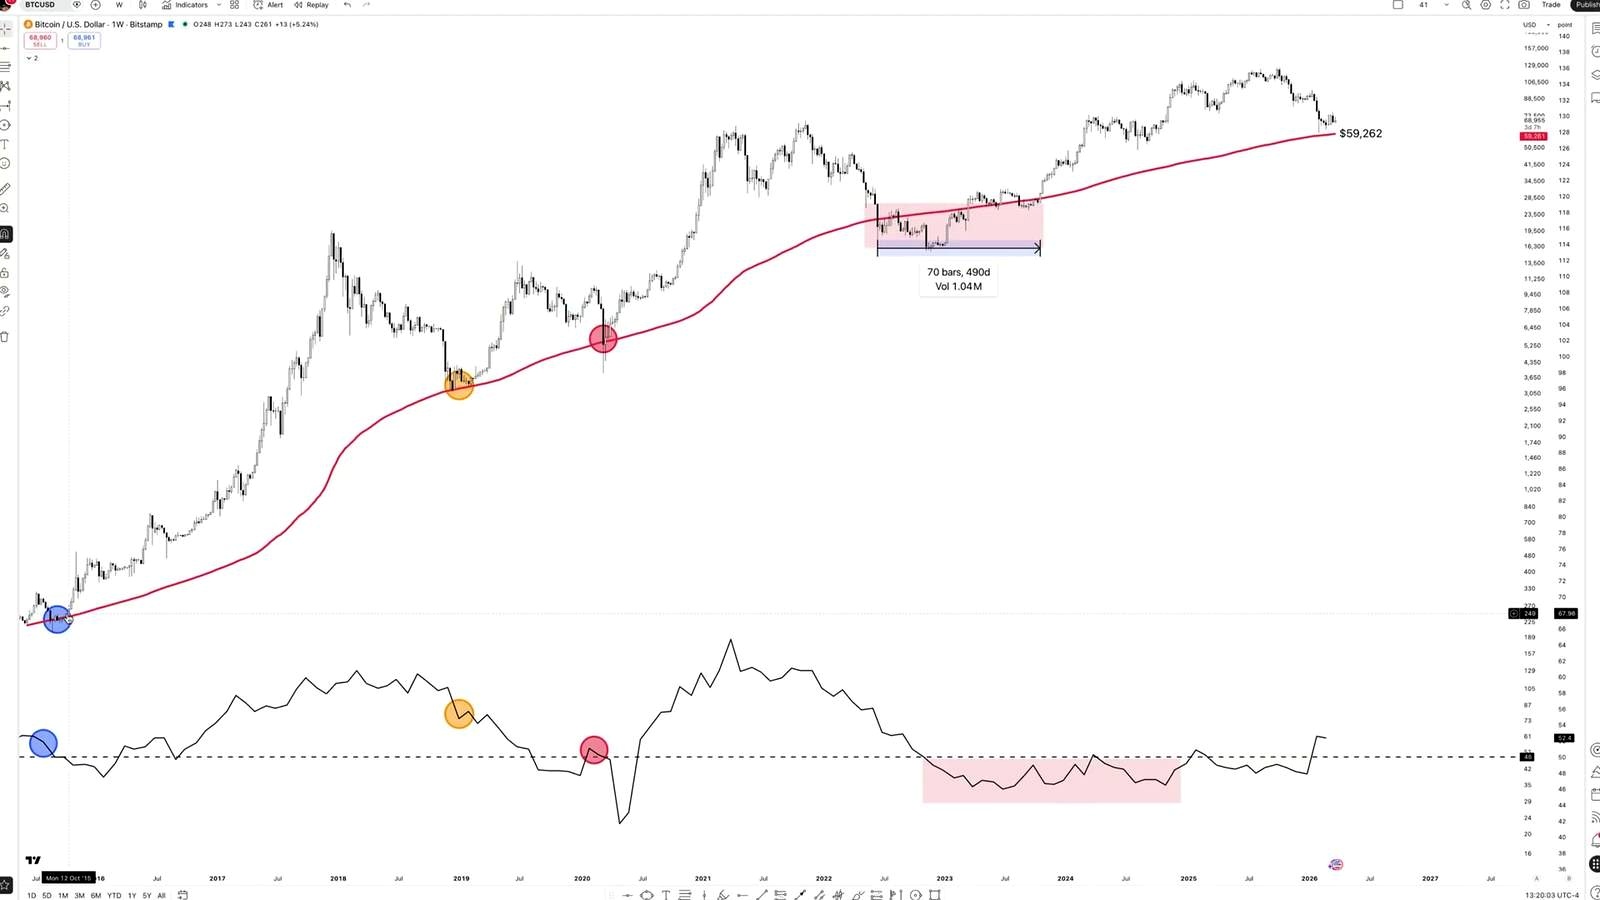
Historically, every major Bitcoin bottom has formed near the 200-week moving average. The examples cited include 2015, 2018, 2020, and 2023.
Right now, that level sits around 59,262.
Why this may not be another long grind lower
Some traders worry Bitcoin could repeat the 2023 pattern, when it spent 490 days below the moving average. But the key difference highlighted here is the ISM PMI backdrop.
According to the argument, every time Bitcoin hit the 200-week moving average, the ISM PMI was either already expanding or close to doing so. In 2023, the delay came because PMI struggled to break out.
Now, that is described as less of a problem because expansion is already underway. That makes a fast retest-and-rally scenario look more plausible than a long period of weakness.
May Could Be the Real Inflection Point
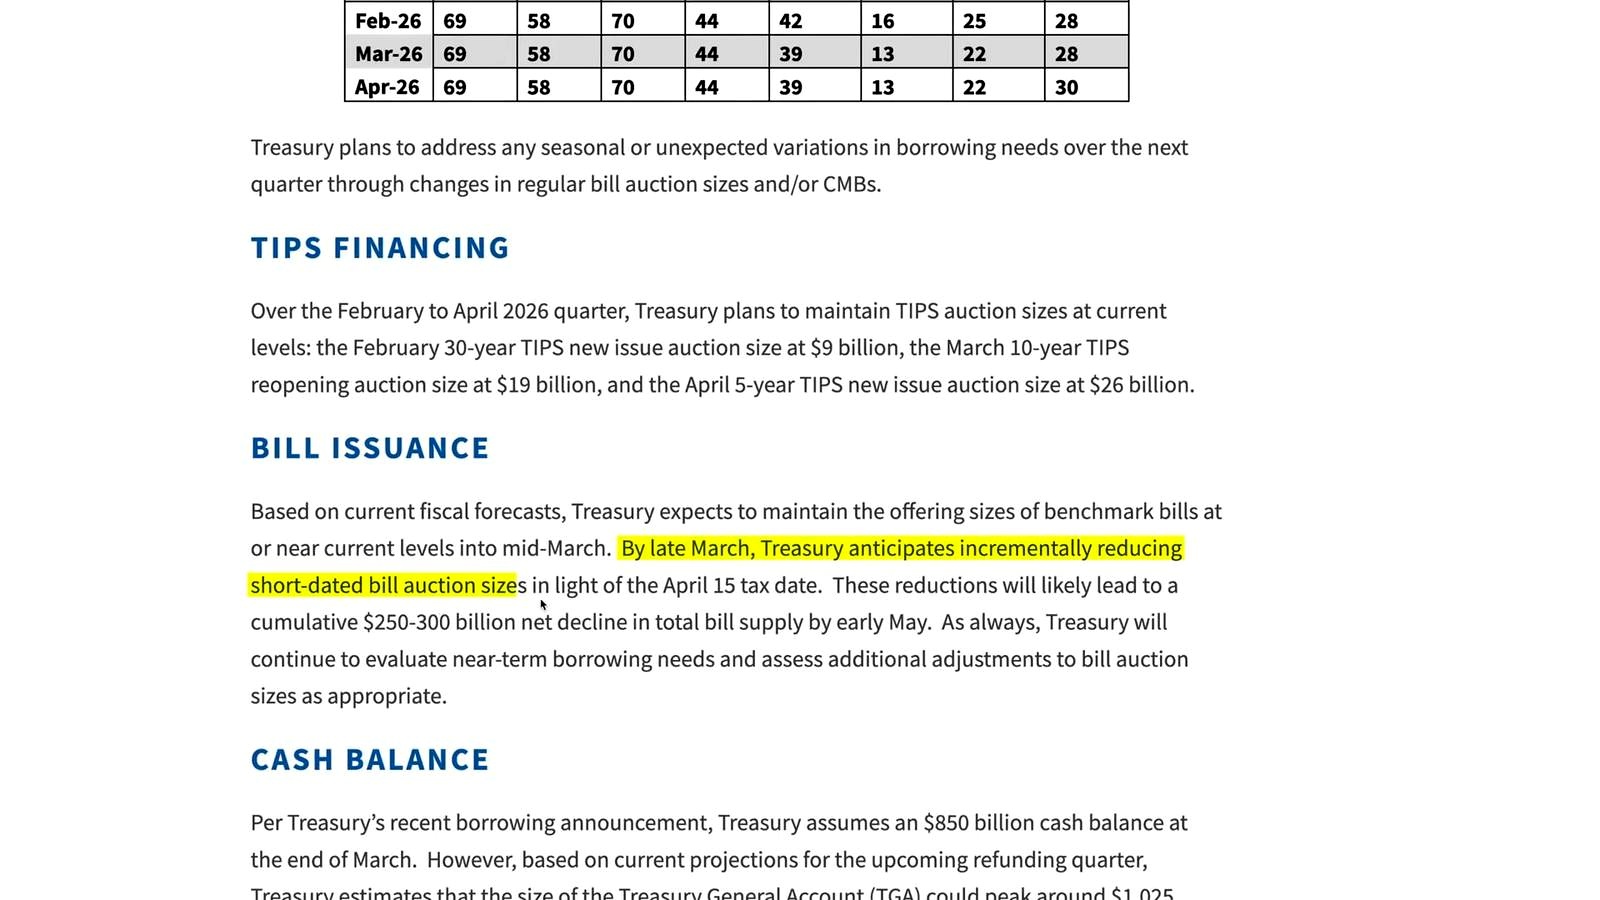
The article points to May as a possible sweet spot for Bitcoin this year. The reason is liquidity.
By late March, Treasury is expected to reduce short-dated bill auction sizes ahead of the April 15 tax date. Those reductions are projected to lead to a cumulative $250 billion to $300 billion net decline in total bill supply by early May.
Why that matters so much
The interpretation is aggressive: that is $250 billion to $300 billion entering markets by May.
At the same time, the war with Iran is said to be costing the US $1 billion per day, with total costs since April 20, 2024 approaching $60 billion. Combined with existing debt and Treasury spending, the conclusion is that the Treasury General Account could get drained.
If that happens, the argument is that more capital is pushed back into financial markets.
Put together, the setup looks like this:
- $250 billion to $300 billion entering markets by early May
- A likely TGA drain pushing more liquidity into markets
- Potentially lower inflation pressure if war-related oil spikes fade
That combination is described as a nearly ideal Bitcoin setup.
Global Liquidity Is Rising, but Bitcoin Has Not Caught Up Yet
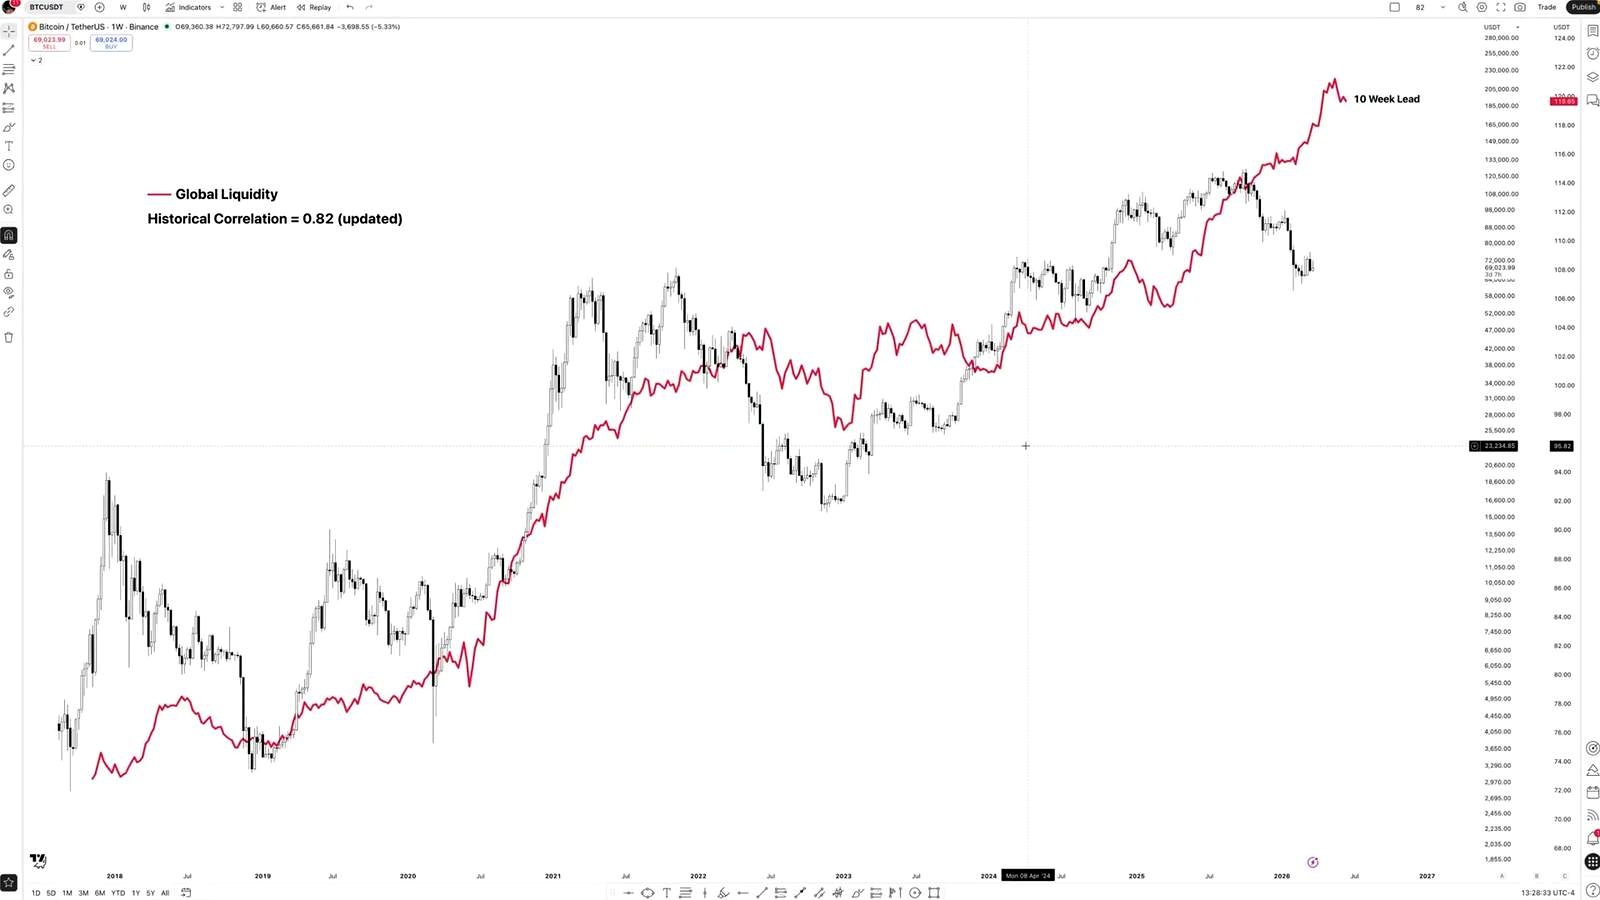
Bitcoin and global liquidity are said to have a historical correlation of 82%. Right now, though, the relationship looks broken. Global liquidity is rising while Bitcoin is falling.
The explanation offered is that Bitcoin tends to follow with a 10-week lag.
Where the money is going instead
The current winner has been energy stocks. Since the Iran war began, the material highlights strong outperformance:
- Energy stocks up 12.4%
- Shell up nearly 15%
- Chevron up nearly 14%
- Exxon up 13.2%
That helps explain why liquidity has not flowed into Bitcoin yet. Capital has been chasing what is working.
But if oil starts dropping, energy stocks may lose that appeal. That is where the thesis turns: capital could then rotate, and Bitcoin could finally absorb the liquidity already building in the system.
Why the Breakout May Still Need One More Catalyst
Despite the bullish structure, the article does not claim the breakout is here already. It argues the market still needs a reason to move.
The most important near-term triggers mentioned are:
- A ceasefire
- ISM manufacturing PMI in early April
- PCE data on April 9
Until then, Bitcoin may remain in consolidation. But the point is that the ingredients are stacking up, and once the trigger arrives, the reaction may be much larger than most expect.
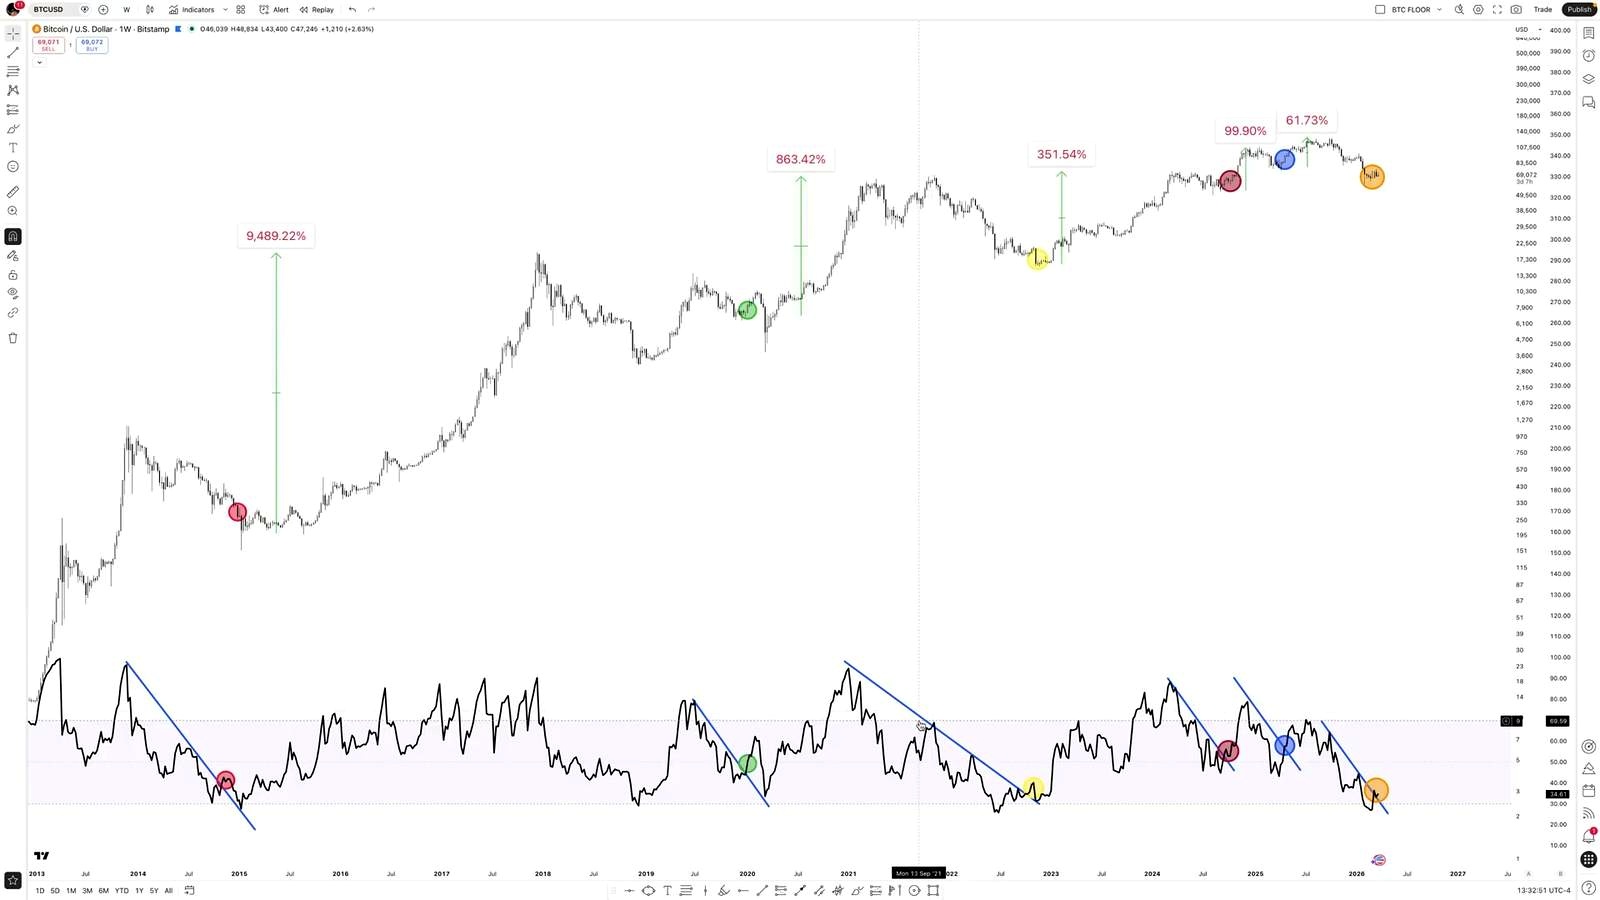
Technical Signals Are Adding to the Tension
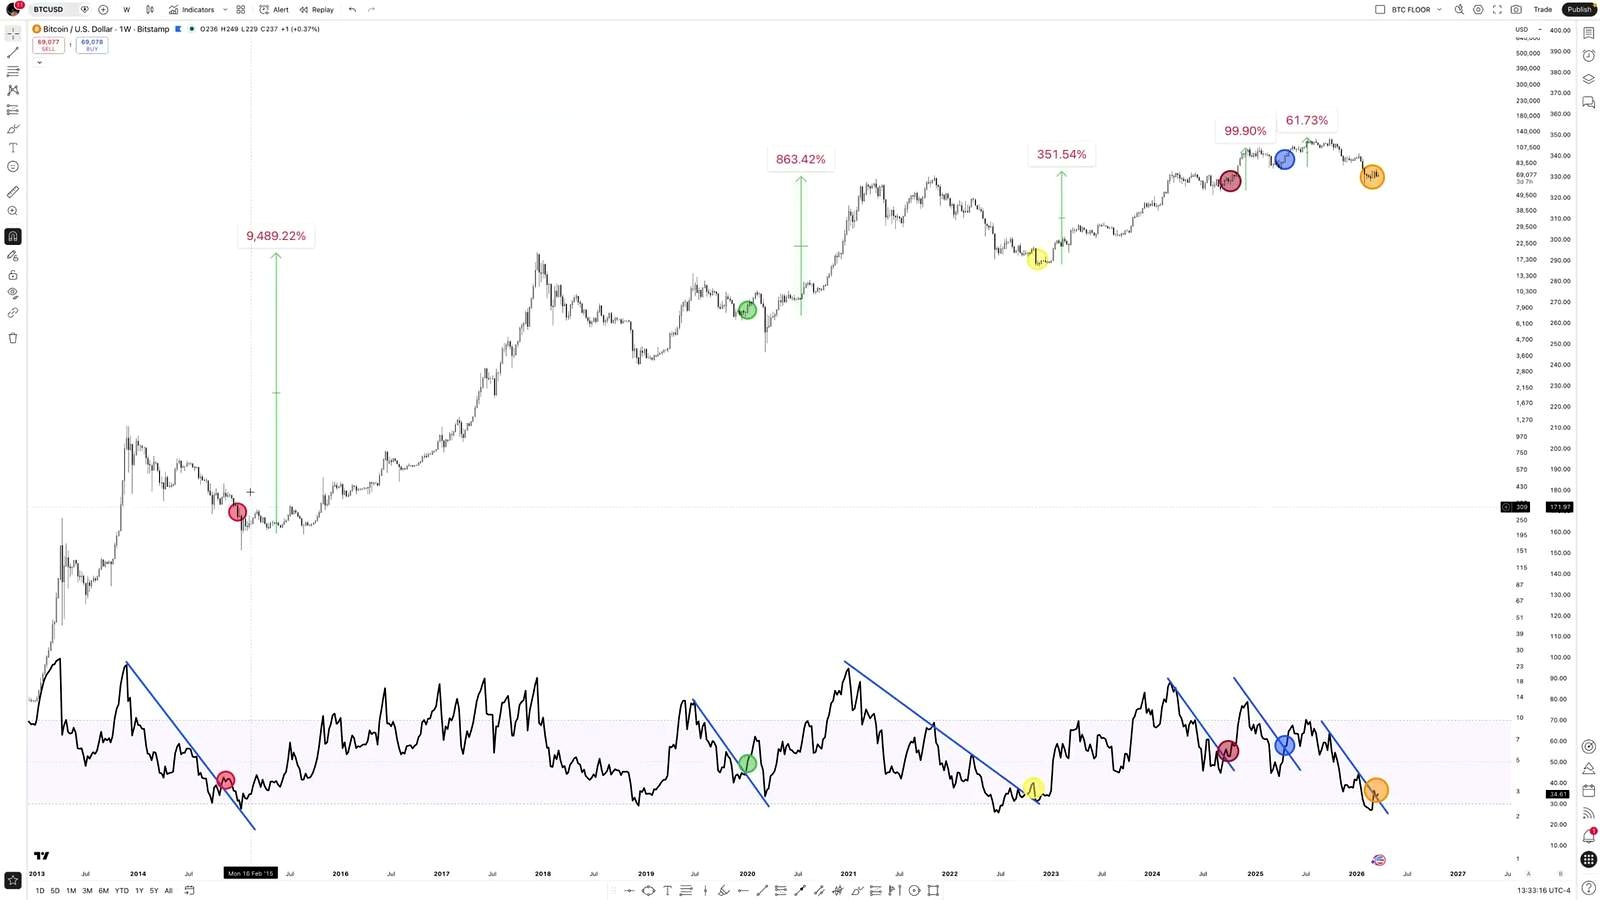
The weekly RSI pattern is another major part of the case. Every time Bitcoin has broken through a similar RSI trend line, it has tended to mark or come very close to a bottom.
The same pattern is now appearing again.
Support levels traders are watching
Several technical and structural factors are lining up at once:
- Weekly RSI at historically important levels
- MVRV Z-score near historical bottom territory
- 200-week moving average around 59,262
- Cost of production acting as a support area
- Retest of a multi-year support level
The cost of production is especially important in this view. Throughout history, Bitcoin has often rallied strongly after hitting that level. The one exception cited was 2018, when price dipped slightly below before rallying 345%.
Why Some Investors See a Rare Opportunity
The article’s broader message is emotional as much as analytical: this may be one of those periods that looks ugly in real time but obvious in hindsight.
Fear is elevated. Oil has distorted the inflation story. The Fed looks stuck. Bitcoin is trapped below resistance. And yet under that mess, a ceasefire, lower oil, softer inflation, rising liquidity, low exchange reserves, and historical bottom signals are all starting to point in the same direction.
That does not remove risk. It simply explains why some traders are buying before the market feels comfortable again.
FAQ
Why is Bitcoin below $75,000 getting so much attention?
Because Bitcoin has been stuck below that level for 27 days, while fear remains high and many traders have already given up. That kind of stalled price action can make any new catalyst matter more.
What is the significance of the US 15-point Iran peace plan?
It suggests active negotiations may be underway. The argument is that if a real ceasefire follows, Bitcoin could react strongly, just as it did during a previous US-Iran ceasefire.
How much did Bitcoin rise after the last ceasefire?
According to the material, Bitcoin rallied 26.7% shortly after the last ceasefire was introduced between the US and Iran.
Why does oil matter so much for Bitcoin right now?
Because falling oil could weaken the inflation narrative that has paralyzed the Fed. If inflation concerns ease, liquidity expectations may rise, which is seen as a major positive for Bitcoin.
What is the “final trap” in 2026?
It refers to the possibility that Bitcoin could still drop toward $65,000, $60,000, or even $55,000 before forming a bottom and moving much higher afterward.
Why is the 200-week moving average important?
It has historically been near major Bitcoin bottoms. The current level is around 59,262, which makes it a key area in the current setup.
Why is April 9 being watched so closely?
That is when the PCE reading is expected. If it comes in softer than anticipated, the market could quickly bring the rate cut narrative back, which may help Bitcoin price in higher liquidity expectations.
Why could May be a big month for Bitcoin?
Because Treasury reductions in bill supply are expected to create a $250 billion to $300 billion net decline by early May, and that is interpreted as liquidity entering markets at a time when other supportive conditions may also be developing.
Source Video

Omar Al-Sharif lives and works in the UAE and is involved in the blockchain technology industry. He writes articles on Bitcoin and digital assets as a personal passion, explaining complex topics in simple and understandable language.


