Is BTC carving out a local low, or just pausing before the next decisive move? On the 4-hour chart, the key tension is not simply up versus down, but whether the current structure has done enough in both price and time to qualify as complete.
According to Koenz Trading, the highest-probability takeaway right now is that whatever Bitcoin is building “is not yet finished.” That conclusion matters because it keeps the door open to more upside, more sideways movement, or both, even while the broader bearish case remains alive below a critical invalidation level.
The core call: Bitcoin likely needs more time, more price, or both
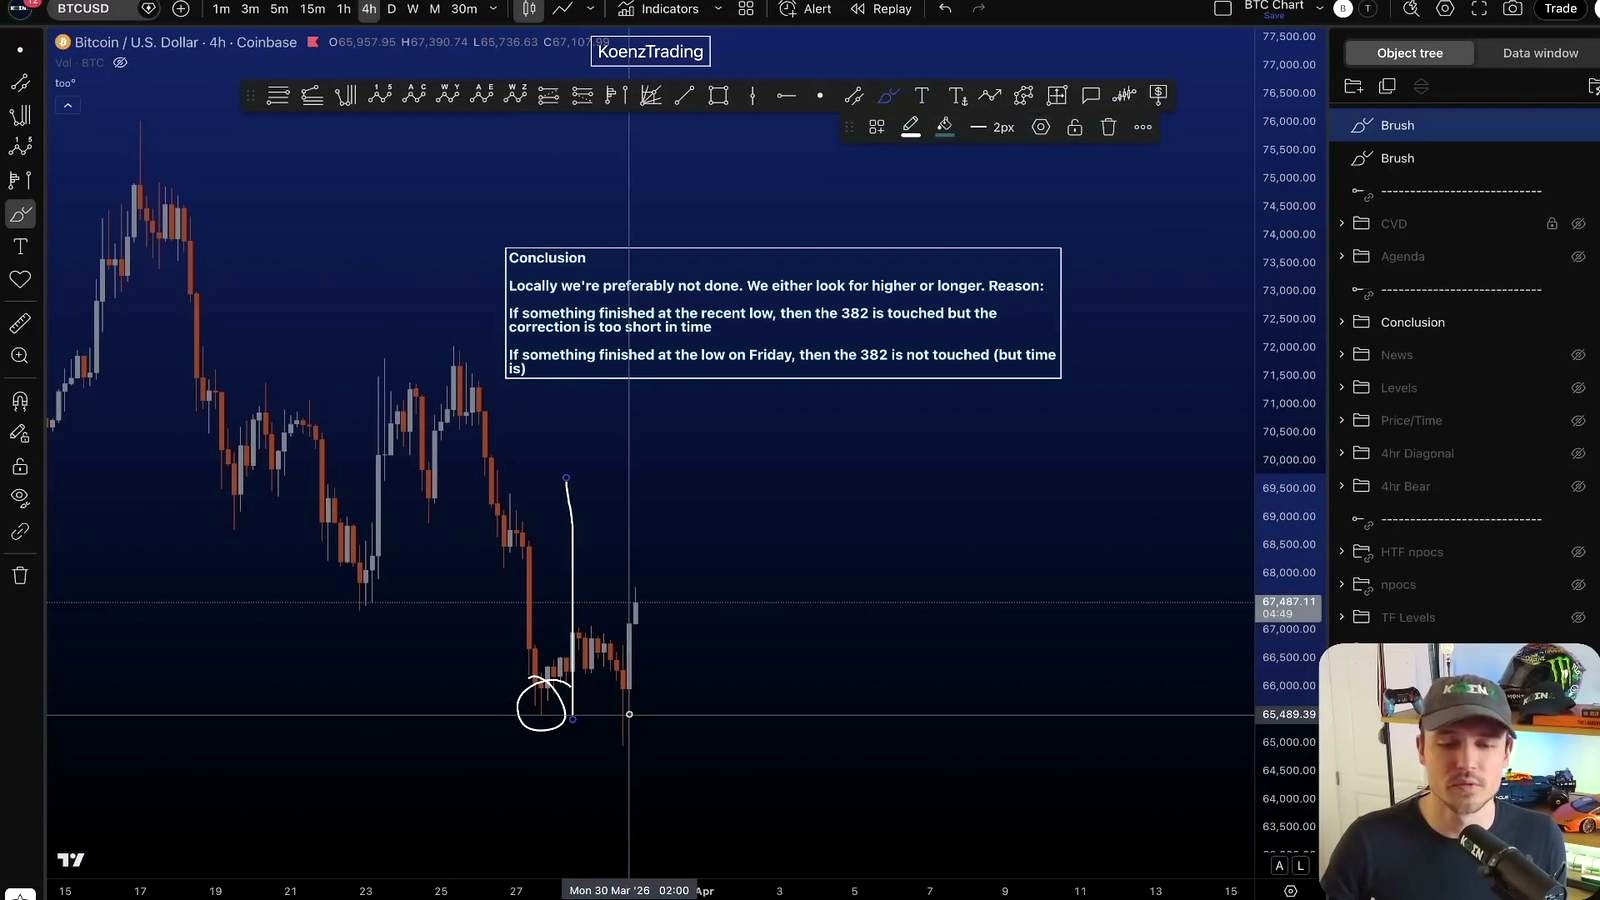
Koenz Trading’s main argument rests on a pair of Elliott Wave and Fibonacci minimums that, in his view, have not been satisfied together. He focuses on the 0.382 Fibonacci retracement and the 0.382 Fibonacci time as baseline requirements for a corrective structure.
The analyst says recent Bitcoin action has met one condition at a time, but not both simultaneously. If the move had already finished at one low, the structure would have respected time but not price. If it had finished at another low, it would have respected price but not time. Because one of those two minimums is still missing in either interpretation, he argues the odds favor an unfinished pattern.
That leads to a practical conclusion: the market is still biased toward higher, longer, or both before this phase can be considered done.
The numbers that matter most
Koenz Trading gave several concrete levels and timing markers that define his bullish and bearish scenarios:
- 60K: key downside low the bearish scenario would target and also the bullish invalidation level
- 72K: bearish invalidation level and the upside level BTC must reclaim to strengthen the bullish case
- 0.618 to 0.886: Fibonacci retracement zone for the blue-box pullback area after a diagonal
- 0.382: minimum Fibonacci retracement and minimum Fibonacci time threshold highlighted in the analysis
- 31 March, 10 p.m. CET: the analyst’s cited 0.382 Fibonacci time marker
- 4-hour: chart timeframe used for the analysis
- 45-minute: order block where price was rejecting
- 30-minute: newer order block identified below price
Why the bearish setup is still in play
Koenz Trading starts from a bearish interpretation in which Bitcoin is forming a “multi 1-2” setup, followed by continuation lower to take out the 60K low. In that scenario, the market would first produce a corrective wave two bounce and then resume the decline.
The important line in the sand is 72K. The analyst says that bearish count is invalidated if Bitcoin moves up and takes out that high. Until then, the downside continuation thesis remains structurally valid, even if the market stages a rebound first.
That distinction is central to the video. A bounce does not automatically prove a bullish reversal. In his framework, BTC can rally in the short term and still remain inside a broader bearish pattern if that advance turns out to be corrective rather than impulsive.
The bullish case exists, but it starts as lower probability
Koenz Trading also outlines a bullish scenario built around a leading diagonal to the upside. He explicitly describes that as a lower-probability Elliott Wave scenario at the outset, meaning bulls begin “on the back foot.”
For that to improve, Bitcoin must do more than bounce. The host says the move down needs to prove itself as corrective, and the market would then need to push upward and take out the 72K high. That would shift probabilities more clearly in favor of continuation higher.
He also notes that after a diagonal, a deep retracement is common. That is why he highlighted a blue-box zone based on the 0.618 to 0.886 retracement measured from the low to the high of wave 1 or A. He says that zone has already been touched.
Why both bulls and bears briefly point to the same trade direction
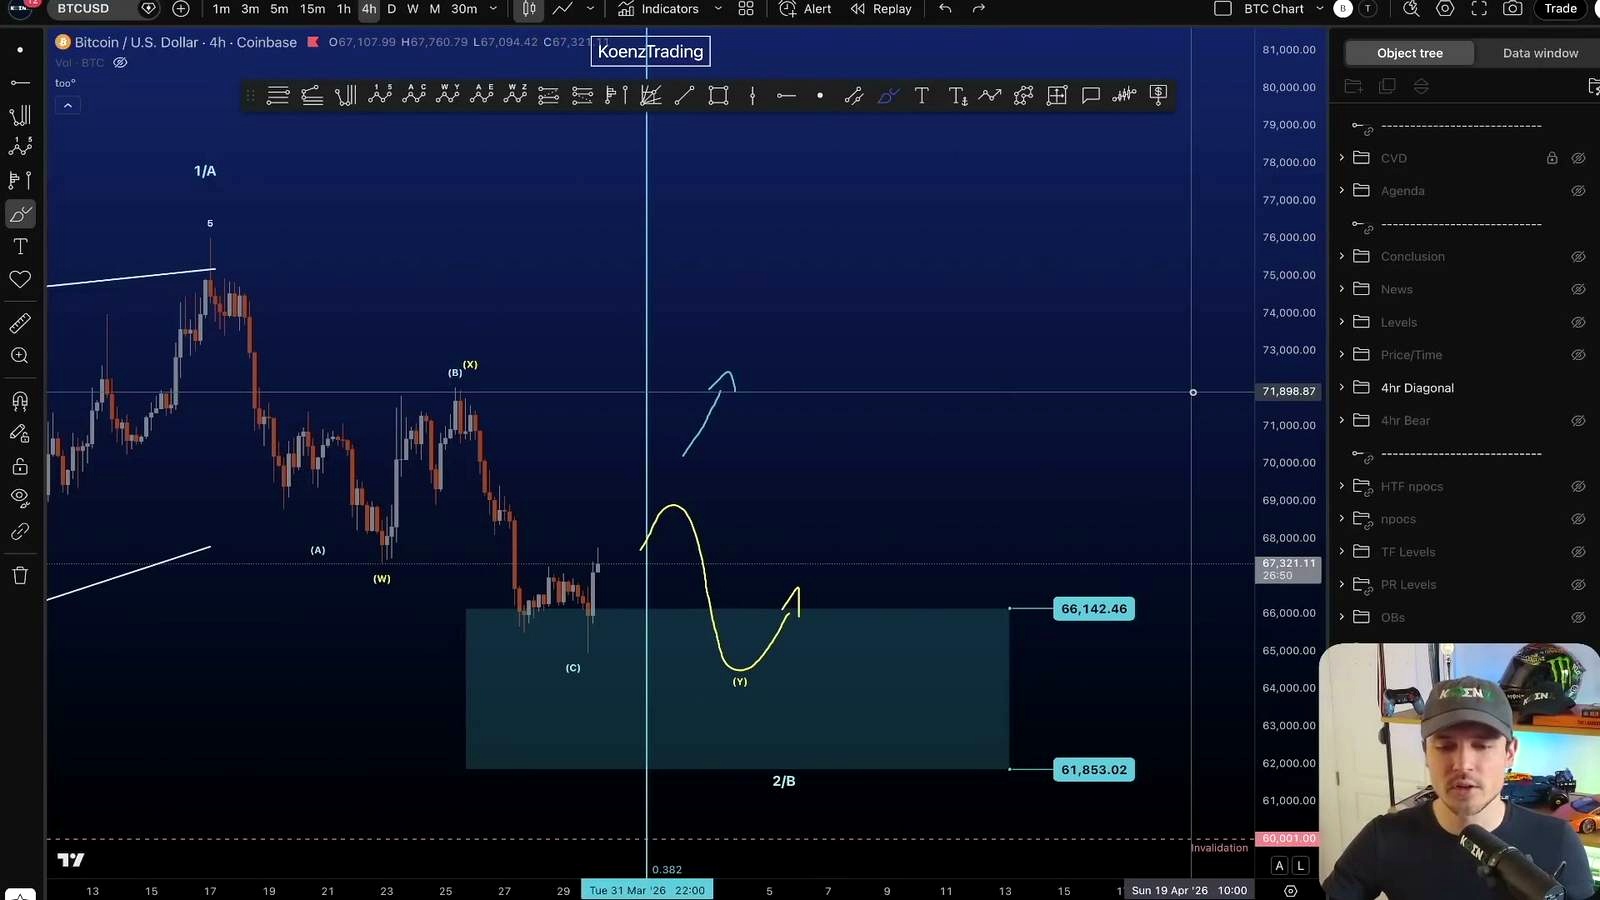
One of the more useful points in the video is that both the bullish and bearish counts can imply the same near-term move. Koenz Trading says that after a local five-wave move down, he would expect a bounce regardless of whether that low ends up being labeled wave 1 or wave C.
That means traders should not treat every short-term rally as a clear directional verdict. In his reading, the opportunity is “relatively similar” in both cases because each count initially allows for a move higher off a completed five-wave decline.
What matters comes next. If the rebound is corrective, it can fit either a bearish continuation setup or a more complex bullish correction such as W-X-Y. If the rebound is motive, then the market has to be taken more seriously as a candidate for upside continuation.
The time factor may be the most overlooked part of the setup
Koenz Trading spends much of the video on time rather than just price. He compares the duration of the move up with the move down and emphasizes that corrective structures commonly need to reach at least the 0.382 Fibonacci time.
His marker for that threshold sat at 31 March at 10 p.m. Central European Time. He also adds an Elliott Wave nuance: diagonals tend to be long in time, while impulses are usually shorter. Time alone does not invalidate or confirm a pattern, he says, but it remains an important input when assessing whether a correction has likely ended too early.
This is also why his conclusion avoids a simple bullish or bearish headline call. The stronger message is that the present formation probably still needs development before the market reveals which larger scenario is actually playing out.
Secondary technical levels on the chart
Beyond Elliott Wave structure, the analyst points to several nearby chart features. He says Bitcoin touched a high-timeframe value area low, and he also references more local volume levels and higher-timeframe horizontal levels.
On the upside, he flags local range levels that could act as resistance. In the shorter term, he says price was rejecting at a 45-minute order block, while a 30-minute new order block sat below price as a nearby support area.
These are not presented as standalone predictions. Instead, they provide context for how the current bounce might behave while the larger pattern remains unresolved.
What to watch next
The next decisive clues are straightforward. First, watch whether Bitcoin can build on the bounce in a way that looks impulsive rather than corrective. Second, watch the two major invalidation levels: 60K and 72K.
A break above 72K would damage the bearish count and improve the bullish case materially. A move below 60K would invalidate the bullish diagonal interpretation and support the idea that the larger bearish continuation is underway.
Koenz Trading also highlights a practical catalyst risk: scheduled news events on Tuesday, Wednesday, and Friday, all referenced in Central European Time. His point is simple: volatility could rise before the chart structure fully resolves.
FAQ
What is the single most important takeaway from the analysis?
Koenz Trading’s main point is not “Bitcoin is bullish” or “Bitcoin is bearish.” It is that the current structure likely has not finished forming because minimum Fibonacci conditions in price and time have not been met together.
Why does 72K matter so much?
72K is the pivot level for both scenarios. The analyst says it invalidates the bearish setup if reclaimed, and it is also the level bulls need to break to give the lower-probability bullish count more credibility.
Does the analyst expect a bounce even in the bearish case?
Yes. He says both the bullish and bearish counts can still imply a near-term move higher because a completed local five-wave decline is often followed by a rebound, regardless of whether the low is wave 1 or wave C.
What would invalidate the bullish scenario?
In the bullish diagonal interpretation, the invalidation is 60K. A move below that level would undercut the case that Bitcoin is building a bullish structure from the recent low.
Why did the analyst focus so much on time, not just price?
Because in Elliott Wave analysis, corrective structures are judged by duration as well as depth. Koenz Trading says the 0.382 Fibonacci time is a common minimum target, so a move that hits price objectives too quickly can still look incomplete.
Original Video

John Burnell focuses on Bitcoin infrastructure, wallet security and blockchain technology. He writes educational articles explaining how Bitcoin works and how the technology evolves.


