Something feels unstable right now. The usual story around Bitcoin is being interrupted by a stranger signal: oil, energy costs, and a mining metric that has started moving fast.
That combination is making one idea harder to ignore — if the old floor under Bitcoin is slipping, the next washout could go deeper than many expect.
Why this setup suddenly looks dangerous

The core concern is simple, even if the mechanics are not. In past bear markets, the cost to produce Bitcoin acted like a kind of floor. It was the level where price often found support, bounced, and started moving higher again.
About a month ago, that production cost was sitting around $74,500. Since then, the picture has changed quickly.
- Energy prices have spiked
- Hash rates have fallen
- Mining machine efficiency has improved
- The average electrical cost to mine Bitcoin has shifted sharply
That is where the tension begins. A metric that once looked supportive is now moving lower, and that changes the conversation around where a true bottom might be.
The metric drawing attention
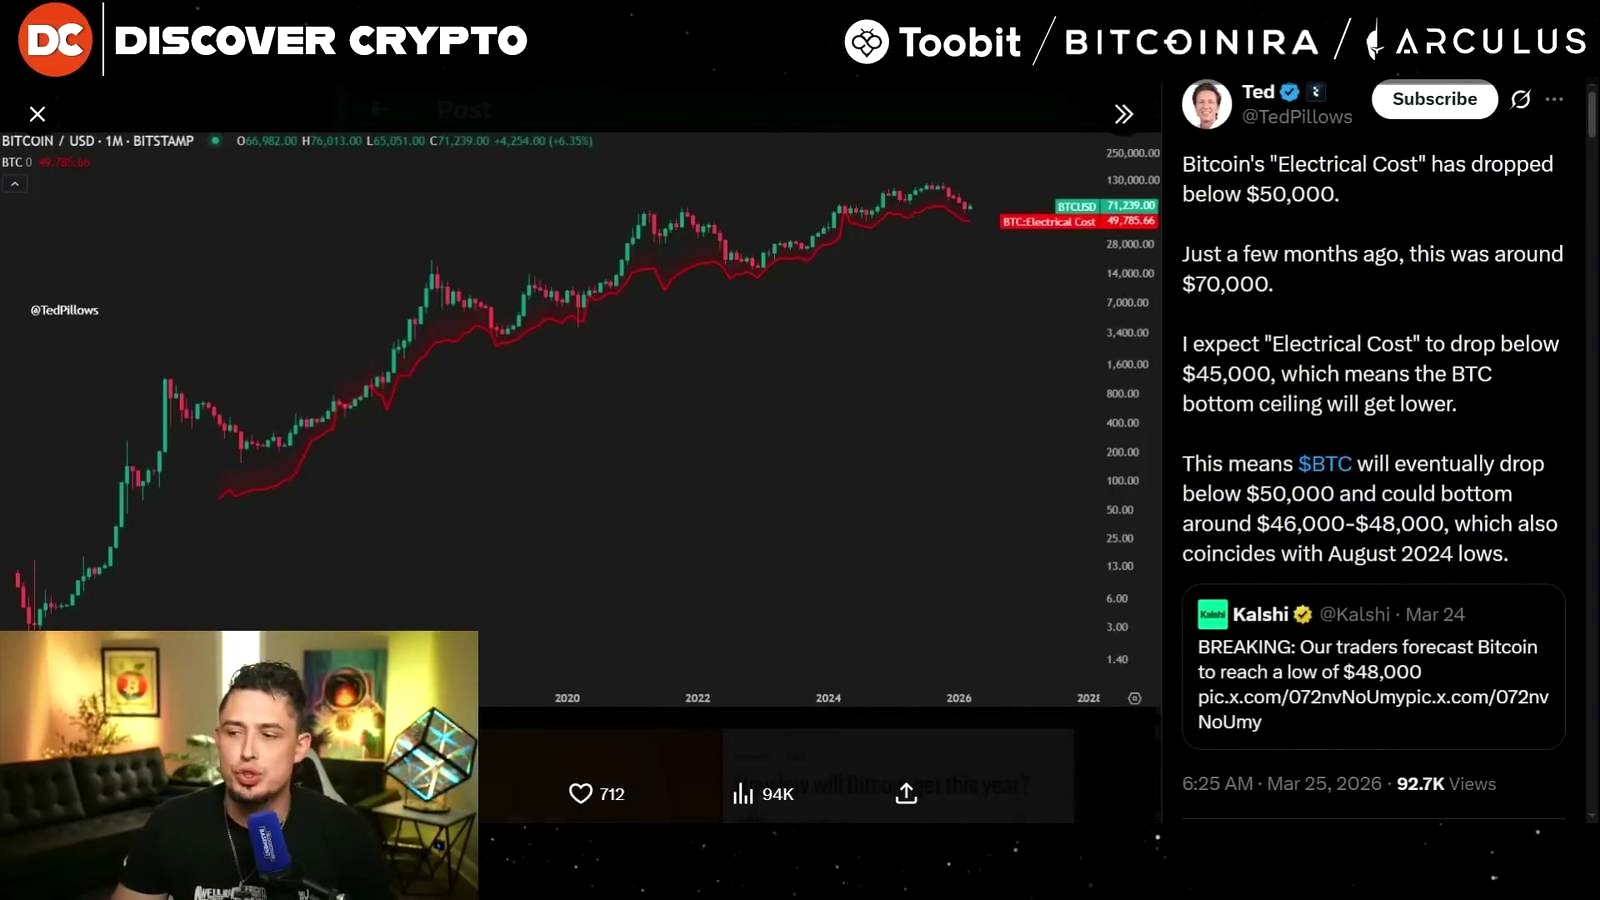
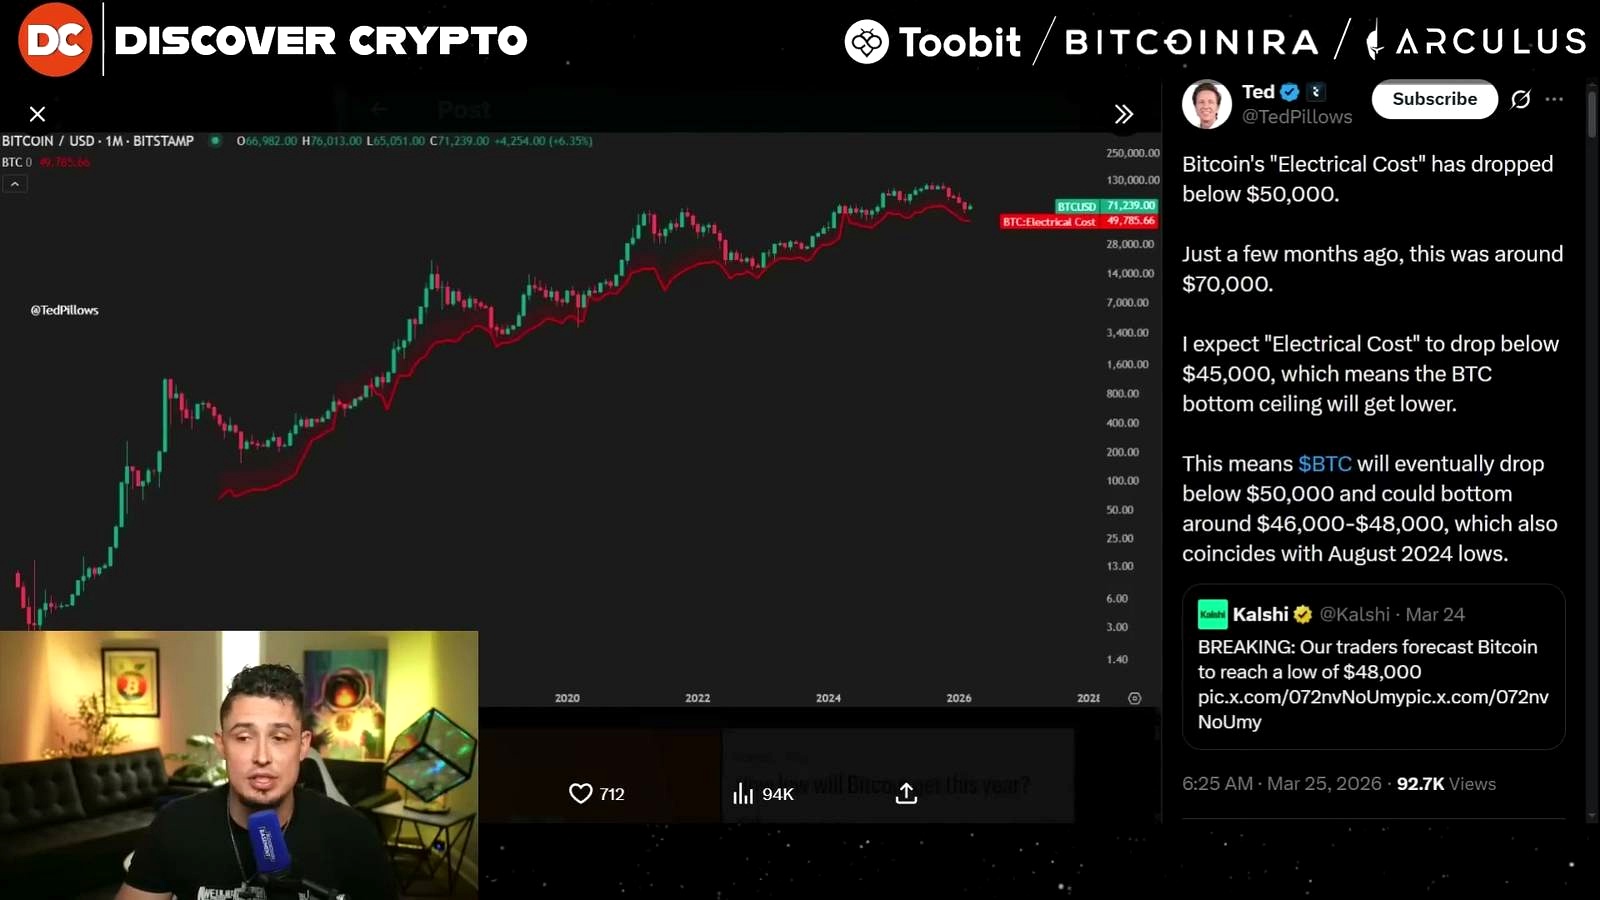
Electrical cost has dropped below $50,000
A post from Ted Pillows on X highlighted the move that is now getting traders’ attention: the Bitcoin electrical cost has dropped below $50,000.
Just a few months ago, the same metric was around the $70,000 area. As of this reading, the estimated raw electricity cost to mine one Bitcoin had fallen to $49,785.
That matters because when Bitcoin trades below this kind of modeled cost line, miners can start losing money on power. From there, pressure can build:
- Mining rigs may be shut down
- Miners may sell Bitcoin to cover costs
- Capitulation risk rises during a weak market stretch
The implication is unsettling. If the electrical cost keeps falling, the old bottom zone may not hold the way many hope.
Where this data comes from
This line is described as a modeled proxy based on network difficulty. It takes into account:
- Hash rates
- Average hardware efficiencies
- Electricity price
The chart comes from a TradingView indicator often referred to as the Bitcoin electrical cost or R2-D2 — meaning total electrical cost, not anything more glamorous than that.
By that specific measure, the claim is real: raw electricity cost has fallen sharply.
Why lower mining costs can actually be bearish
This is the twist that makes the whole setup feel backward. Better mining efficiency sounds positive. Cheaper production sounds positive too. But in a bear market, that same improvement may drag the baseline lower.
If miners can produce Bitcoin more cheaply, then the level that historically acted as a floor can also fall. In other words, a lower cost structure can mean a lower bottom ceiling.
Ted Pillows’ view goes further: if electrical cost drops below $45,000, Bitcoin could eventually fall below $50,000 and bottom somewhere around $46,000 to $48,000. That would also line up with the August 2024 lows.
For bulls, that is the uncomfortable part. Efficiency does not automatically remove risk. It may be quietly relocating it.
The nuance most people skip
Raw electrical cost is not the full bill
There is an important distinction here. Raw electricity cost is one thing. The all-in cost of mining is something else entirely.
That broader figure can include:
- Depreciation of assets
- Power cost
- Operations
- Hosting services
Those combined costs still come in around the $70,000 mark, and sometimes overall operational costs can hit $100,000.
So the lower electrical-cost metric does not tell the whole story. But it is still a powerful signal, especially if traders are using it to judge where pain could accelerate.
The dark horse: hyper-efficient rigs
There is another reason this issue is so fluid. New, highly efficient mining rigs are changing break-even levels. One example mentioned is the Antminer S23H, which can have a break-even as low as $44,000 in cheap power regions.
That means some miners may be able to withstand lower prices than before. It also means the network adapts, and the idea of a fixed “bottom” becomes more slippery.
Even after the 2024 halving, miners are still upgrading hardware. Efficiency is improving. Hash rate adjustments are happening. And the result is not a clean signal, but a moving target.
Oil is making everything harder to ignore
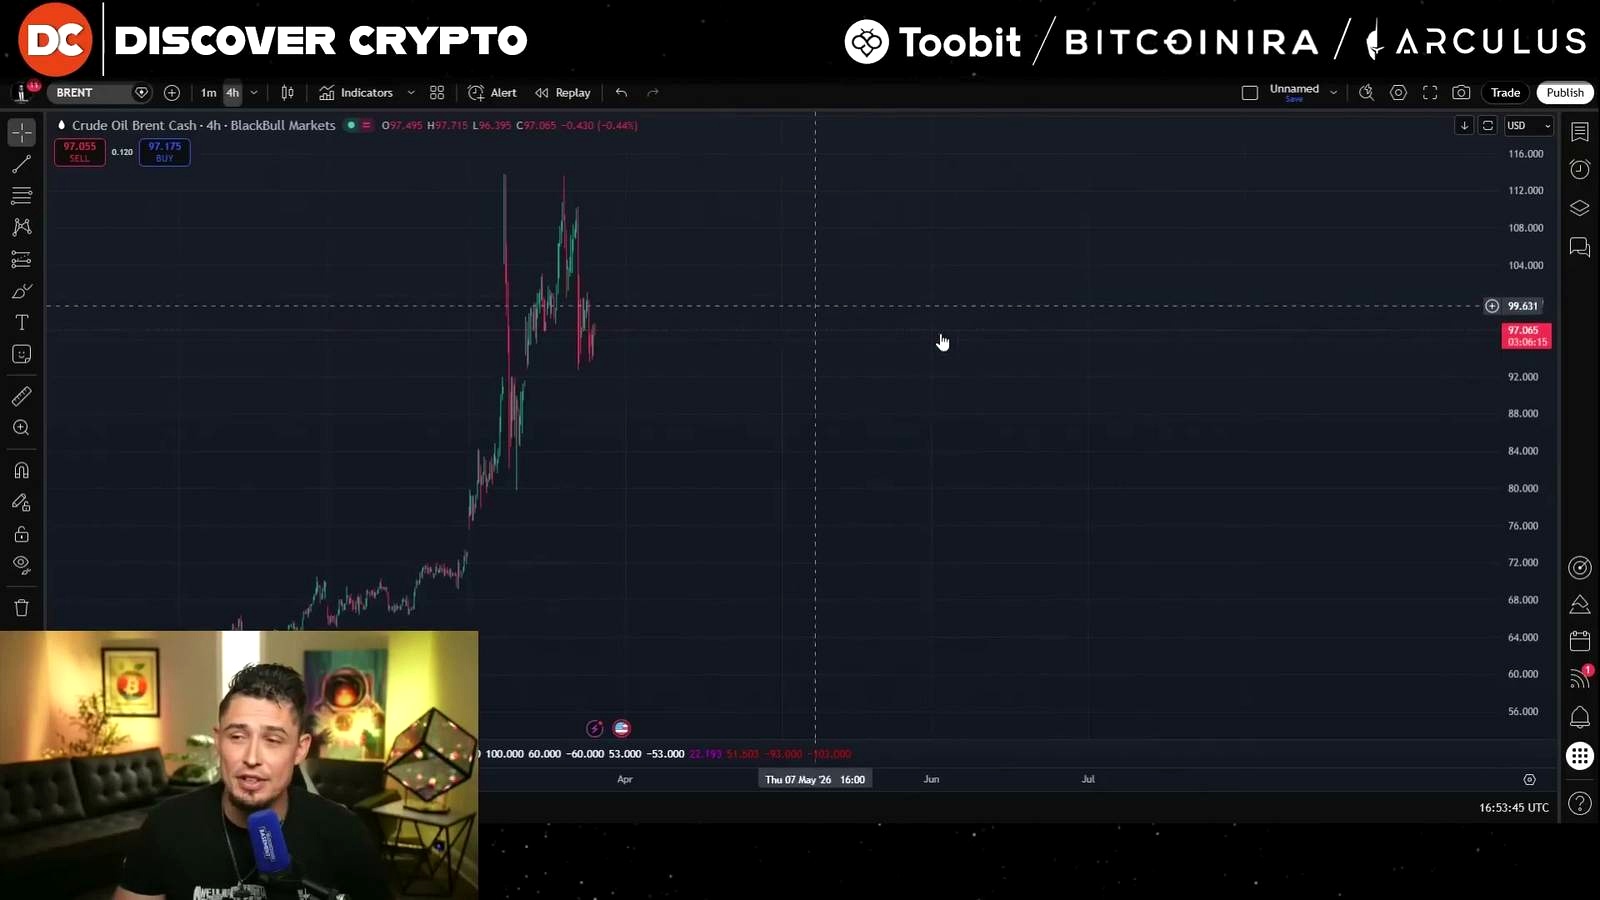
Oil recently spiked to $113 a barrel and is now sitting around $97. That level is being watched closely because every time oil pushes toward $100, market tension seems to rise with it.
At the same time, the geopolitical backdrop remains shaky.
- There were peace announcements from Trump
- Those announcements were followed by Iranian denials
- Iran rejected the proposed ceasefire
- The Strait of Hormuz still looks skittish, with boats waiting for a chance to pass
The bigger fear is not just headlines. It is what happens if oil keeps rising and the Strait of Hormuz remains disrupted. In that scenario, stress on miners could build further, especially if organizations are forced to sell Bitcoin to cover costs.
That is where the sub-$50,000 talk starts sounding less dramatic and more plausible.
The case for a lower washout — and the case against it

The bearish path
If oil continues to skyrocket, if the geopolitical conflict intensifies, and if miner capitulation picks up, then another washout could send Bitcoin below $50,000.
The most aggressive downside view in this setup points to roughly $46,000 to $48,000.
The more resilient view
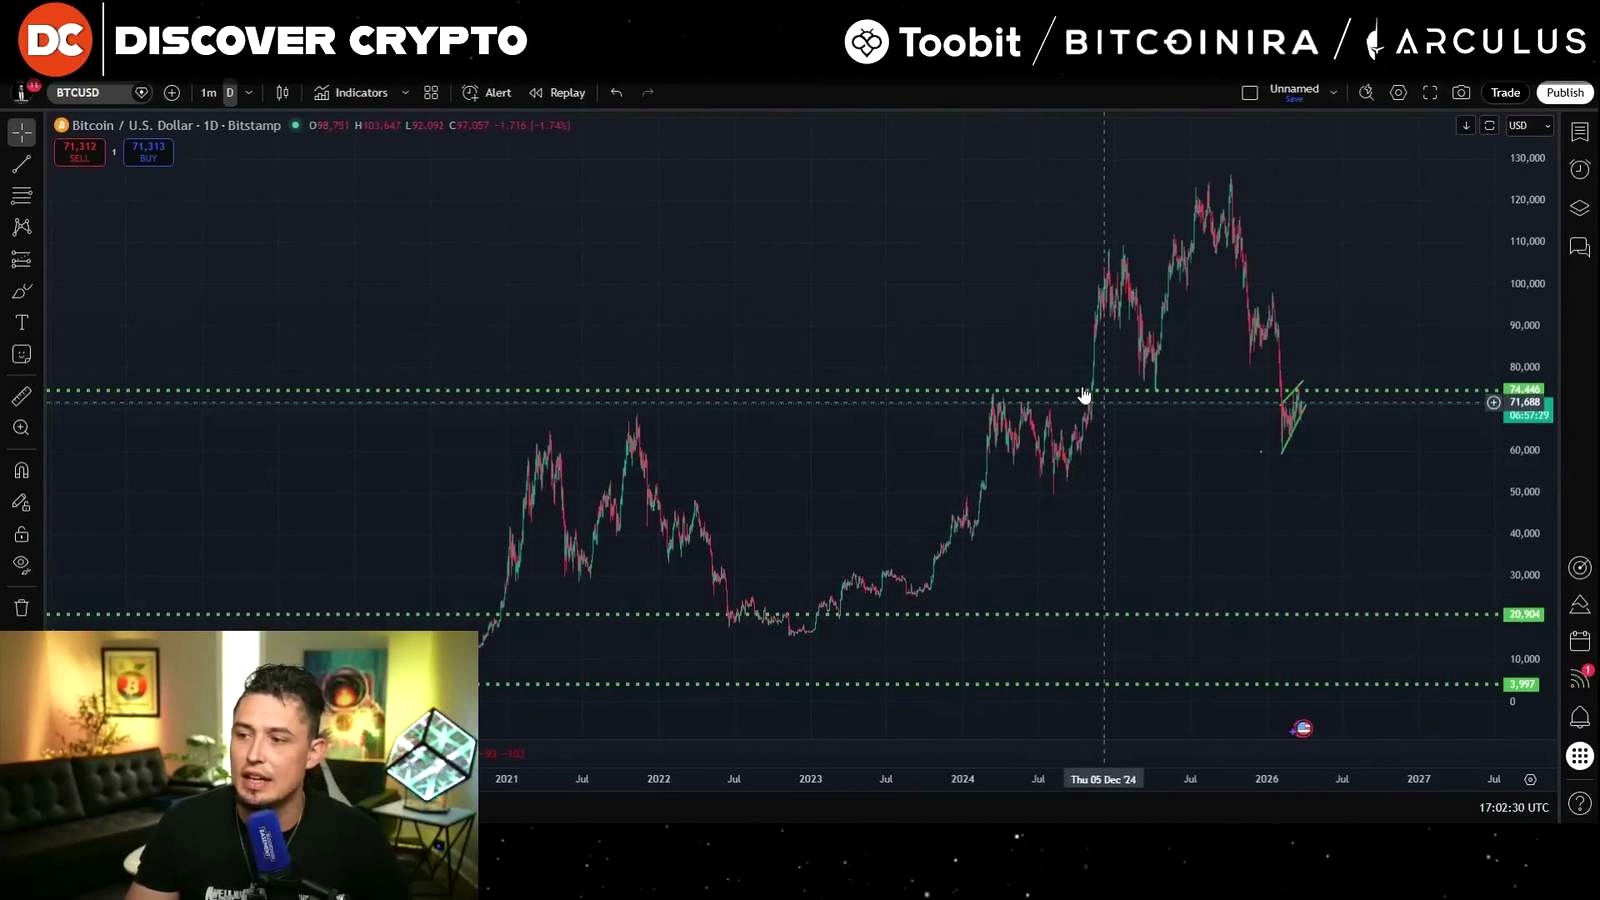
There is still a counterargument. Despite all of this tension, Bitcoin has been holding around the $70,000 region. That relative strength matters.
There is also a view that the lower end of the ETF gather-up region around $53,000 could act as a buoyant point if another sharp sell-off hits.
And in the short term, there are signs that the market is trying to stabilize:
- A green dot on the daily time frame
- Strong-looking moving averages
- Agressive improvement out of red money flow
That does not erase the downside risk. It just means the market is still fighting over the range.
A market caught between fear and resilience
Right now, this does not look like a clean breakdown or a clean recovery. It looks like a battle inside a range, with traders waiting for a break either higher or lower.
The emotional split is obvious. On one side, there is hope that Bitcoin has already bottomed or is at least close to that zone. On the other, the data suggests that the floor itself may be moving lower.
That is why the electrical cost of Bitcoin is suddenly becoming one of the most important metrics to watch. It is not a guarantee. It is not destiny. But it may be the signal that tells traders whether the next move is just noise — or something far uglier.
FAQ
Why is oil being linked to a possible Bitcoin crash?
The concern is that rising oil and energy stress can feed into mining costs and market pressure. If oil keeps climbing and geopolitical tensions stay elevated, miners may face more strain and could be forced to sell Bitcoin to cover costs.
What is the Bitcoin electrical cost metric?
It is a modeled proxy based on network difficulty that considers hash rates, hardware efficiency, and electricity prices. It is used to estimate the raw electricity cost of mining one Bitcoin.
What is the current electrical cost to mine one Bitcoin?
According to the metric cited here, the estimated raw electricity cost has fallen to $49,785, down from around $70,000 a few months earlier.
Does that mean Bitcoin must fall below $50,000?
No. The data is real, but the price implication is still a prediction. One view is that Bitcoin could eventually bottom around $46,000 to $48,000, while another sees $53,000 as a likely support area in a washout.
Why can lower mining costs be bearish?
Because if Bitcoin becomes cheaper to produce, the historical floor tied to production cost can also move lower. That may lower the level where Bitcoin finally finds support in a bear market.
Are miners all facing the same break-even level?
No. All-in mining costs can still sit around $70,000 and sometimes even $100,000, but newer hyper-efficient rigs can break even much lower, in some cases around $44,000 in cheap power regions.
What levels are being watched most closely now?
The key levels discussed here are $50,000, the possible $46,000 to $48,000 bottom zone, and the $53,000 area as a potentially buoyant support point during another washout.
Video Source

Omar Al-Sharif lives and works in the UAE and is involved in the blockchain technology industry. He writes articles on Bitcoin and digital assets as a personal passion, explaining complex topics in simple and understandable language.


