Something feels close. Ethereum is moving down toward major structure support, and the next move is being framed as one of those moments traders remember for years.
The tension comes from a familiar setup: a bearish flag pattern that, if broken, could trigger a sharp move lower. But the same warning also carries another message—what looks like panic can become opportunity if the right signals appear.
Why This Ethereum Level Matters So Much
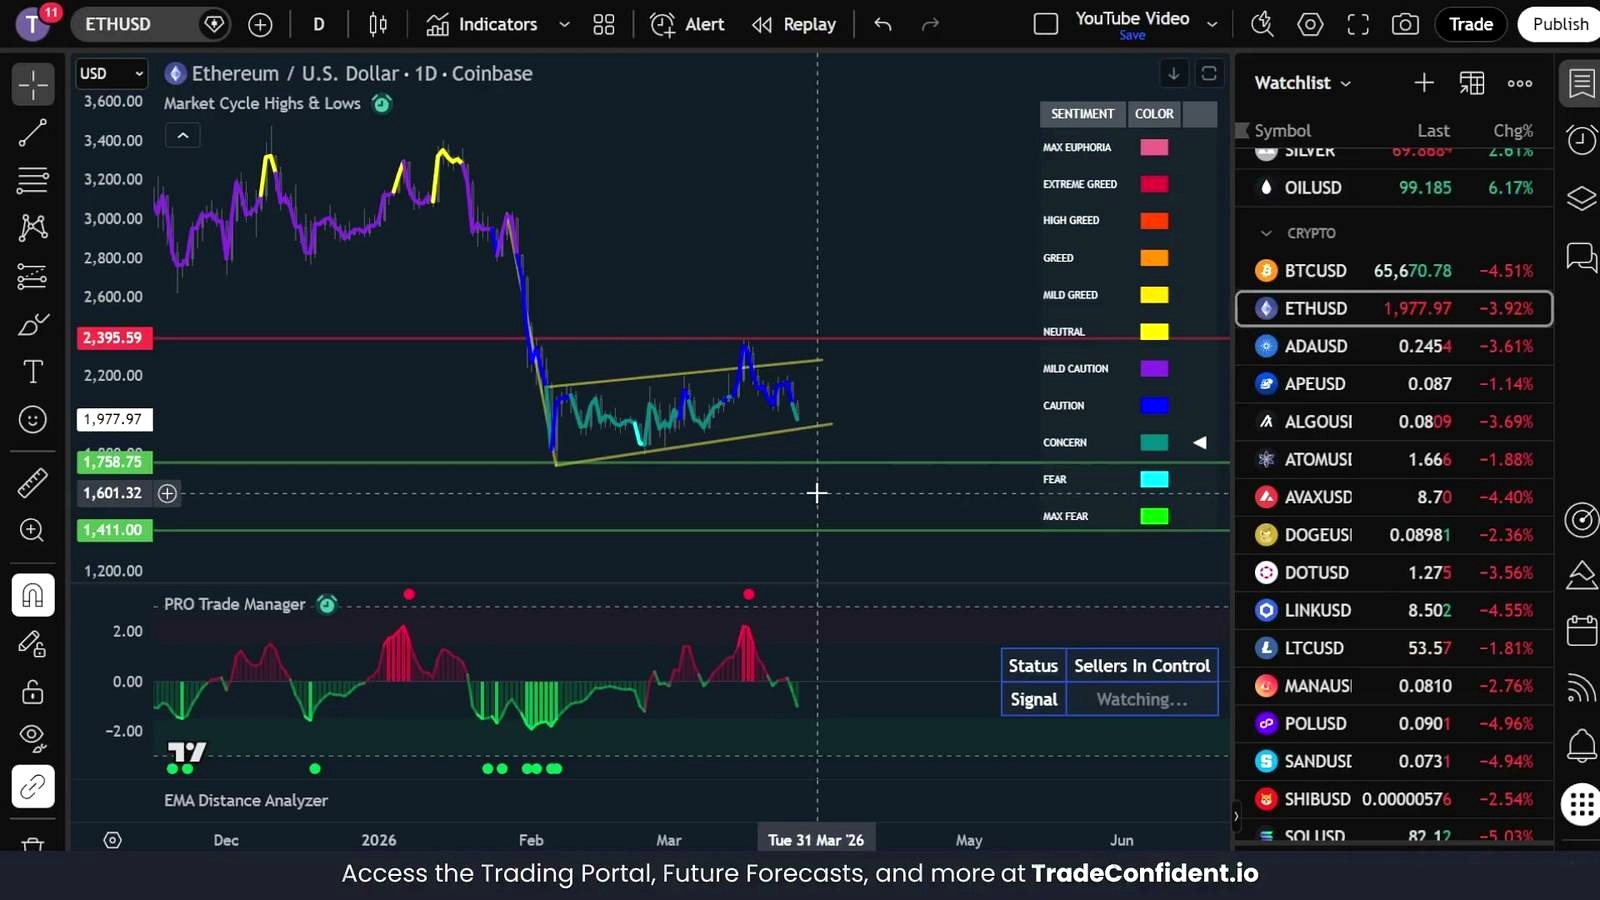
Ethereum is heading down to retest major structure support on the daily timeframe. If price breaks below that area, it would also mean breaking a bear flag pattern.
That is where the anxiety comes from. The pattern is being described as one that can lead to catastrophic crashes to the downside when it breaks. In other words, this is not being treated like a routine dip. It is being watched as a potentially decisive moment.
A crucial move may be next
The current market drop has already triggered major adjustments in trading positions. The tone is clear: the next move is seen as crucial, with the potential to shape profit opportunities for a long time.
- Ethereum is testing major structure support
- A break below would confirm a bear flag breakdown
- The downside move is being described as potentially imminent
- Traders are watching this area with concern
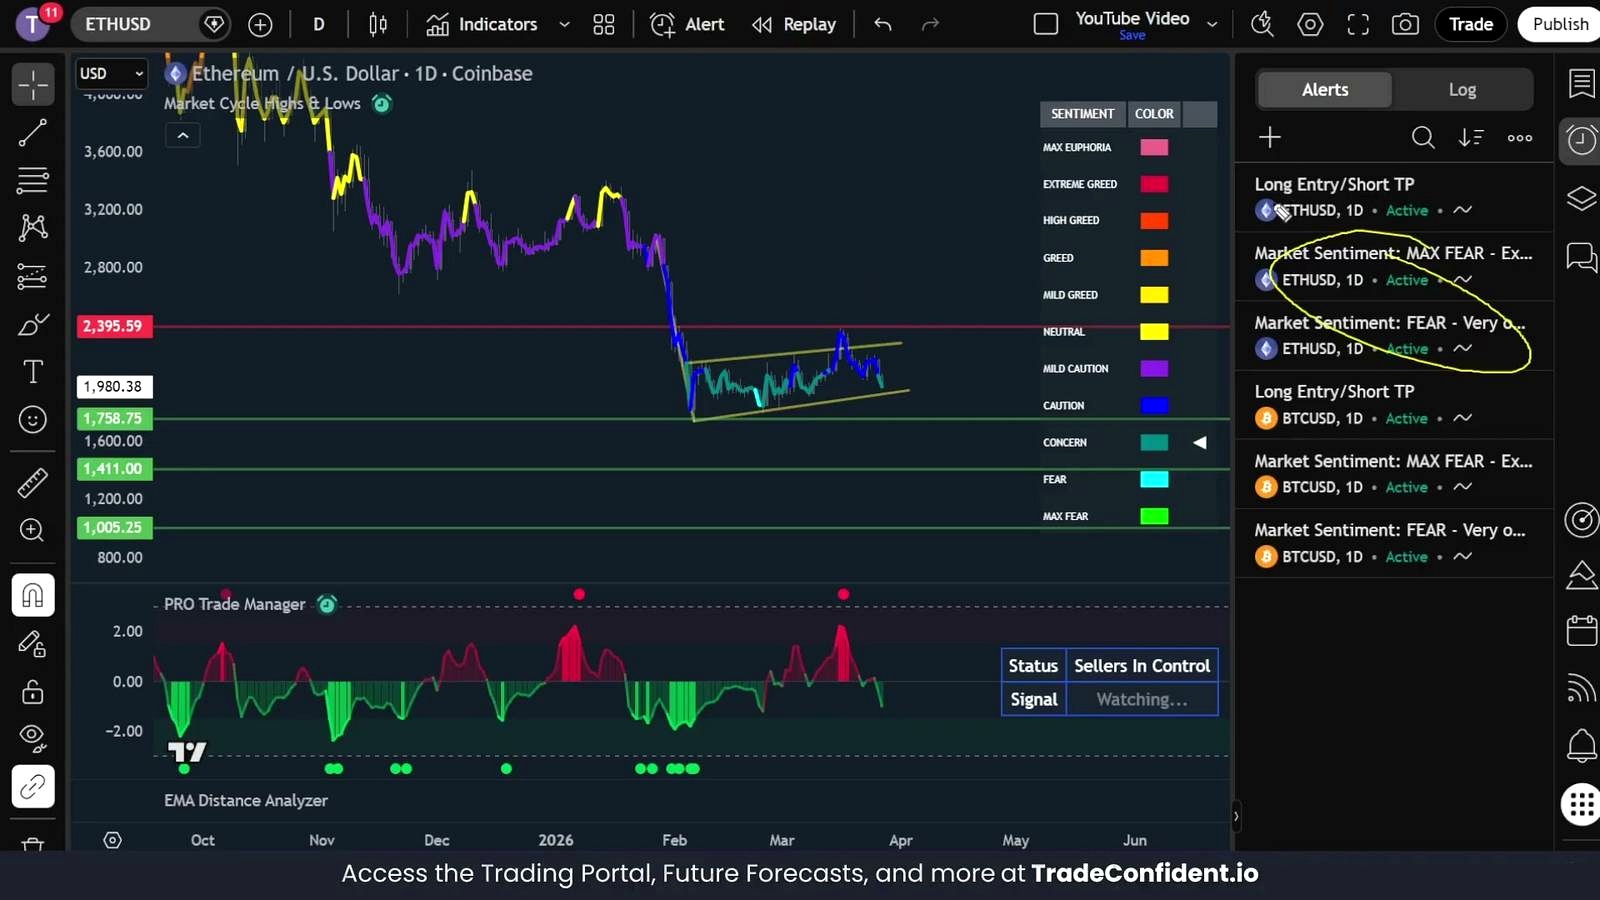
The Indicator Zones Traders Are Watching
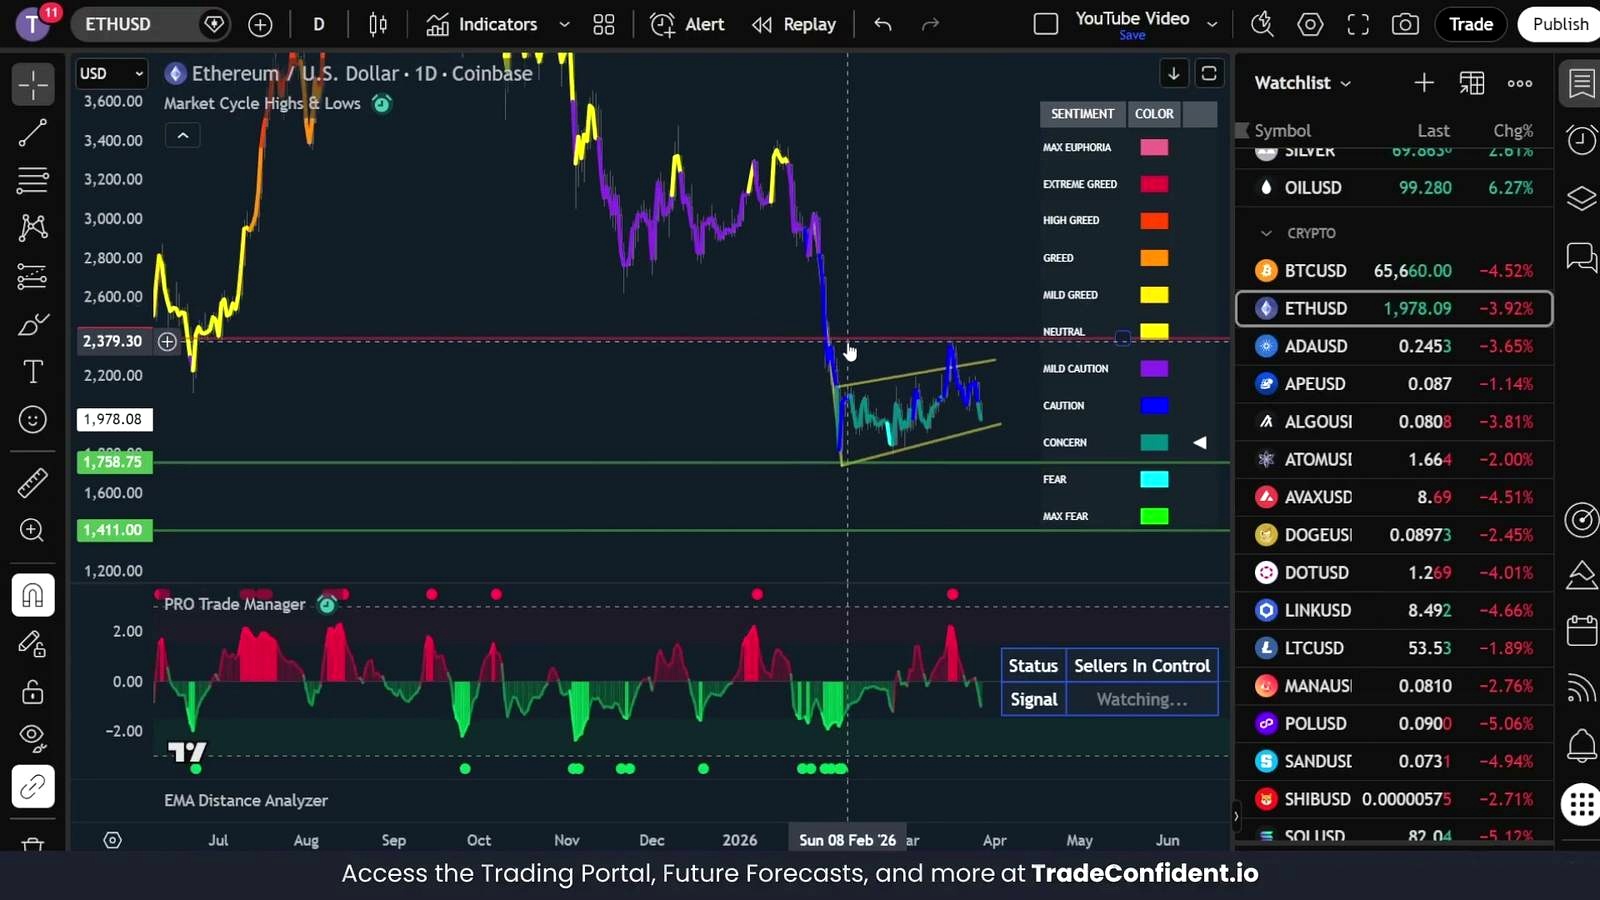
On the chart, the market is currently sitting in a zone labeled concern. According to the setup described, a move lower would push Ethereum into fear and then max fear.
That matters because these zones have historically been linked with major reversals. The idea is simple but powerful: the deepest fear can sometimes appear right as the market is nearing a bottom.
Fear and max fear are not just labels
The market cycle highs and lows indicator is being used to identify these emotional extremes. The argument is that when Ethereum falls into fear or max fear, traders should stop reacting emotionally and start paying close attention.
Not every drop becomes a lasting bottom. But historically, these readings have highlighted the area where major reversals can begin.
The 2022 Bear Market Comparison Is Hard to Ignore
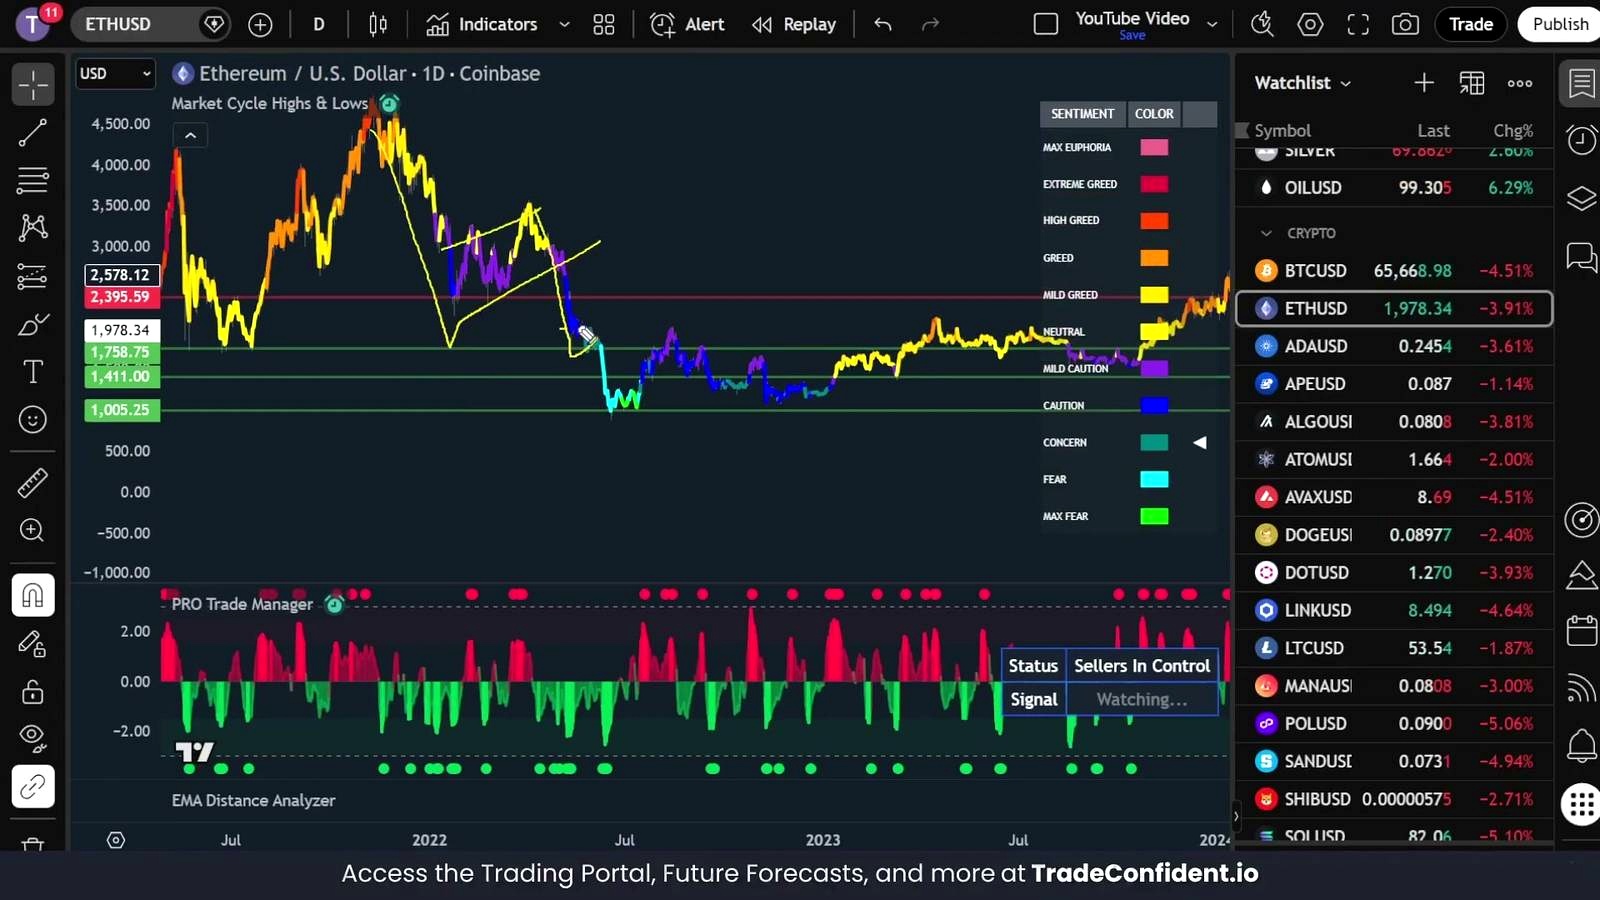
The current setup is being compared directly to the 2022 bear market. Back then, the chart showed a huge bear flag drop, followed by a smaller bear flag, and then another crash lower.
The comparison now is striking: another major drop, another smaller bear flag, and a warning that the next leg down could be coming soon.
What the last bottom looked like
At the previous bottom, Ethereum fell to around $1,000, even slightly below it. The strongest entry areas were marked by fear and max fear readings.
The absolute bottom was called when green dots from the Pro Trade Manager appeared at the same time. Those green dots are used to identify local bottoms, whether the market is bullish or bearish.
- Fear and max fear marked the key entry zone
- Green dots from the Pro Trade Manager called the local bottom
- The combination of cycle fear and local bottom signals created the strongest setup
The 382% Move That Keeps Coming Up
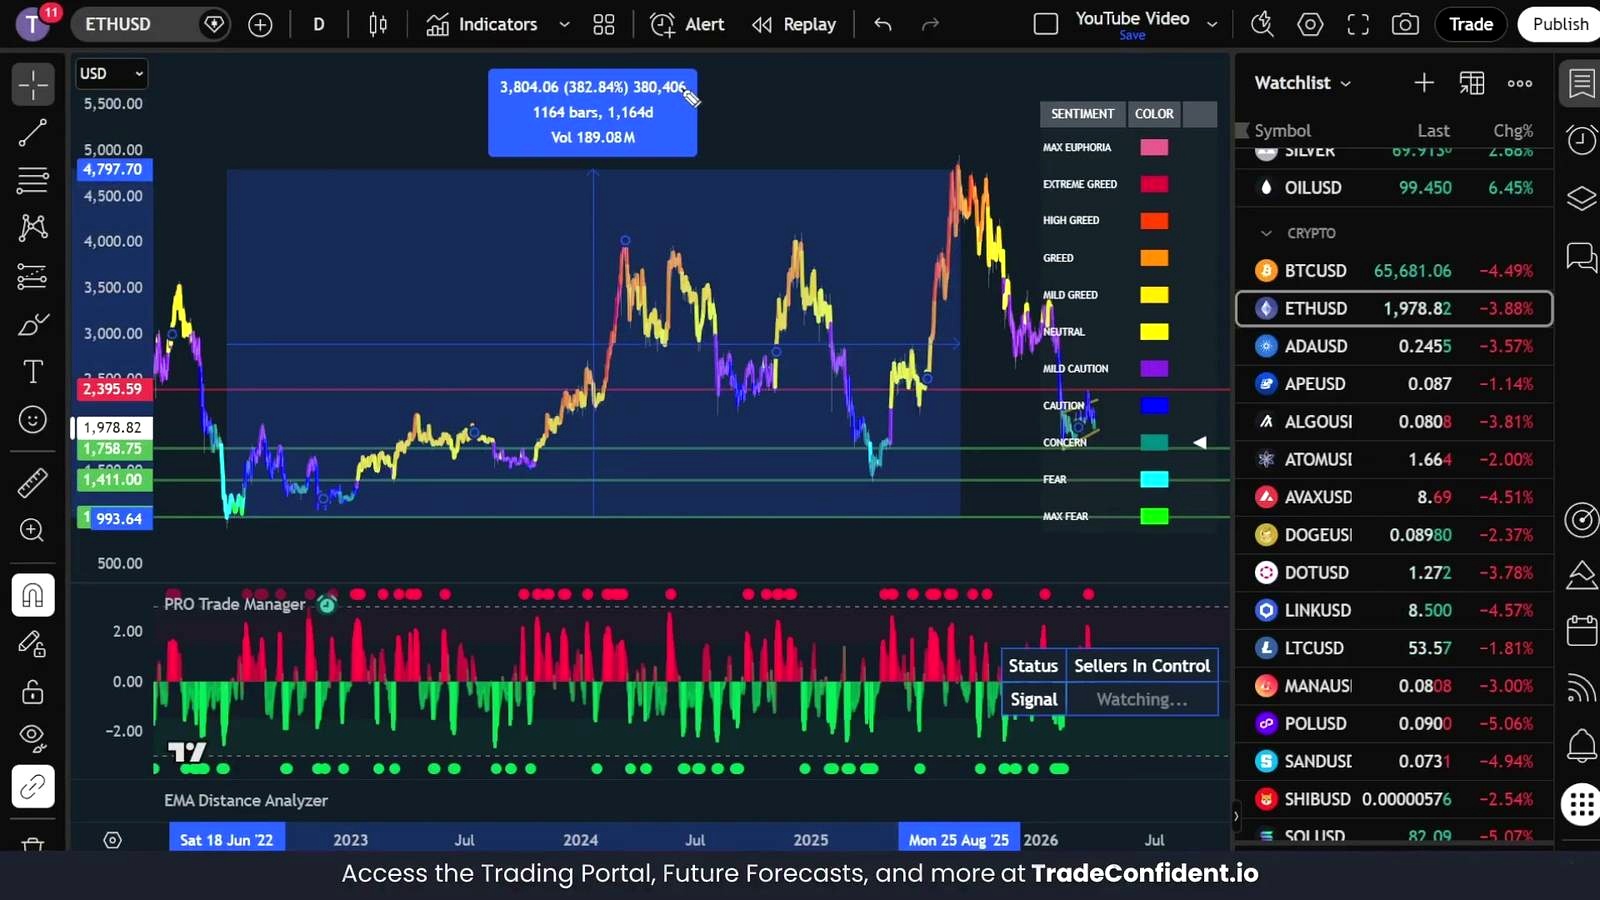
This is the number driving the urgency. From that prior entry point near the bottom to the top of the last bull market, the move reached 382%.
That is why so much emphasis is being placed on what happens next. The warning is not only about avoiding a crash. It is also about not missing the kind of bottom that can lead to massive upside later.
Why missing the signal could matter
The case being made is emotional because it is practical. Most people cannot watch charts all day. They sleep. They work. They have families and responsibilities. If a major bottom forms during that time, it can be easy to miss.
That is exactly why alerts are being pushed as a key part of the strategy.
How the Alert Setup Is Being Used
The process is built around three alerts. The goal is to be notified when Ethereum enters the kind of zone that may produce a major reversal.
- Create an alert for market cycle highs and lows on fear, once per bar close
- Create another alert for market cycle highs and lows on max fear, once per bar close
- Create a final alert for the Pro Trade Manager on long entry short take-profit, once per bar close
Once those alerts are active, the trader simply waits. If a fear or max fear alert appears on a trading device, the next step is to check the chart closely. If the Pro Trade Manager also signals a local bottom, that combination is being presented as a potentially ideal entry area.
Why timing matters here
The logic is built on stacking signals. Fear or max fear may identify the broader bottom area. The Pro Trade Manager may then identify the local bottom within that area.
Together, that setup is described as the kind that can position traders for massive profits if the market turns.
The AI Indicator Sale Is Adding More Urgency

Alongside the chart warning, there is also pressure around the timing of the indicator sale. The sale is ending, and the messaging makes it clear that waiting could mean paying more or missing discounts.
The offer includes up to $700 in value for members, with smaller discounts for non-members. There is also a 25% discount on the first month, bringing the starting cost to less than $50.
What is included in the discount push
- Pro Trade Manager
- Market cycle highs and lows
- Volume bubbles
Members are told they can reveal a coupon code for $200 off each of those indicators. At the same time, the EMA Distance Analyzer is set to increase in price by $100 once the sale ends.
The message is simple: if this Ethereum move is as important as it looks, the tools are supposed to be in place before the market decides what comes next.
What Traders Are Being Told to Watch Right Now
The current focus is narrow but intense. Watch Ethereum at major structure support. Watch for a breakdown of the bear flag. Watch whether concern turns into fear and max fear.
And then, if those readings appear, watch for green dots from the Pro Trade Manager.
That sequence is being treated as the difference between getting caught in a crash and recognizing the kind of bottom that previously led to a 382% move.
FAQ
Why is Ethereum’s current support level important?
Because Ethereum is retesting major structure support, and breaking below it would also mean breaking a bear flag pattern that is being linked to severe downside risk.
What happens if Ethereum drops into fear or max fear?
According to the setup described, those readings have historically marked areas where major reversals can begin.
What did the indicators show at the last market bottom?
The last major bottom near $1,000 was marked by fear and max fear readings, while green dots from the Pro Trade Manager identified the local bottom.
What is the significance of the 382% figure?
It refers to the move from the prior entry area near the bottom to the top of the last bull market, which yielded 382%.
Which alerts are being recommended?
Three alerts: fear on market cycle highs and lows, max fear on market cycle highs and lows, and long entry short take-profit on the Pro Trade Manager.
Why are alerts being emphasized so heavily?
Because most people cannot monitor charts constantly, and alerts can notify them when fear, max fear, or a local bottom signal appears.
What discounts are mentioned for the indicators?
The material mentions up to $700 in value for members, 25% off the first month for sign-up, and $200 off each for certain indicators through a member coupon code.
What happens to the EMA Distance Analyzer after the sale?
Its price is set to increase by $100 once the sale ends.
Source Video

John Burnell focuses on Bitcoin infrastructure, wallet security and blockchain technology. He writes educational articles explaining how Bitcoin works and how the technology evolves.


