Something shifted fast. Just as Bitcoin looked steady near support, the mood cracked and the move lower arrived alongside a sharp hit in stocks.
That is what makes this moment feel tense. The breakdown may be real, or it may be the kind of move that pulls everyone in before the market does something completely different.
Bitcoin breaks down as stocks weaken
Bitcoin has moved to the downside while the stock market is also taking a significant hit. The timing matters. Rather than looking like a standalone crypto event, this drop appears closely tied to broader market weakness.
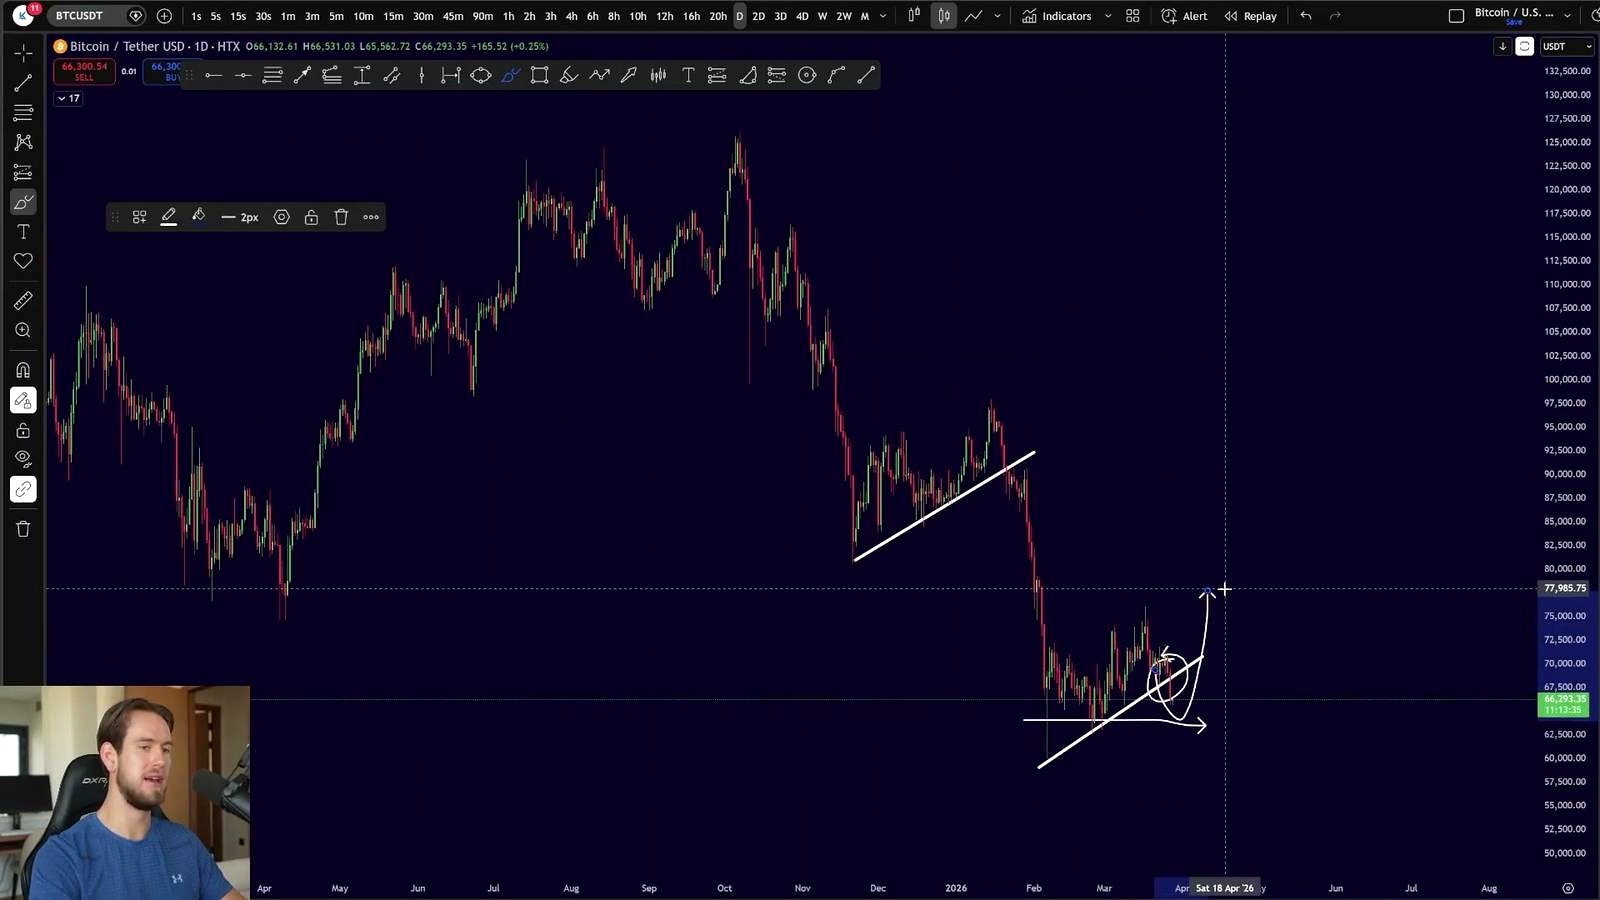
The view presented here is that Bitcoin itself was not necessarily looking especially weak before the move. In fact, it had been returning to a previous resistance area that had turned into support, and that level had been important.
- Bitcoin had been trading above an uptrending support line for a long time
- That structure had held since the beginning of March
- The recent move broke below that support as stocks also sold off
The key question now: trap or start of a bigger slide?
This is the real tension in the market right now. Is this simply a break lower that quickly turns into a recovery, or is it the beginning of the next larger move down?
There are several possibilities being considered:
- A brief break lower, followed by a recovery and even a push to take the highs
- Sideways consolidation near the bottom of the range before another leg down
- A more direct continuation lower, possibly resembling prior downside moves
The argument is not that price will repeat the past exactly. The expectation is that if history rhymes again, at least something will still be different this time.
Why a repeat may not look exactly the same
The idea here is simple: Bitcoin may still produce another downside move, but not in the exact same pattern seen two or three months ago. That difference could show up in several ways.
- One last push higher before falling again
- Longer consolidation near the lower part of the range
- A different sequence, even if the broader direction remains weak
Because of that, the strategy described is to play the market level by level instead of assuming a perfect replay.
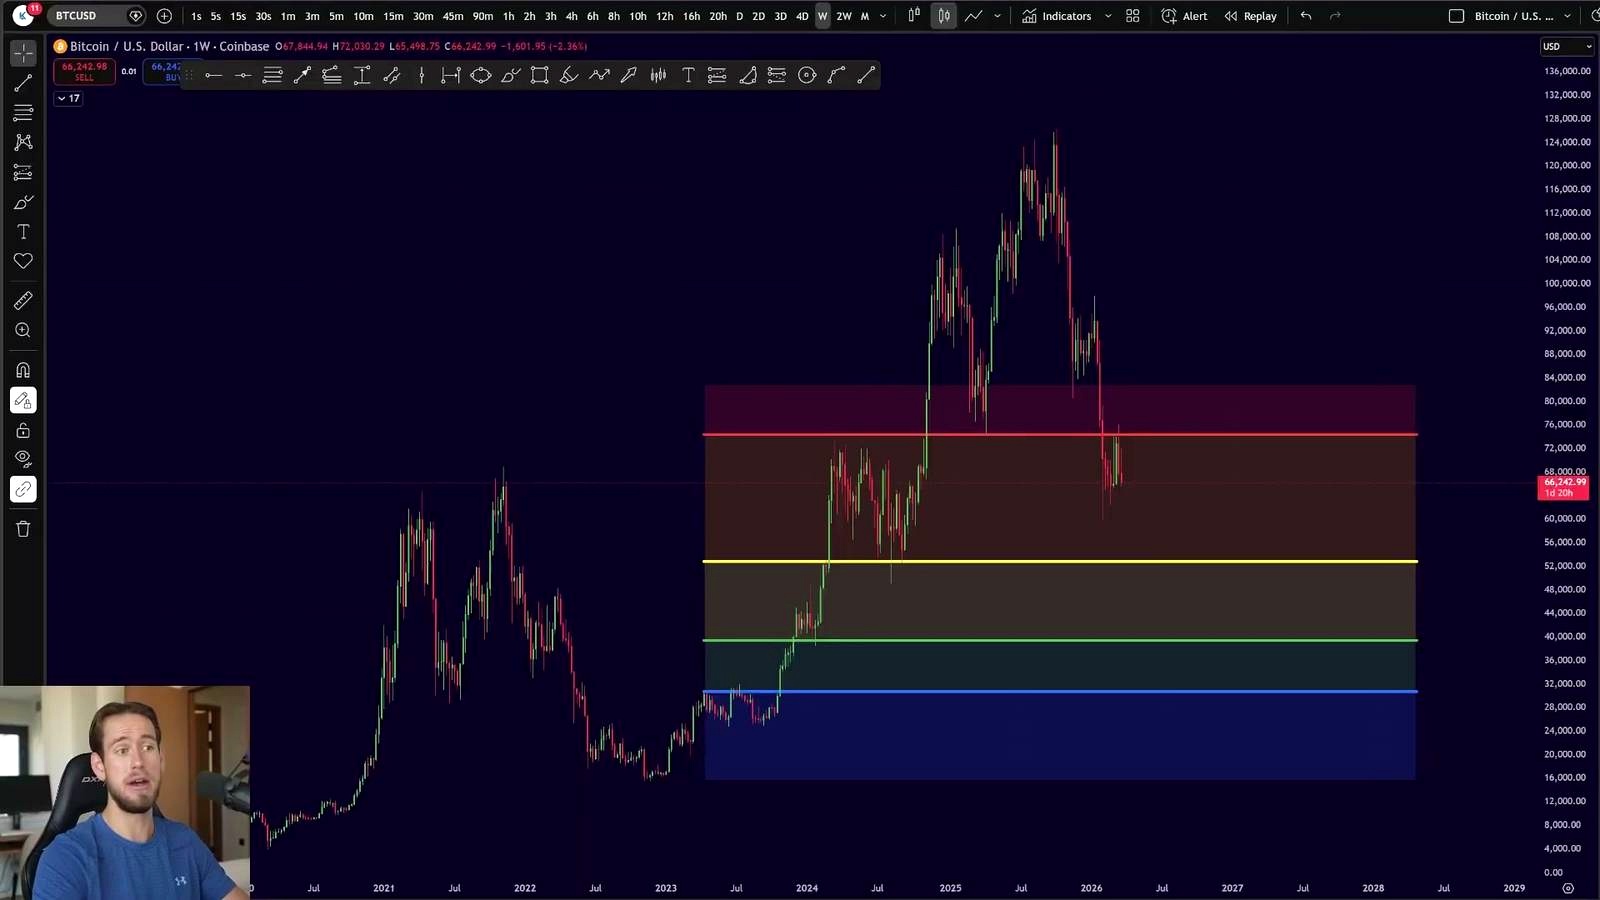
The level drawing attention: $63,000
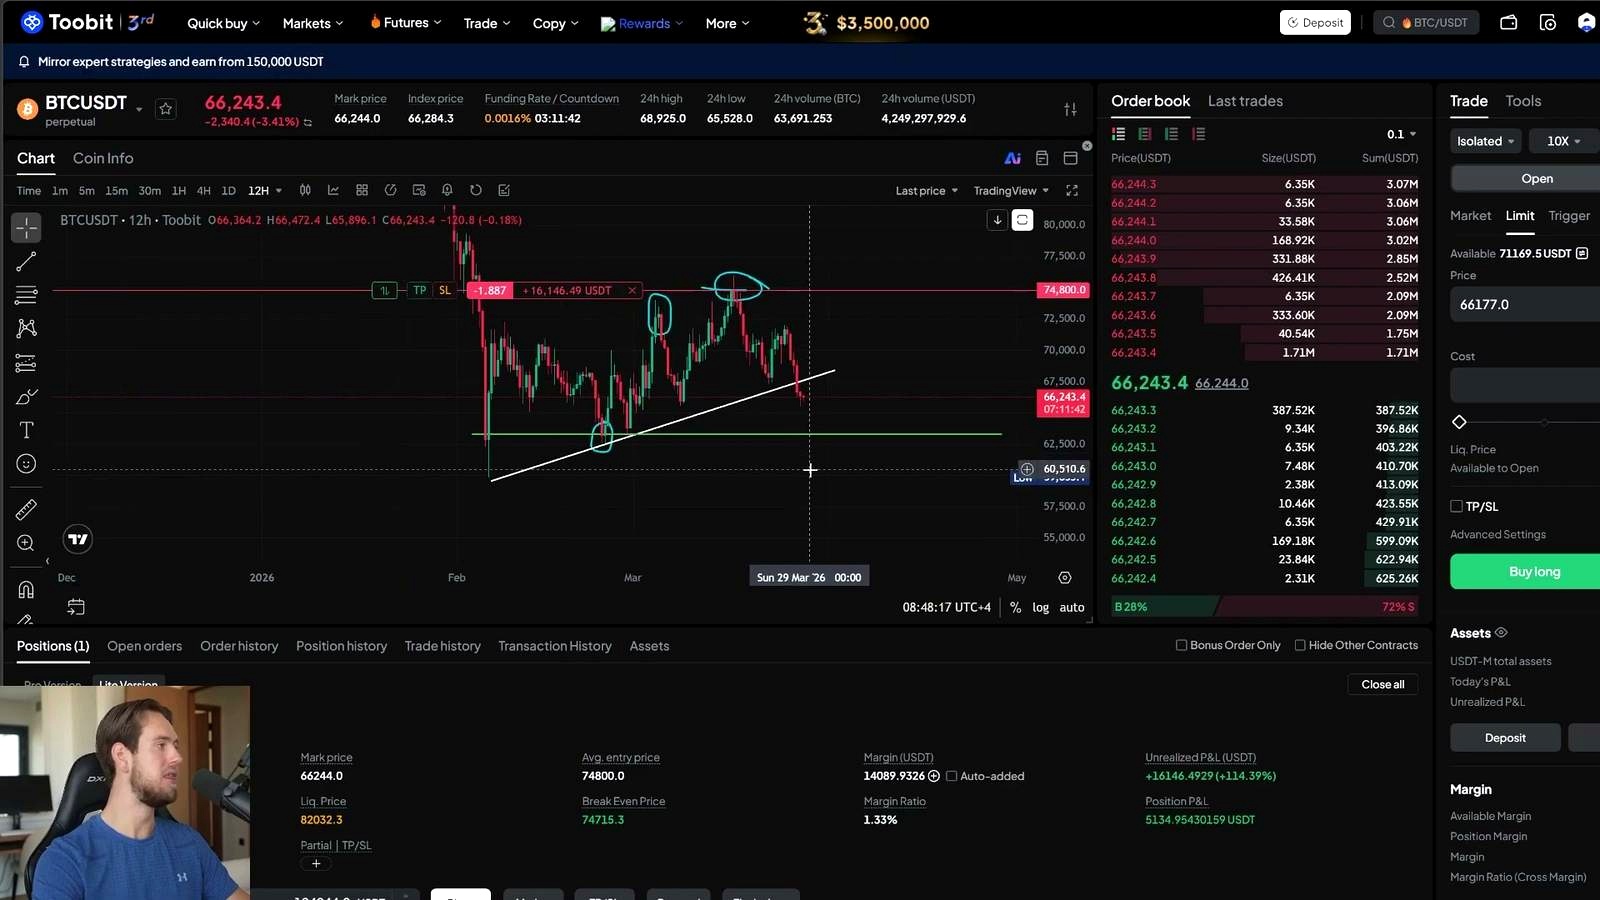
One area stands out above the rest. Bitcoin is described as forming a sideways consolidation range, and the bottom of that range sits near $63,000.
If price returns to that level, the plan is to take more aggressive profits on the existing Bitcoin short position. That makes $63,000 a major area to watch in the near term.
The two-scenario setup
The trading plan is framed as unusually straightforward, with only two main scenarios in focus:
- Scenario one: Bitcoin reaches back to the $63,000 area, where more profits are taken from the short
- Scenario two: The current breakdown turns out to be a trap, price pushes back up and breaks the highs, and the short position is increased
That is the core game plan right now. Either weakness continues into that lower range level, or the market squeezes back upward and forces a different response.
Recent trading backdrop behind the current view
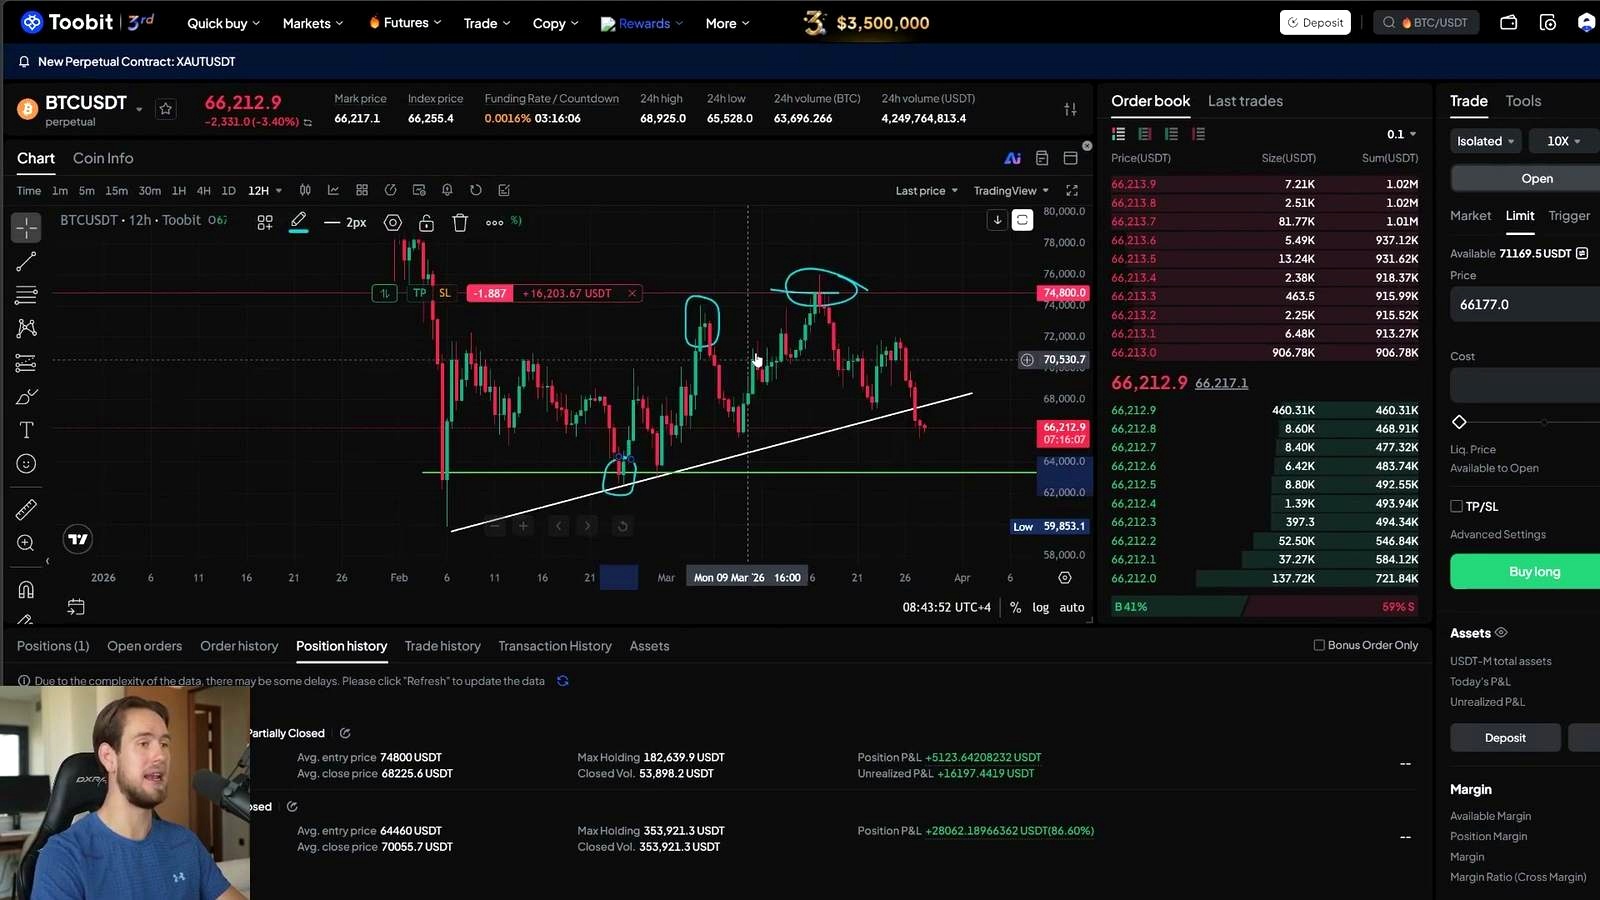
The outlook comes after a stretch of active trading. Since the beginning of March, the tone had been optimistic and bullish. A long position was taken near the 63k area and exited near the 70k region, with a stated profit of 28k.
After that, the approach shifted. A short position was opened from the peak, and with Bitcoin breaking down, that short is said to be in profit as well.
This shift from bullish to bearish is important. It reflects a market that may have changed character, at least in the medium-term view.
Why the stock market may be driving this move
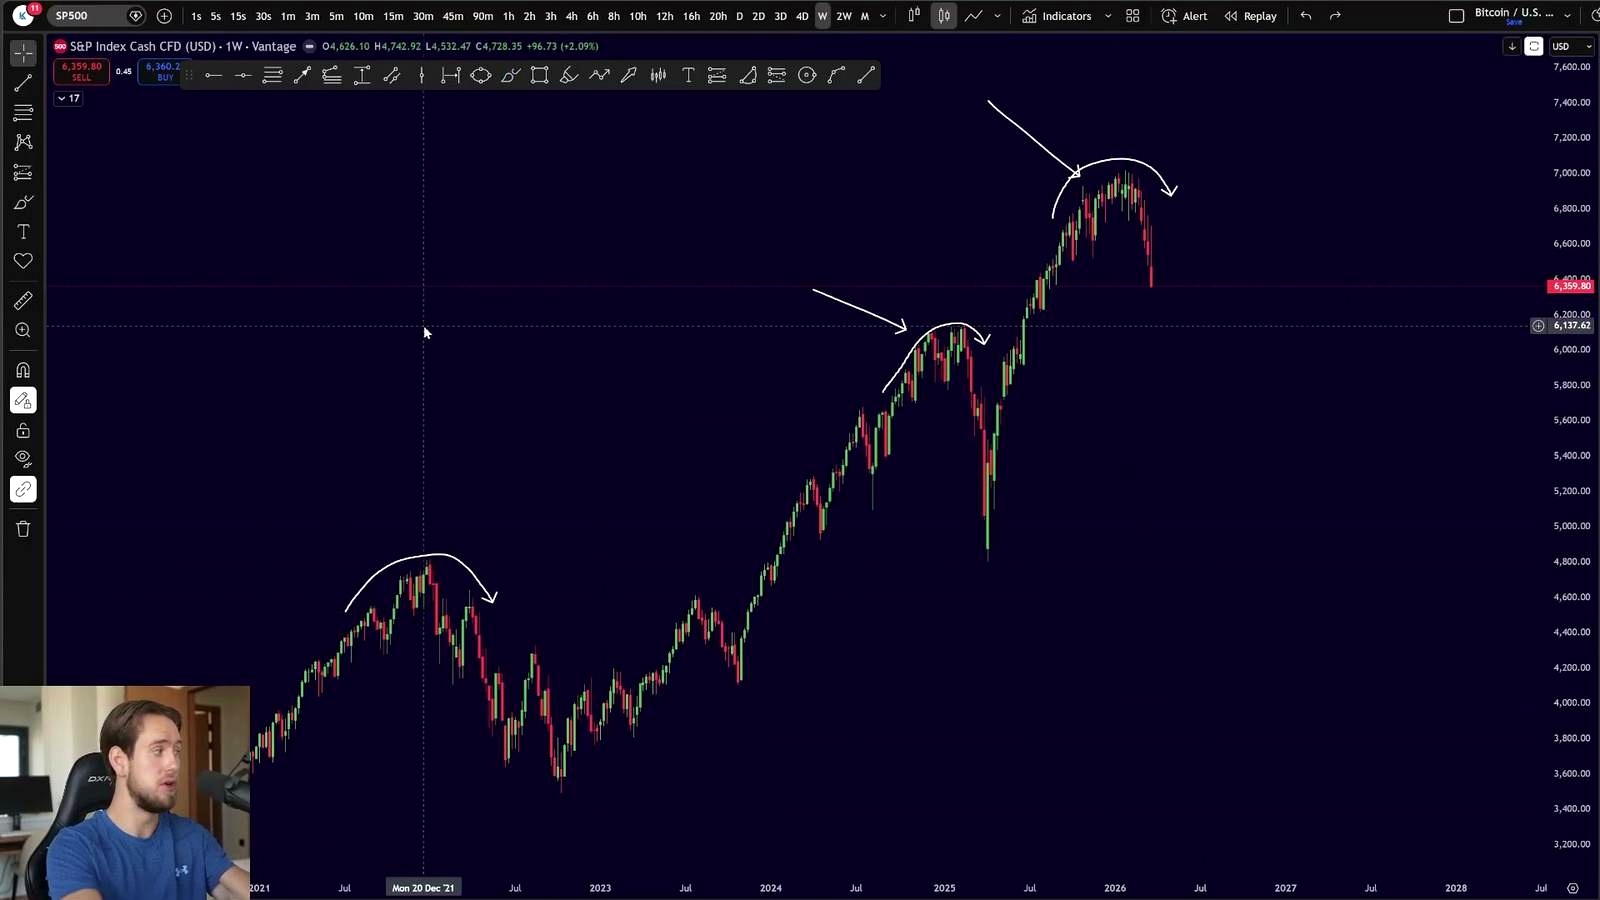
The main explanation offered for Bitcoin’s breakdown is not internal weakness in Bitcoin alone. Instead, the stock market appears to be the trigger.
According to this view, stocks printed a huge red candle to the downside and showed a rounding top, both pointing to weakness. As the stock market continued lower, Bitcoin followed.
- The stock market saw a major hit to the downside
- Signs of weakness were already appearing
- Bitcoin then broke below its uptrending support
That connection leaves room for a surprise. If the move in Bitcoin was driven more by stock-market pressure than by crypto-specific weakness, the breakdown could still prove to be a trap before the next bigger move forms.
The macro backdrop looks dangerous, but not apocalyptic
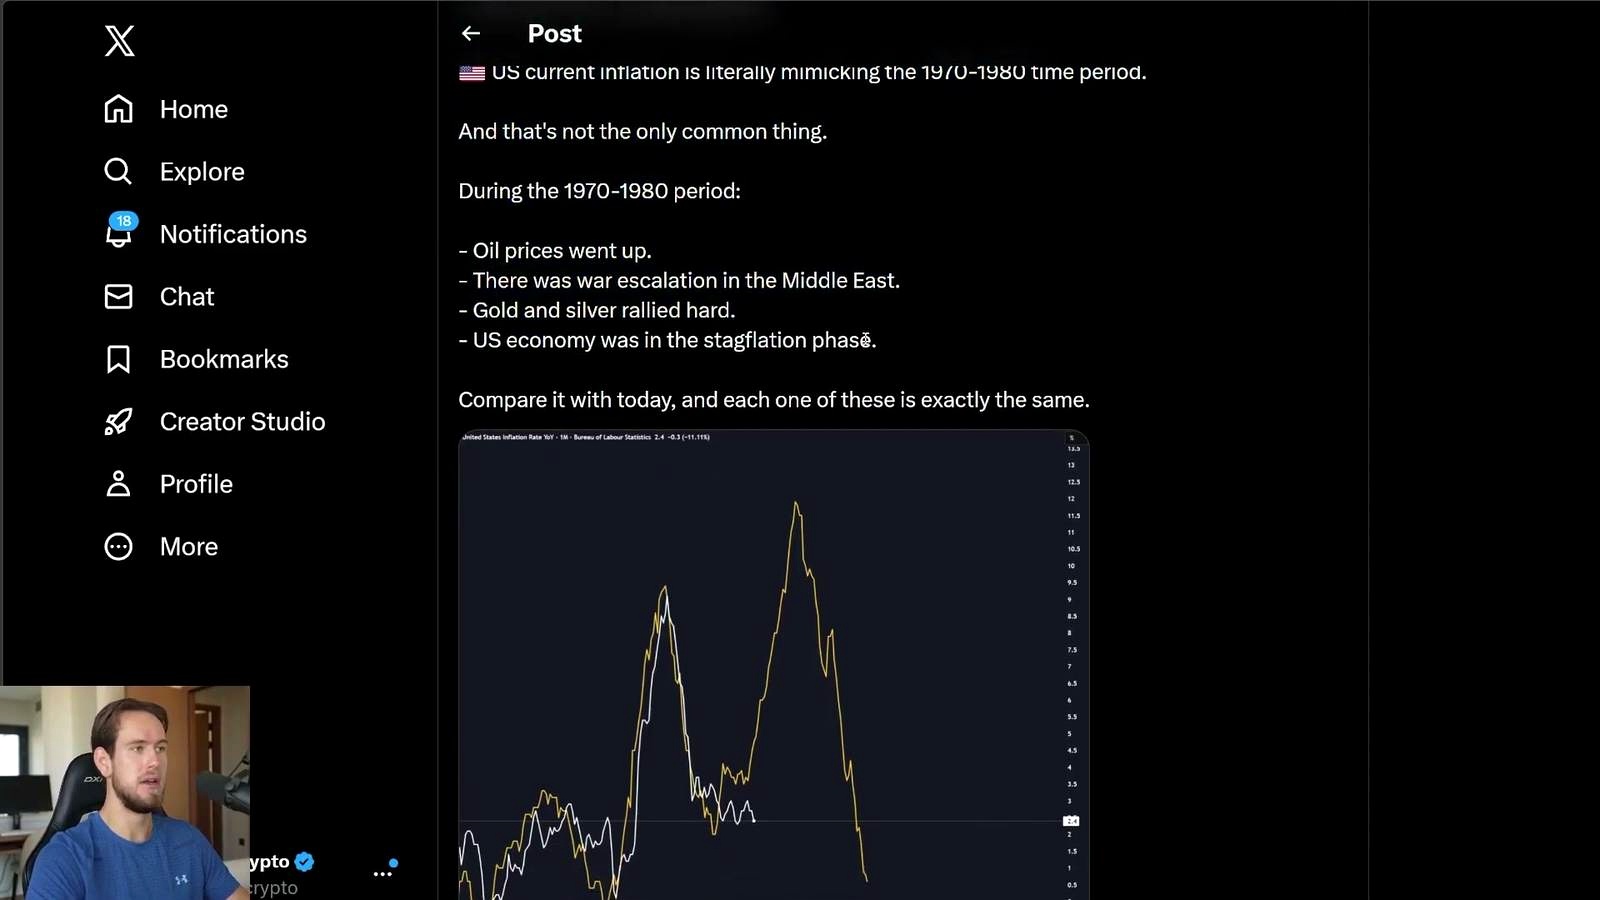
The longer-term picture is where the tone gets more serious. The macro concern centers on CPI and US inflation appearing to mimic the 1970s and 1980s period.
That comparison is presented as a warning sign. It raises the possibility that the economy could be moving toward recessionary conditions.
Recession fears are growing
The view here is that recession risks have been building for some time. Recessionary rate cuts were flagged months ago, and now the situation is starting to look more aligned with that concern.
Still, the message is not outright panic.
- A recession could be forming
- The setup should be monitored closely
- This is not being framed as an end-of-the-world scenario
In other words, the environment may be getting worse, but it is not necessarily a replay of the most extreme historical outcomes.
Short term versus medium term
The article’s market view splits into two time frames, and that split matters.
Short-term view
In the short term, there is still room for Bitcoin to push back up. A recovery to grab the highs remains possible, especially if this breakdown proves to be a trap.
Medium-term view
In the medium time frame, the outlook is more clearly bearish. The weekly trend is expected to continue to the downside, with Bitcoin potentially breaking lower still.
The reasoning is direct:
- The weekly trend remains down
- Bitcoin is still viewed as being in a bear market
- No clear bottoming signal has appeared yet
That is why the short position was opened from an area seen as previous support turning into resistance.
No bottoming signal yet, but long-term accumulation continues
Even with the bearish medium-term outlook, the long-term approach is different. Bitcoin is still being accumulated through dollar-cost averaging.
The logic is that waiting for a perfect bottom often leaves people with no entry at all. By contrast, steady accumulation may produce a solid average entry over time.
The case for dollar-cost averaging
- Trying to find the perfect entry often leads to missed opportunities
- Time in the market is seen as stronger than timing the market
- Bitcoin is described as historically trading quite cheap
That creates an interesting split in the overall stance: bearish on the medium-term trend, but still accumulating for the long run.
What happens next for Bitcoin?
The next move may decide whether this breakdown becomes a bigger trend continuation or just a painful fakeout before another swing higher.
For now, the focus is narrow and intense:
- Watch whether Bitcoin moves back toward $63,000
- Watch whether the stock market continues showing weakness
- Watch whether Bitcoin reclaims strength and pushes back toward the highs
This is one of those moments where the market feels fragile. The levels are clear, the macro pressure is real, and the next move could shape sentiment fast.
FAQ
Why is Bitcoin going down right now?
The move lower is being linked mainly to stock-market weakness rather than to Bitcoin looking uniquely weak on its own. Stocks took a major hit, and Bitcoin followed with a break below uptrending support.
What is the most important Bitcoin level right now?
The $63,000 area is the key level being watched. It is described as the bottom of the current consolidation range and a place where more profits may be taken on the short position.
Could this Bitcoin breakdown be a trap?
Yes. That possibility is taken seriously. The breakdown could still reverse, push back to the upside, and even break the highs before a larger downside move develops.
Is the medium-term trend still bearish?
Yes. The weekly trend is still viewed as moving to the downside, with Bitcoin still trading in what is described as a bear market and without clear bottoming signals yet.
Does this outlook mean a major economic collapse is expected?
No. The macro setup is described as dangerous and worth monitoring, with recession risks increasing, but not as a doom scenario or a repeat of the most severe historical outcomes.
What long-term strategy is being used despite the bearish outlook?
The strategy is to keep accumulating Bitcoin through dollar-cost averaging for the long term, even while expecting further downside in the medium term.
Source Video

Omar Al-Sharif lives and works in the UAE and is involved in the blockchain technology industry. He writes articles on Bitcoin and digital assets as a personal passion, explaining complex topics in simple and understandable language.


