Could Bitcoin still be heading much lower even after a sharp flush in leveraged longs? According to The Crypto Cowboy, the recent sell-off does not look like capitulation yet, and four separate chart signals point to a much deeper downside zone.
A bearish case centered on one zone: $27,000 to $31,000
According to The Crypto Cowboy, the most important takeaway is that Bitcoin’s likely macro bottom is not $50,000, but a confluence area between $27,000 and $31,000. He builds that case from several chart methods that, in his view, all converge on roughly the same destination.
The host’s framework combines liquidation data, pattern targets, channel structure, Fibonacci extensions, and fair value gaps. Rather than treating any one signal as decisive, he argues that the overlap matters most. His conclusion is that Bitcoin still appears to be in a broader bearish move, even after a day that already saw 4.1% downside, roughly $300 million in long liquidations, and a Fear and Greed Index reading of 13.
The four-chart thesis behind the deeper BTC target
1. Liquidation heat map points below current price
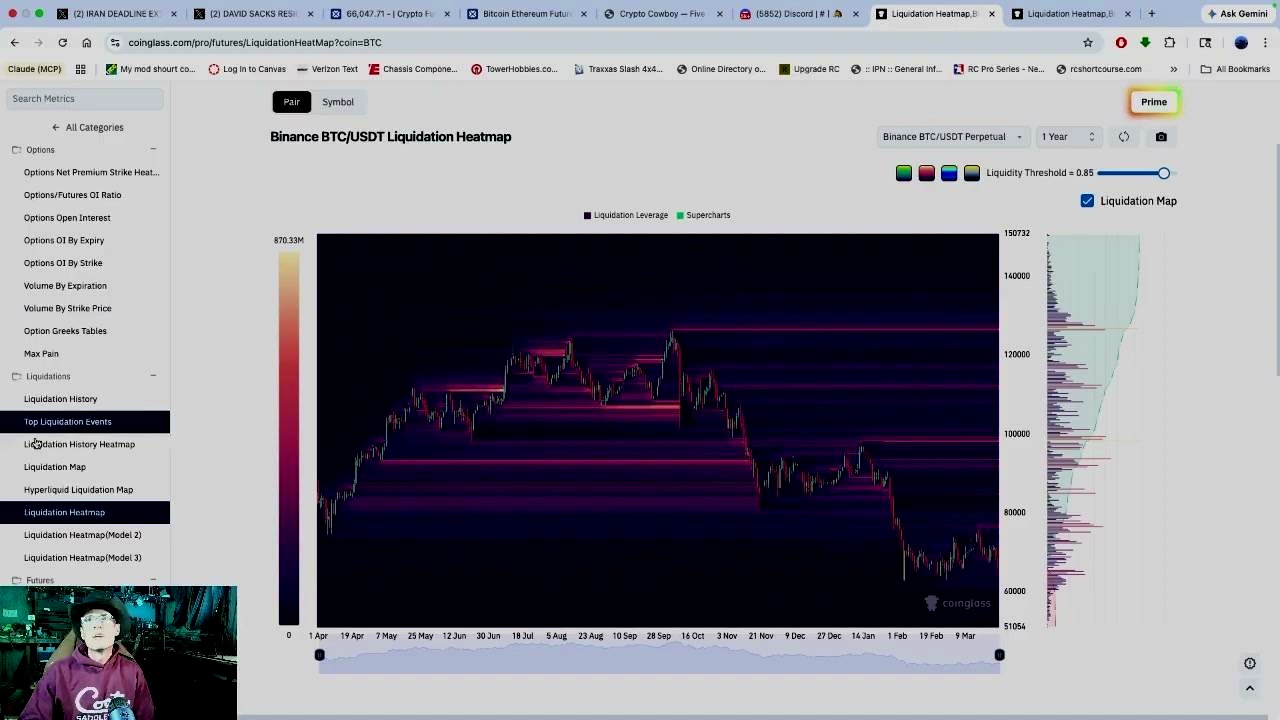
The Crypto Cowboy argues that the six-month liquidation map shows the largest cluster of long liquidations sitting below the market, around $27,000 to $31,000. In his telling, that is where market makers would have an incentive to push price if the broader bearish structure continues.
He also cited cumulative liquidation figures of $15.7 billion in short trades versus about $1.44 billion in longs, but stressed that in a bear market he does not expect that short-side liquidity to matter until Bitcoin first finds a bottom.
On the shorter-term weekly liquidation view, he said BTC could still see a bounce toward $66,000 to $67,000, or possibly $68,000, before resuming lower.
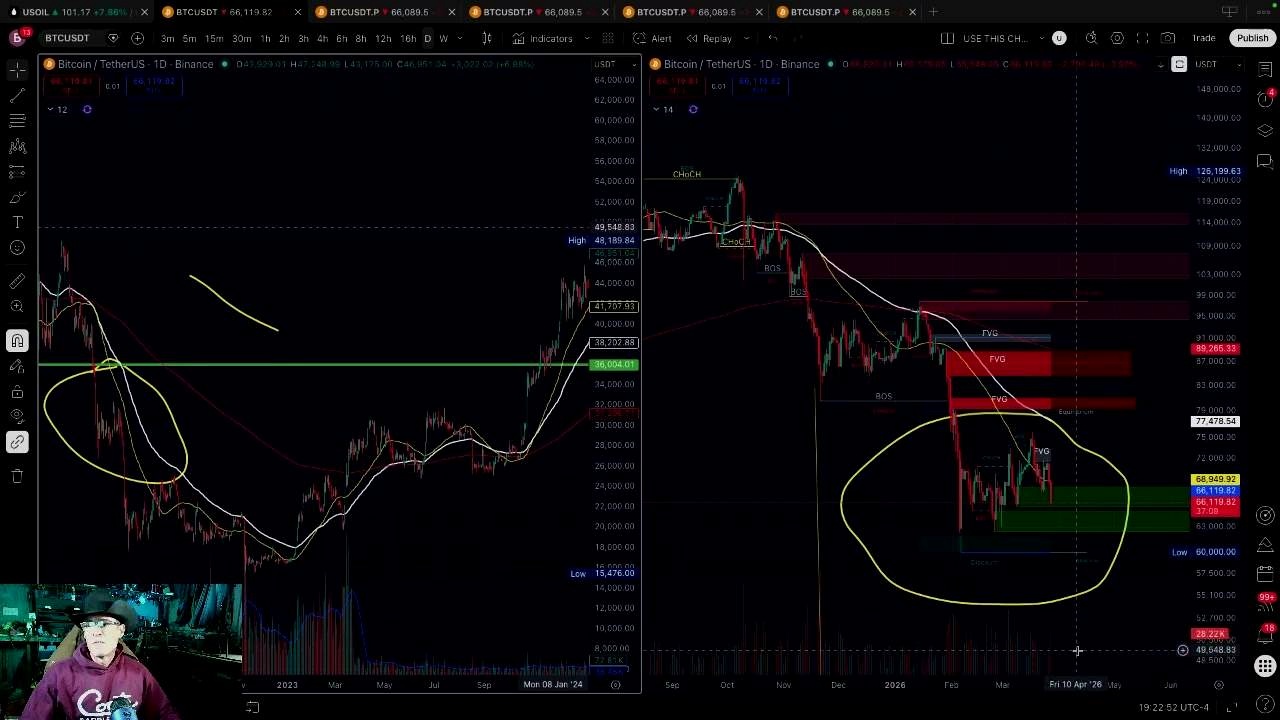
2. A macro head-and-shoulders target lands near $35,000
The analyst says the weekly chart shows a confirmed head-and-shoulders pattern, with the neckline already broken. Using the standard measured-move method, he places the pattern target at roughly $35,000. Later in the video he also references a similar target around $33,000, but his larger point is that the pattern projects significantly below current levels.
On its own, $35,000 is not his final bottom call. Instead, it serves as one piece of evidence that Bitcoin’s downside may still have room to run.
3. Channel support and Fibonacci extensions cluster around $30,000 to $31,000
The Crypto Cowboy says Bitcoin failed twice to break out of a parallel channel and then fell back inside it. Historically, he argues, that kind of failed breakout often sends price to the bottom of the channel.
In his charting, the lower boundary of that channel sits near $30,000, while a 2.618 Fibonacci extension sits around $31,000. That creates another overlap with the liquidation zone and the head-and-shoulders objective.
4. Weekly fair value gaps strengthen the same downside area
The host adds one more layer: weekly fair value gaps below price that he says market makers often revisit. He highlights one fair value gap around $45,000 as a possible first buying opportunity, but he is more focused on the lower gaps that align with the broader $27,000 to $31,000 zone.
That is why he frames the lower range as the real confluence area, not a random extreme target.
Why he does not think the bottom is in yet
The Crypto Cowboy argues that a true bottom is less about a specific price and more about behavior. His key signal is a major surge in volume, which he says marked the final phase of the 2022 bear-market bottom. In that earlier period, he says, smart money stepped in aggressively as volume spiked. By contrast, he sees current volume fading rather than expanding.
That matters because, in his view, a durable bottom should be accompanied by clear accumulation. Without that volume signature, he believes the market is still vulnerable to another leg down.
He also compares the current structure with the prior bear market and says the two are tracking each other closely through a second consolidation phase. In his reading, that analog favors one more major decline before a bottom is formed.
The short-term trading map: bounce first, then lower?
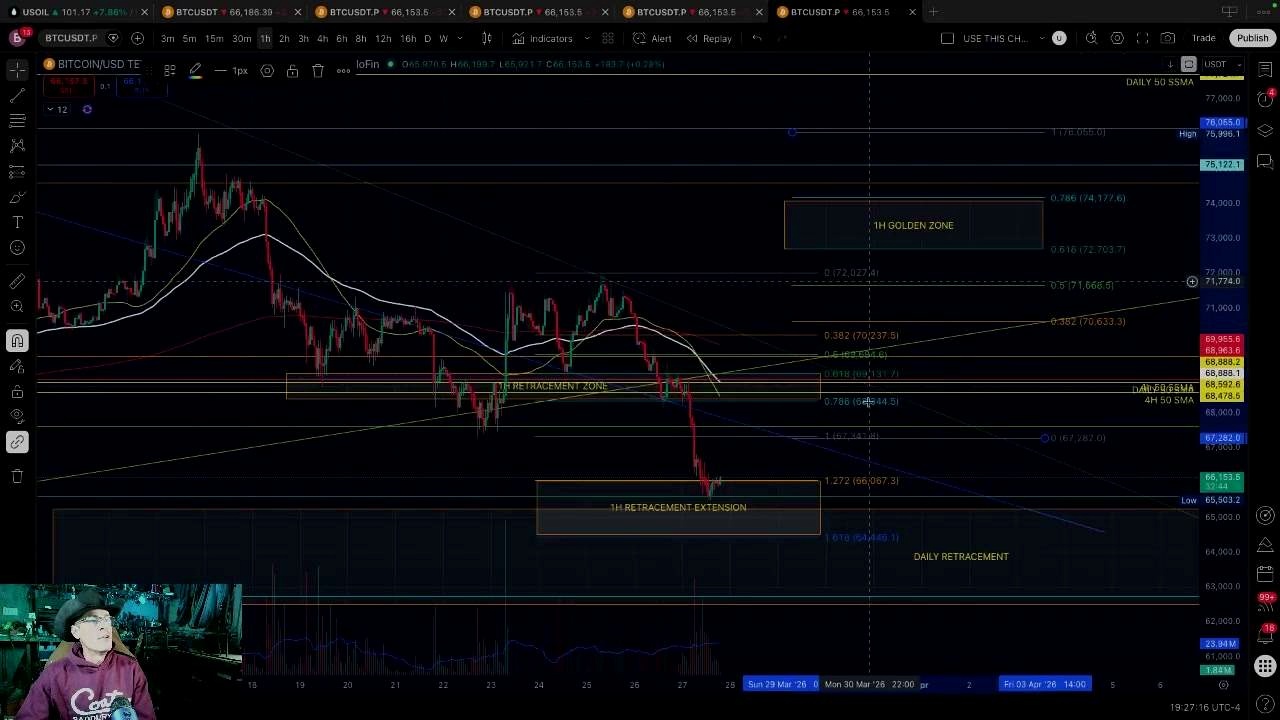
Although The Crypto Cowboy is bearish on the bigger picture, he does not rule out a near-term relief move. He says Bitcoin may bounce back into $68,000 to $69,000 on a low-volume weekend and potentially retest resistance before rolling over again.
He also outlines a broader retracement area of $62,000 to $65,000, with a possible path through $54,000 to $48,000 before a larger continuation lower. On the 4-hour chart, he places the extension zone at $58,000 to $53,000.
For his own position, he said he entered a short around $68,700. He listed profit levels at $67,752 for take-profit one, $65,300 for take-profit two, and around $60,762 for take-profit three, while leaving a runner aimed at the wider $27,000 to $31,000 confluence zone.
The “five-gate” setup behind his bearish trade
The host says he only enters a trade when all five parts of his system line up. The first gate is directional bias: below the daily 50 simple moving average, he is bearish; above it, bullish. From there, he looks for Fibonacci confluence at key levels such as 0.382, 0.618, and 0.786, combined with the 4-hour 50 moving average and a nearby point of interest.
On execution, he waits for a closed 1-hour candle showing rejection or an engulfing pattern, rather than entering mid-candle. For risk, he caps exposure at a maximum of 2% of account size per trade and requires at least a 2:1 risk-reward ratio. He said all five gates opened together at 7:00 p.m. before he took the short.
He also said the stop was moved to break-even after the first target was hit, turning the position into what he described as a “free trade.”
Macro pressures he says are adding to the risk-off backdrop

Beyond chart structure, The Crypto Cowboy points to a broader macro environment that he sees as unfriendly for Bitcoin. He mentions Treasury yields hitting a one-year high, an ongoing Iran war, and no movement on the Clarity Act. He also says White House “crypto czar” David Sachs resigned that day.
He pairs that risk-off backdrop with strength in oil. In his view, Bitcoin falling while oil rises is part of the same larger message from markets.
Oil is part of his warning signal too
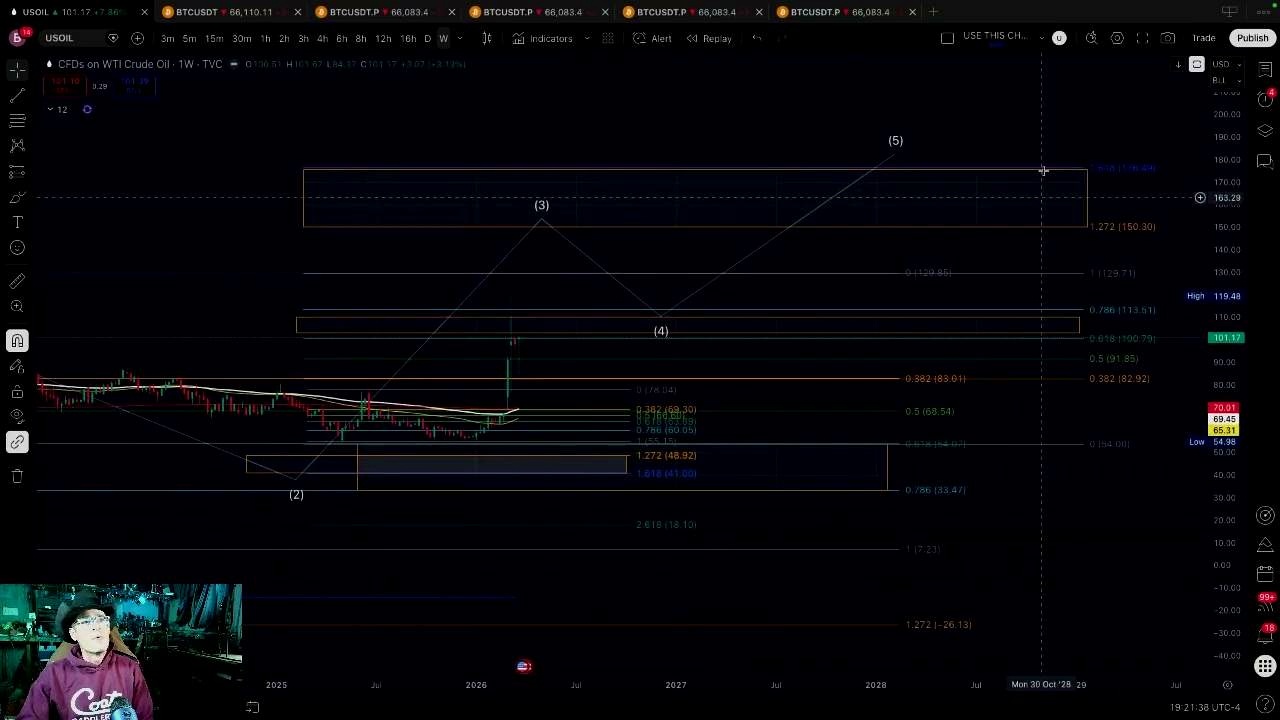
The analyst’s BTC thesis is reinforced by a bullish oil outlook. He says oil bounced near 87.3 to 88.23 a barrel and is now targeting a “golden zone” of $103 to $110. Above that, he points to a wick up to $119, then an extension area of $131 to $146.
His broader oil roadmap stretches even higher. He cites a daily outlier near $188, a weekly extension range of $150 to $176, and a weekly outlier around $252 a barrel, though he stops short of endorsing the highest target. His stated base expectation is at least $150 to $176.
For Bitcoin traders, the practical point is not the oil chart by itself. It is that the host sees rising energy prices and a deteriorating macro backdrop as consistent with further pressure on risk assets.
What to watch next for Bitcoin
The next signal, in The Crypto Cowboy’s framework, is not just price. It is whether Bitcoin gets a weak weekend bounce into resistance and then rejects, and whether a genuine volume spike appears on a deeper sell-off. If BTC pushes into $68,000 to $69,000 and stalls, that would fit his bearish continuation setup. If price instead collapses toward the lower confluence area and volume surges, he says that would be the first sign the market may finally be near a real bottom.
Until then, he remains focused on the same destination: a zone well below $50,000, centered on $27,000 to $31,000.
FAQ
What exact Bitcoin levels did The Crypto Cowboy highlight?
He referenced $75,000 as a missed upside “max pain” area, $68,000 to $69,000 for a possible near-term retest, $62,000 to $65,000 as a retracement zone, $58,000 to $53,000 on a 4-hour extension, $54,000 to $48,000 as a lower working range, $45,000 as a weekly fair value gap, $35,000 and $33,000 from head-and-shoulders projections, and the main bottom zone at $27,000 to $31,000.
Why doesn’t he consider $45,000 the final bottom?
Because he treats $45,000 as an initial fair value gap and possible buying area, not the strongest confluence. His stronger case comes from multiple indicators clustering lower, especially the liquidation map, channel bottom, and Fibonacci extension near $27,000 to $31,000.
What would make him think Bitcoin is finally bottoming?
A large volume spike. He says that in the previous bear market, heavy volume marked the point where larger buyers stepped in. Without that, he sees current weakness as unfinished rather than exhausted.
How aggressive is his risk management?
He says he risks no more than 2% of account size per trade, requires at least a 2:1 risk-reward setup, and wants liquidation to sit outside the stop-loss. After the first profit target, he moved his stop to break-even.
Did he give a precise time trigger for his trade setup?
Yes. He said all five conditions in his system aligned at 7:00 p.m., which is when he took the short around $68,700.
Source

Omar Al-Sharif lives and works in the UAE and is involved in the blockchain technology industry. He writes articles on Bitcoin and digital assets as a personal passion, explaining complex topics in simple and understandable language.


