Could Bitcoin’s next bounce be the move that pulls traders in just before another leg down? That is the core warning coming from Crypto Anup, who argues that recent price action looks weak even if BTC manages a short-term recovery.
The main call: a bounce may come first, but the analyst still sees lower prices
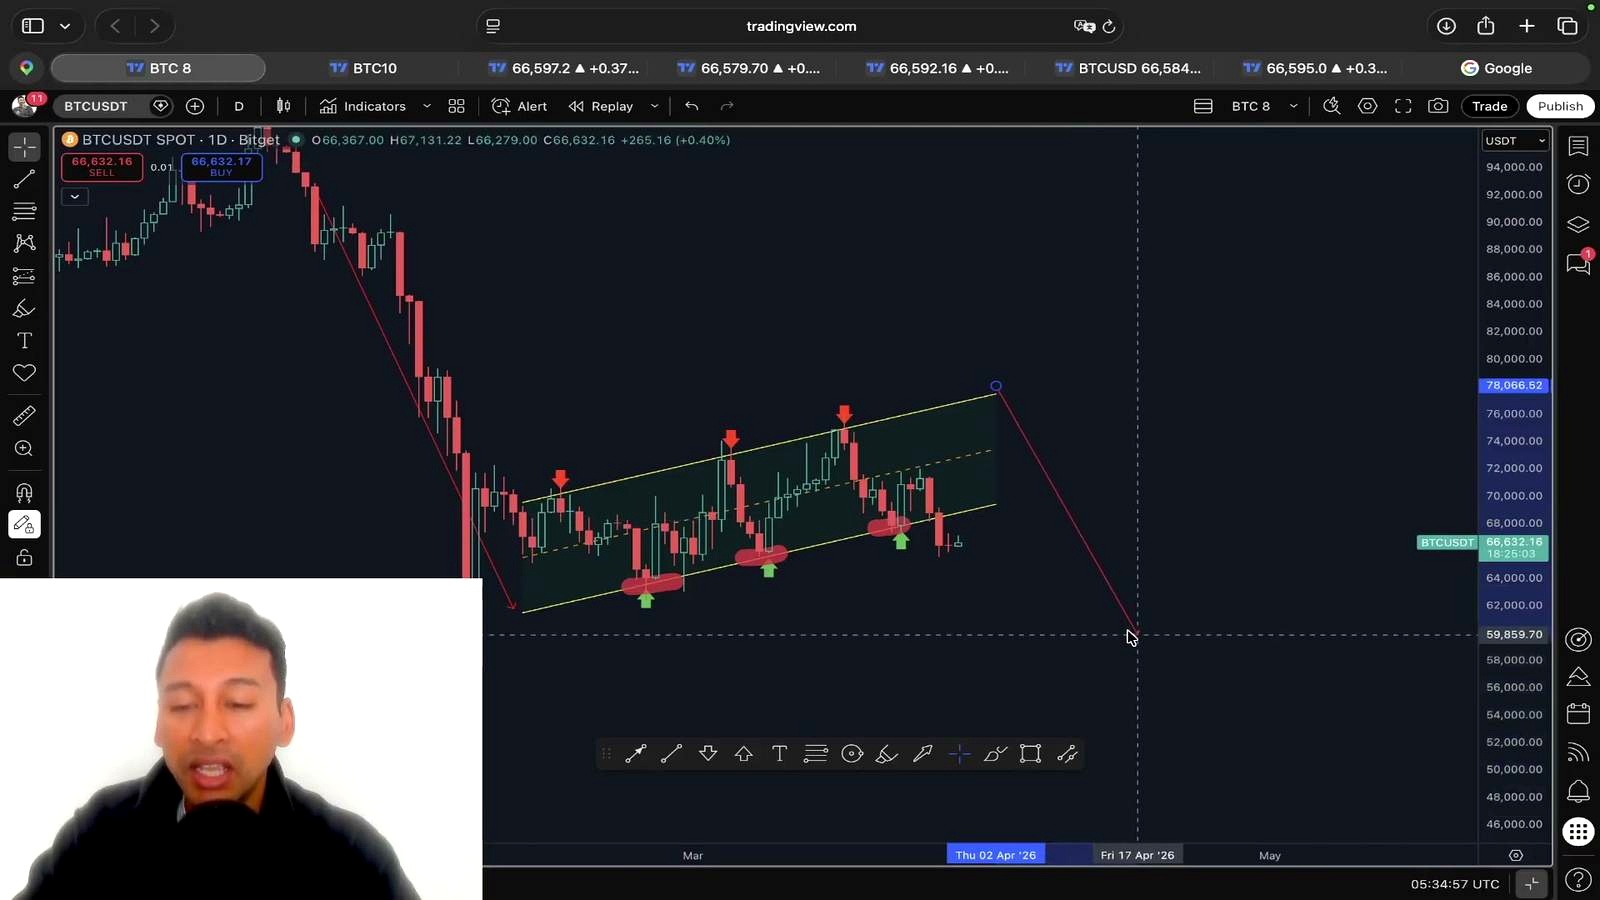
According to Crypto Anup, Bitcoin has already broken below a key lower trend line in a rising channel on the daily chart, and that breakdown shifts the near-term structure bearish. His central argument is not that BTC must fall in a straight line, but that any short-term upside could be a relief rally rather than the start of a durable reversal.
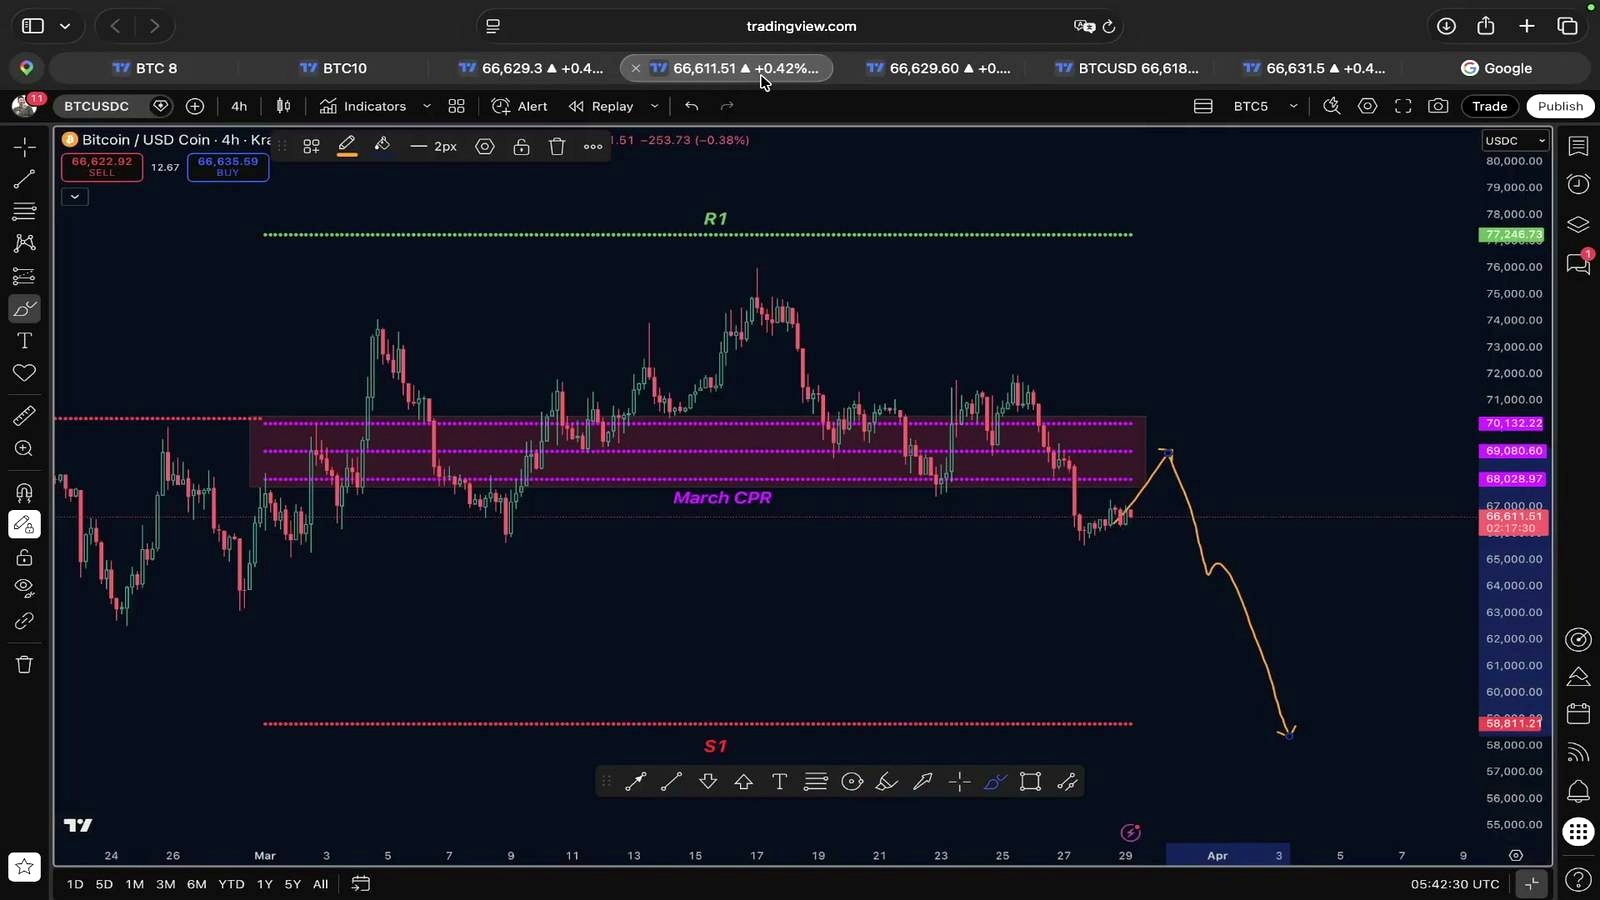
The host says traders should be careful not to mistake a rebound for renewed strength. In his view, a move back up could simply retest prior support levels that have now flipped into resistance. If that happens, he expects Bitcoin to resume moving lower toward what he describes as the next major confluence zone.
That zone is $50,000 to $60,000. Crypto Anup frames that range as the area where Bitcoin could finally find a bottom before attempting a new bullish continuation.
Why he thinks a short-term BTC rally could be a bull trap
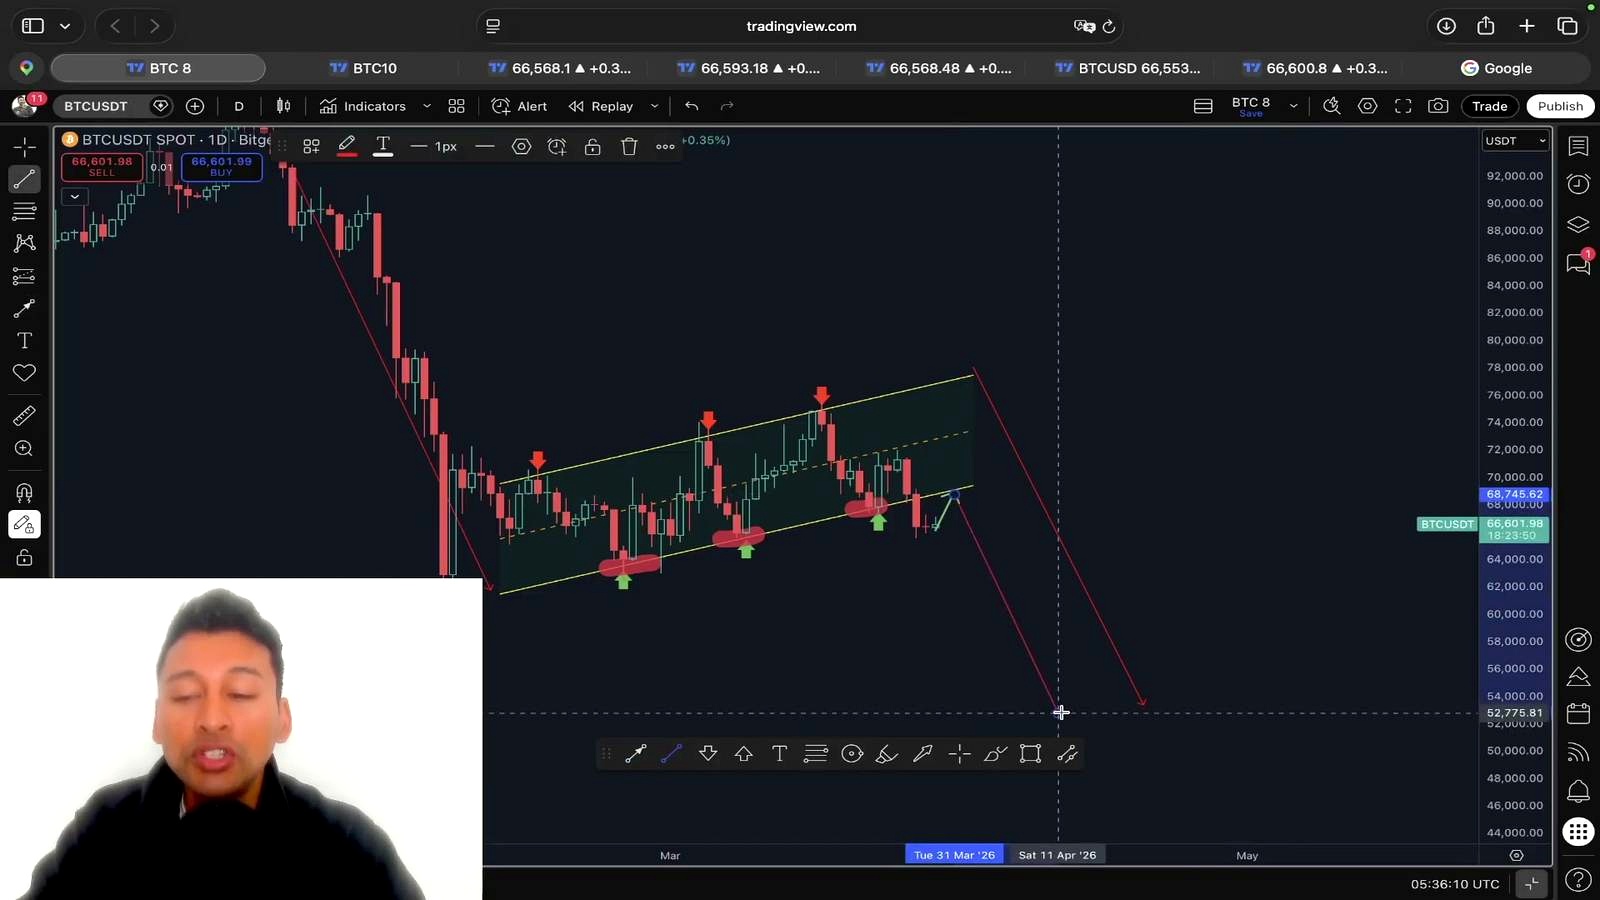
Crypto Anup’s warning is built on several technical signals pointing in the same direction. First is the breakdown from the lower boundary of the rising channel. In his read, once that support failed, the market opened the door to a fresh bearish continuation.
He then points to the idea of a retest. Former support often becomes resistance after a breakdown, and he believes Bitcoin may be setting up for exactly that pattern. A short-lived rally into that area would, in his interpretation, fit a classic bull-trap structure: price appears to recover, meets resistance, and then turns lower again.
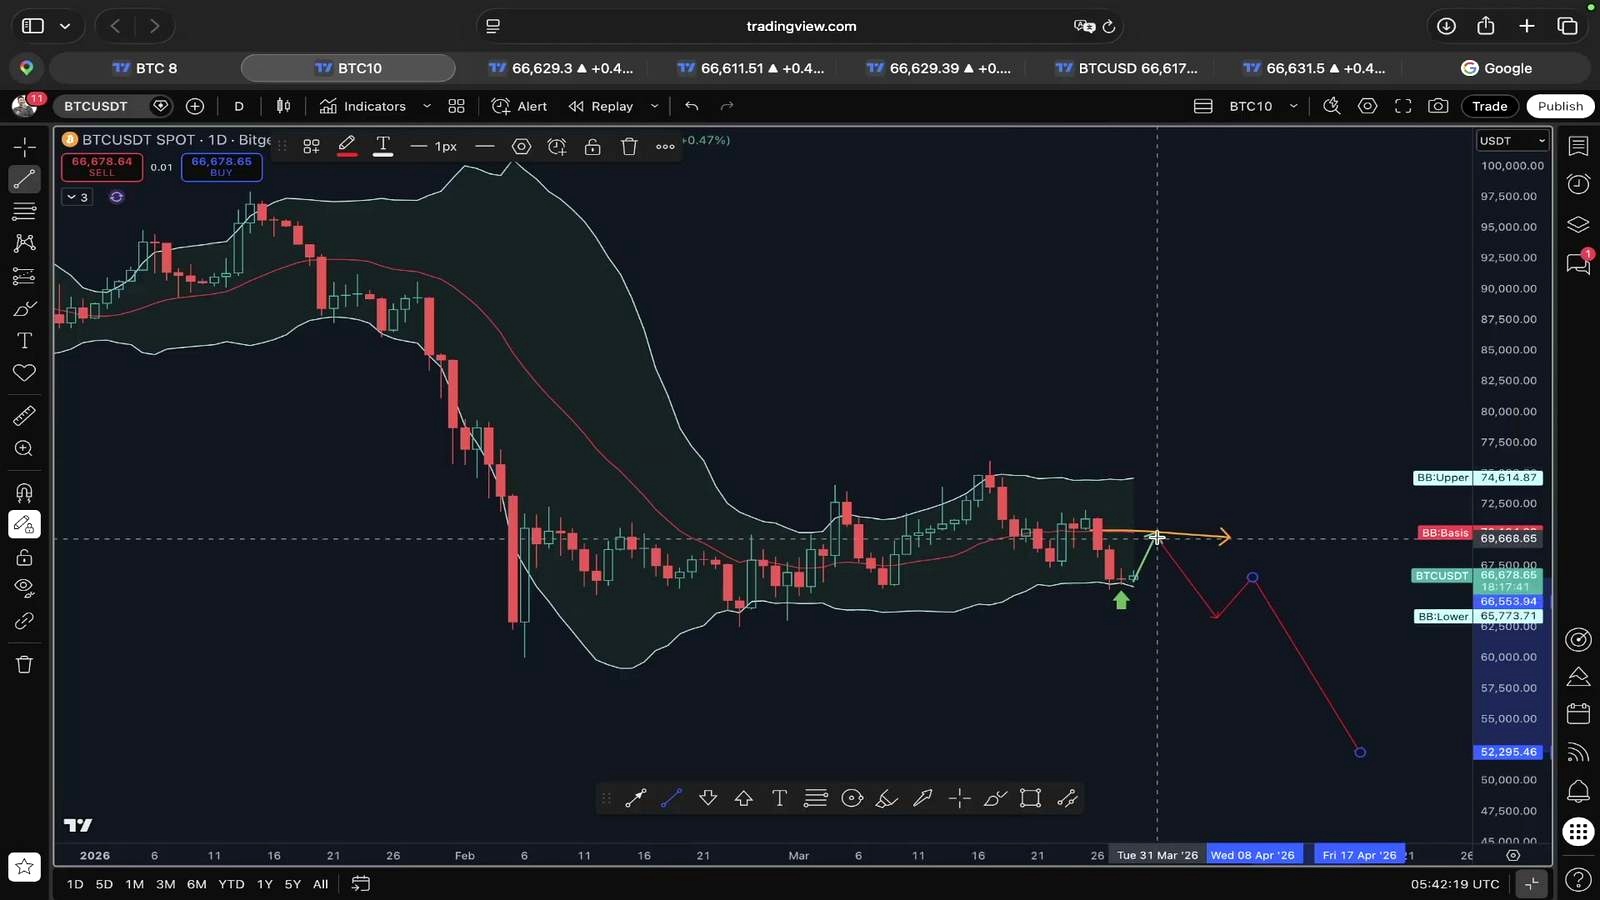
The analyst also cites a Bollinger Band squeeze. He says the squeeze signals incoming volatility, while the recent test of the lower band suggests to him that price is preparing for a downtrend. If BTC does rally from here, he expects the center line or basis line of the Bollinger setup to act as resistance rather than support.
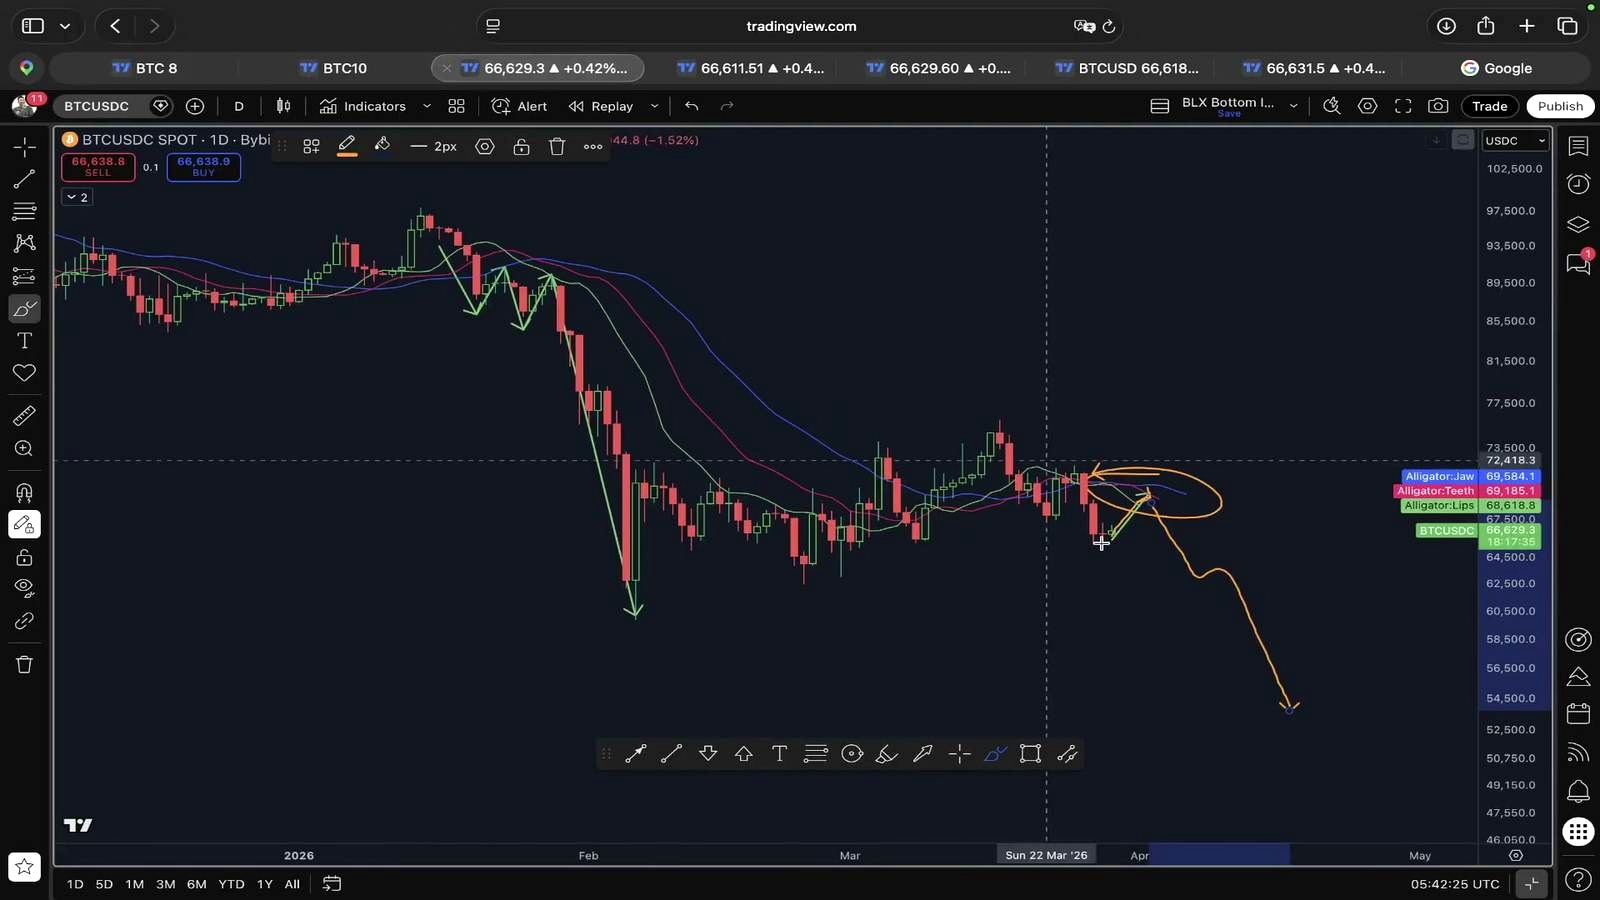
He adds one more layer with the Williams Alligator indicator. In his reading, that indicator also lines up as a resistance zone in the event of a short-term rebound. Taken together, he sees the lower trend line of the broken channel, the Bollinger basis line, and the Williams Alligator as overlapping resistance levels that could reject price.
The key level he says Bitcoin has already lost
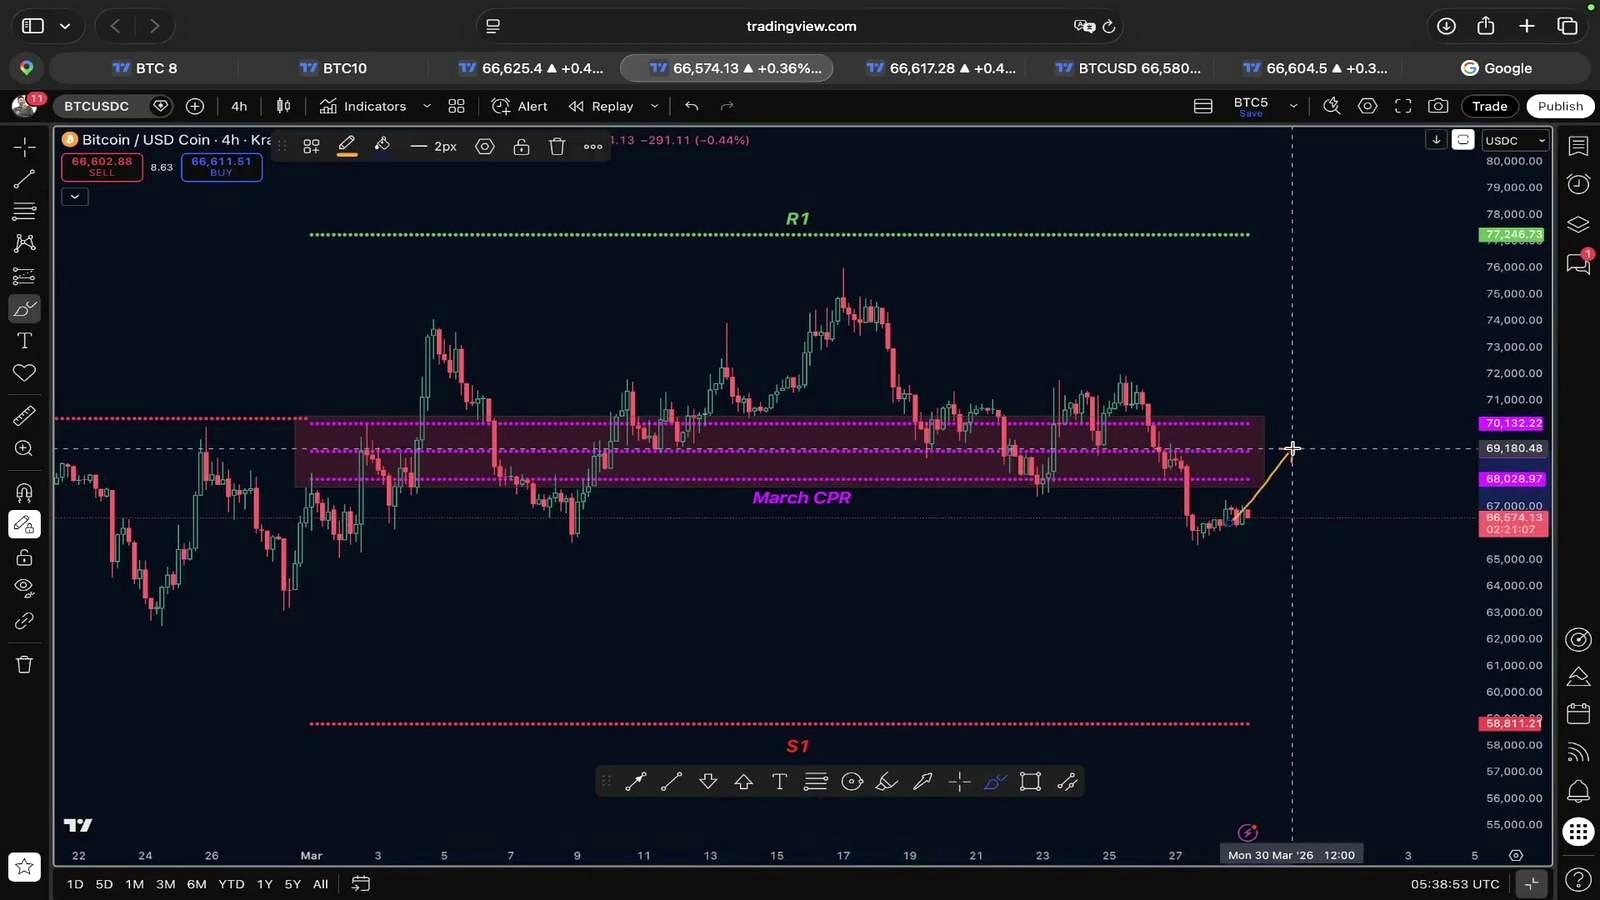
One of the clearest numerical levels in the video is $70,000. Crypto Anup says Bitcoin has “officially lost” support around that level, and he treats that break as a major change in the short-term picture.
He also refers to the loss of another trend line support, which reinforces his bearish stance for the coming days. For him, the message is straightforward: if Bitcoin cannot reclaim those broken structures, any near-term strength should be treated as suspect.
That is why his warning focuses less on immediate panic selling and more on market behavior after a bounce. The crucial signal to watch, in his framework, is whether BTC can recover above those trend lines. If it fails there, he expects the market to resume its original downward direction.
Why the $50K, $60K area matters in his framework
Crypto Anup’s downside zone is not arbitrary. He links $50,000 to $60,000 to the 200-week moving average on the weekly chart, which he describes as a historically important support area for Bitcoin.
He says that, looking back to 2015, Bitcoin has been drawn toward the 200-week moving average and that in more than 90% of cases this area has marked a bottom. On that basis, he argues that a drop into the $50,000,$60,000 zone could create a strong buying opportunity rather than signal the end of the broader bullish structure.
That distinction matters. The analyst is bearish in the medium short term, but not outright bearish on Bitcoin’s larger trend. His scenario is a capitulation first, then a recovery. In other words, he sees the pain phase and the opportunity phase potentially arriving in the same price region.
The historical comparison behind the capitulation call
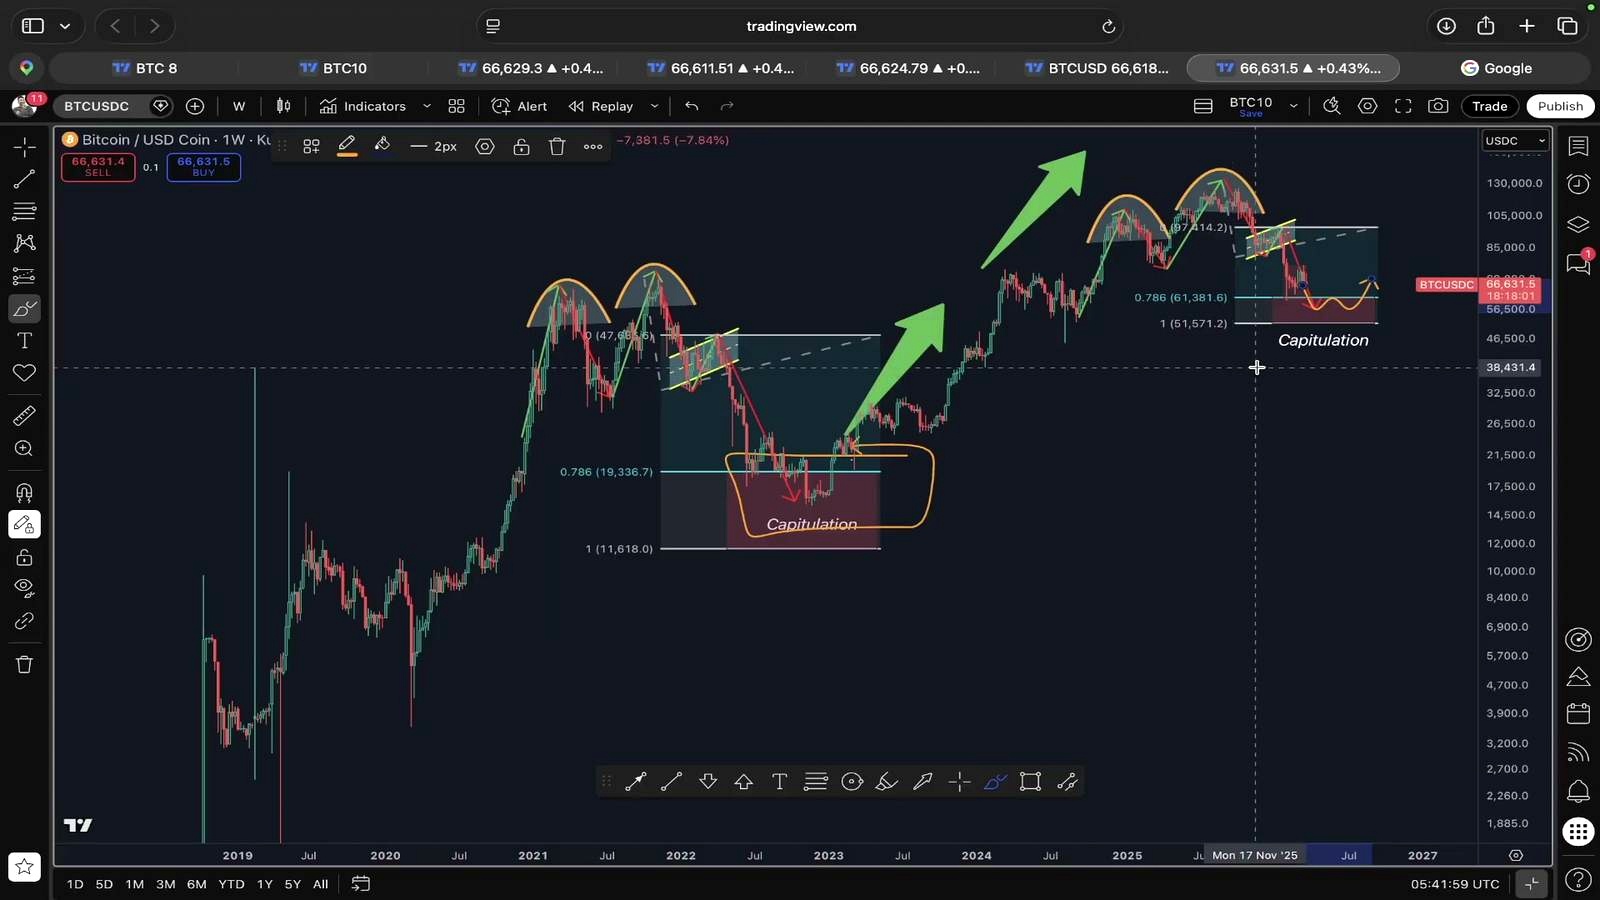
Crypto Anup also references a fractal from 2022,2023. He says that earlier setup ended with a proper capitulation before Bitcoin began a new bullish continuation. He believes current conditions could produce a similar pattern if BTC continues lower into the weekly support area he highlighted.
In that scenario, the move into $50,000 to $60,000 would not just be another dip. He describes it as a possible capitulation zone, after which Bitcoin could slowly regain momentum and begin another leg higher.
That makes his thesis two-sided but sequential. First, he expects weakness and a possible trap rally. Second, he expects a bottoming process near long-term support. The order is what matters: he is warning that bullish traders may be too early if they chase a bounce before the capitulation phase has played out.
Concrete levels and signals from the video
- $70,000: level Crypto Anup says Bitcoin has lost as key support
- $50,000 to $60,000: projected bottoming and capitulation zone
- 200-week moving average: major weekly support referenced in the analysis
- 2015: starting point for the historical comparison with prior bottoms
- More than 90%: frequency the host says the 200-week moving average has marked a bottom
- 2022,2023: period used for the fractal comparison
What to watch next for BTC
The immediate issue is not whether Bitcoin can bounce. Crypto Anup’s warning is that a bounce alone would prove very little. The more important test is whether BTC can reclaim the broken trend lines and hold above them.
If price rallies but stalls at former support-turned-resistance, his trap scenario stays intact. If Bitcoin instead pushes back above those levels and sustains that recovery, the bearish continuation he outlined would be under pressure.
For now, the analyst’s roadmap is clear: watch for a relief rally, treat it cautiously, and monitor whether Bitcoin heads toward the $50,000,$60,000 area tied to the 200-week moving average. In his view, that is the zone where a real bottom may become more likely.
FAQ
What is the “trap” Crypto Anup is warning about?
He is referring to a short-term BTC rebound that looks bullish but fails at resistance and reverses lower. In his framework, that kind of move could lure traders into buying too early.
Did Crypto Anup give an upside target for Bitcoin?
No specific upside target was given. The video focused on resistance, downside risk, and a potential bottoming zone rather than a defined bullish price objective.
Why is the 200-week moving average so important in this analysis?
Crypto Anup says Bitcoin has historically gravitated toward that level during major pullbacks and that it has marked bottoms in more than 90% of cases since 2015. That is why he treats it as a possible reset zone rather than just another support line.
Is the analyst bearish on Bitcoin overall?
Not in a long-term sense based on this video. He argues for near-term downside first, then a bottoming process and a possible bullish continuation afterward.
What would weaken this bearish setup?
A convincing recovery above the broken trend lines and resistance areas would challenge the trap thesis. The video’s bearish case depends on those levels continuing to reject price.
Source Video

Omar Al-Sharif lives and works in the UAE and is involved in the blockchain technology industry. He writes articles on Bitcoin and digital assets as a personal passion, explaining complex topics in simple and understandable language.


