Bitcoin is pushing higher, Ethereum is starting to wake up, and the broader crypto market is showing signs of strength again. The main question now is whether the recent move from the $59,000 to $60,000 area marked the bottom, or if this is only a relief rally before downside volatility returns.
Current market signals are drawing attention across crypto. Bitcoin is holding a key structural level at $71,000, Ethereum is showing early rotation and strength, altcoins are beginning to stabilize, and macro conditions may be shifting back in crypto’s favor.
Bitcoin Price Outlook: Why $71,000 Matters

Bitcoin is showing a little sign of life, but the current market structure still calls for balance rather than extreme bullishness or bearishness. Price is trading back near the highs of the recent range, which also means it is running into resistance.
The key level being watched is $71,000. That level remains the first major line in the sand for showing strength. As long as Bitcoin holds above it, the market has a chance to continue higher over the next few weeks and months.
- Key structural support: $71,000
- Recent bottom in focus: $59,000 to $60,000
- Potential upside region: around $90,000
If Bitcoin starts losing $71,000, the outlook shifts again. But while that level remains intact, the structure still leans constructive.
Higher Highs and Higher Lows Are Developing
On more local price action, Bitcoin has been putting in more of an uptrend. The structure includes a low, a high, another low, a higher high, a higher low, and now another new higher high. Across the move, higher lows have also been forming.
That creates a modest bullish market structure near this region. Even so, resistance is still present, and a move back down for a $71,000 back test remains possible before any continuation higher.
The Bullish Shark Pattern on Bitcoin
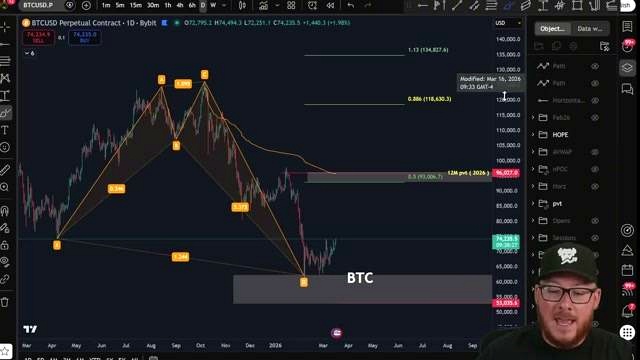
A major part of the technical case is a valid bullish harmonic pattern described as a shark. This setup completed in the recent bottom area and is viewed as a bullish pattern upon completion, similar in behavior to a falling wedge where consolidation breaks higher.
This is a bigger-picture setup that has developed over about a year, from April of last year to now. The completion zone arrived on time in terms of the ratios, and although the pattern is somewhat extended, the shark is known as the most volatile harmonic pattern and can include extreme points.
Bitcoin Target Zones From the Current Setup
The first major target from this shark pattern is the 0.5 Fibonacci retracement, which sits around $93,000. That area also aligns with other important technical levels, creating a stacked target zone.
- Target 1: about $93,000
- Broader target zone: $93,000 to $96,000
- Important yearly level: $96,000
- Secondary target if strength continues: 118
The $96,000 level is described as the biggest area for the year. Below it, Bitcoin remains technically bearish. Above it, conditions turn bullish. Until then, a push into the $93,000 to $96,000 region could still deliver a strong bullish stretch without fully changing the broader yearly picture.
What Could Happen Near $93,000
The first target is also an area where Bitcoin could face rejection. A move into the 0.5 Fibonacci level could produce what is described as a rejection at the 50 spot, followed by continuation lower.
That makes the region especially important. It offers upside potential, but also serves as a critical test for whether the rally is strong enough to change the broader trend.
Market Sentiment: Extreme Fear Still Dominates
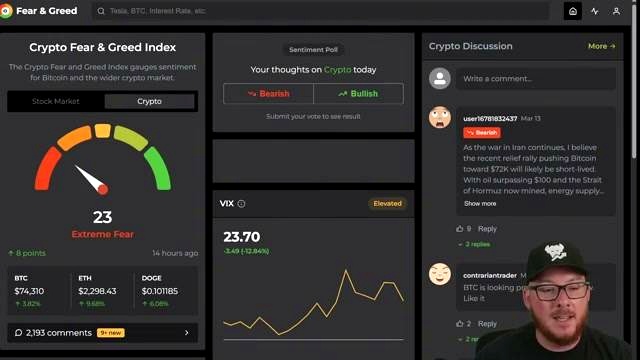
Another factor supporting the bullish case is sentiment. The fear and greed readings showed both crypto and the stock market in extreme fear. Even after the recent climb, sentiment still appears fearful.
That matters because big moves often emerge when fear is widespread. With the market still in a fearful state, a run back toward the $90,000 area on Bitcoin could surprise a lot of people.
- Crypto sentiment was in extreme fear
- Stock market sentiment was also in extreme fear
- Fearful conditions can align with large moves out of the market
Even after a sizable move higher, the current rally may still be in the early stage of a larger move.
Ethereum Technical Setup and Key Targets
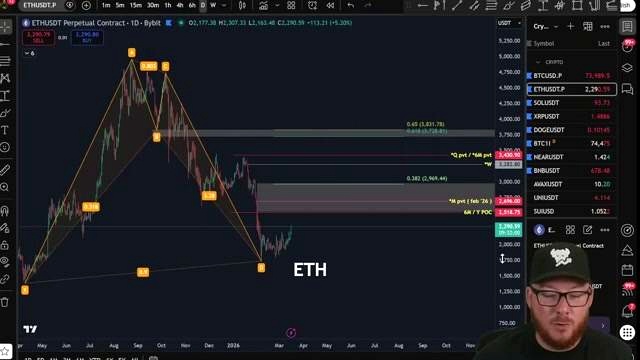
Ethereum is also showing a bullish technical setup. A valid bat harmonic pattern is in place, with targets back to $2,900 and potentially $3,800 if momentum really develops.
Like Bitcoin, the Ethereum setup is viewed from a strictly technical perspective. Ethereum has already moved sizably off the lows, so current levels are not presented as an ideal fresh entry zone. Instead, the focus is on how far the setup could carry if the broader market continues improving.
Ethereum Buy Zone and Positioning
One key rule highlighted for Ethereum is simple: under $2,000, it is considered a buy zone. That area is viewed as the major DCA zone. With Ethereum having already bounced significantly from the local lows around $1,800 and from entries around the $1,900 region, the current focus is on letting existing positions run rather than entering new ones at current levels.
- Major Ethereum buy zone: under $2,000
- Recent local lows: around $1,800
- Example entry region mentioned: around $1,900
- Current approach: ride the move rather than chase
Ethereum Resistance and Main Target Area
The first target zone for the Ethereum harmonic setup sits at $2,900. A key level around 25 is noted as an important support or resistance area to get back through, while the main target area aligns near $3,800.
The B point and the gold pocket align in that same region, making it the main destination if the setup fully unfolds. If Bitcoin continues to hold $71,000, Ethereum and the rest of the market are expected to do relatively well.
Altcoin Stabilization and Strength in TAO

Altcoins are beginning to stabilize, and TAO has been one of the bigger runners recently. A reclaim above the 2025 low at $167 set up a move toward a target zone between 286 and 319.
The move offered a clean example of what confirmation can look like: break back above a key level, hold above it, and retest support before continuing higher.
TAO Levels to Watch
- Reclaim level: $167
- Target zone: 286 to 319
- Potential higher take-profit area: up to 440
After a move of more than 100%, the current view is that TAO is not something to chase. Instead, the preference would be to look for entries lower, while those already in the move may view the current region as a take-profit zone.
Traditional Markets and Crypto Conditions
Traditional markets are also part of the backdrop. The S&P, NASDAQ, and Dow are hovering near familiar regions, with little changed over the past several months. A pullback to the 6,200 zone on the S&P is still considered possible and should not surprise anybody.
At the same time, the current slow decline may be inviting traders to short the market, which opens the possibility of a push higher first. That could mean a run to new highs before any larger pullback, or simply a continued move upward from here.
Key Traditional Market Takeaways
- S&P pullback to 6,200 is still possible
- Stock market remains in extreme fear despite being near highs
- NASDAQ is consolidating with key levels below
- Dow swept the 50,000 mark and pulled back modestly
The broader takeaway is that a bounce in traditional markets could also support the current constructive tone across crypto.
What to Watch Next in Crypto
The market is showing encouraging signals, but the setup still depends on a few important levels. Bitcoin holding $71,000 remains the most important condition. If that support stays intact, the technical setup points to higher targets and continued bullish momentum.
- Watch whether Bitcoin continues holding $71,000
- Monitor any back test of that level for support
- Track Bitcoin’s move toward the $93,000 to $96,000 zone
- Follow Ethereum’s path toward $2,900 and possibly $3,800
- Look for altcoins to continue stabilizing if Bitcoin remains firm
The current environment suggests an early-stage expansion phase may be forming, but confirmation still rests on support holding and momentum continuing.
FAQ
Was the recent Bitcoin bottom likely at $59,000 to $60,000?
The recent move from the $59,000 to $60,000 area is being treated as a possible bottom, especially with Bitcoin now pushing higher and holding key support at $71,000.
Why is $71,000 so important for Bitcoin?
$71,000 is the key structural level and the main line in the sand for strength. If Bitcoin stays above it, the bullish setup remains valid. If it loses that level, the outlook shifts.
What is the main Bitcoin target right now?
The first major target from the current technical setup is around $93,000, with a broader target zone between $93,000 and $96,000.
Does Bitcoin need to break $96,000 to fully change the yearly outlook?
Yes. The $96,000 level is described as the biggest area for the year. Bitcoin is technically bearish below it and bullish above it.
What are the Ethereum targets in the current setup?
Ethereum has a first target around $2,900 and a main target area near $3,800 if the move continues.
Is Ethereum considered a buy at current prices?
The preferred Ethereum buy zone is under $2,000. After the recent rally, the focus is more on riding existing positions than entering new ones at current levels.
What does the current fear and greed reading suggest?
Both crypto and the stock market were in extreme fear. That is notable because large market moves often come when sentiment is very fearful.
Are altcoins beginning to improve?
Yes. Altcoins are beginning to stabilize, and TAO is highlighted as one of the stronger recent movers.
Video Reference

Omar Al-Sharif lives and works in the UAE and is involved in the blockchain technology industry. He writes articles on Bitcoin and digital assets as a personal passion, explaining complex topics in simple and understandable language.


