Markets are trying to price two conflicting narratives at once: a relief bounce on hopes of de-escalation in the Middle East, and a deeper risk-off move if those hopes fail. Into that backdrop, Doctor of Pump & Dump argues that BTC may be carving out a head-and-shoulders top, with a rally into resistance potentially setting up another leg lower.
Core Thesis: A Relief Rally Could Be the Setup for Another Bitcoin Drop
According to Doctor of Pump & Dump, Bitcoin is likely in a broader downtrend despite a short-term bounce, and the current move higher may simply be building a bearish continuation structure. His central view is that resistance around $74,000 to $76,000 should hold, that stops clustered around $62,000 to $63,000 are likely to be taken, and that BTC could trade as low as $60,000 before a more durable bottom forms.
The analyst ties that view to both macro headlines and chart structure. On the macro side, he frames the latest Bitcoin strength as a rally on hopes of a negotiated settlement involving Iran, while warning that markets could quickly reprice if geopolitical tensions escalate. He also points to incoming CPI data on Friday the 10th as another event traders are watching. On the technical side, he says Bitcoin has repeatedly broken support, then rallied back to those same levels only to find resistance. In his telling, that pattern has already shown up around $74,000, and the market may now be forming a lower high beneath $76,000.
That is a distinctly cautious take relative to the broader crypto market’s default reflex, which is often to treat every rebound as the start of a new impulsive leg higher. In general market context, that makes this call more contrarian than consensus during bounce phases. It is also not baseless: failed reclaim attempts under major moving averages, plus lower highs after a trend break, are classic bear-market behavior. At the same time, Bitcoin has spent much of this cycle punishing clean technical narratives, especially when ETF flows, macro liquidity expectations, or short-covering overwhelm local chart patterns.
Supporting Analysis: Why the Analyst Thinks the Bounce Is Vulnerable
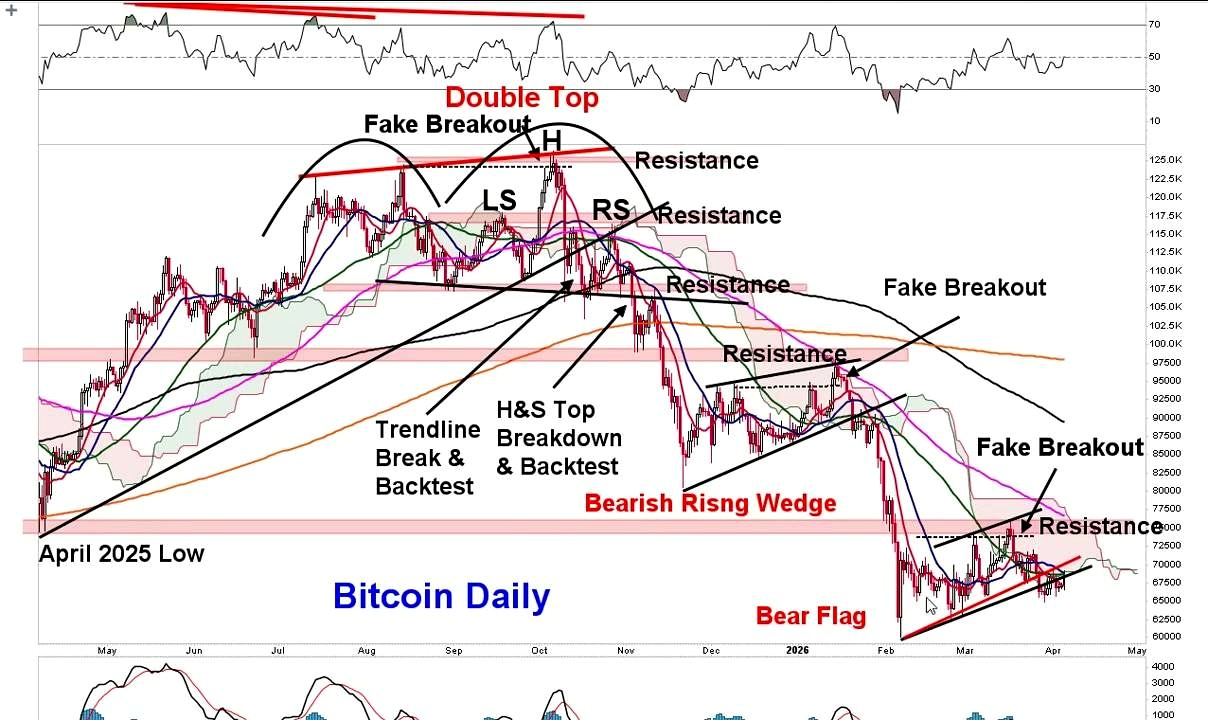
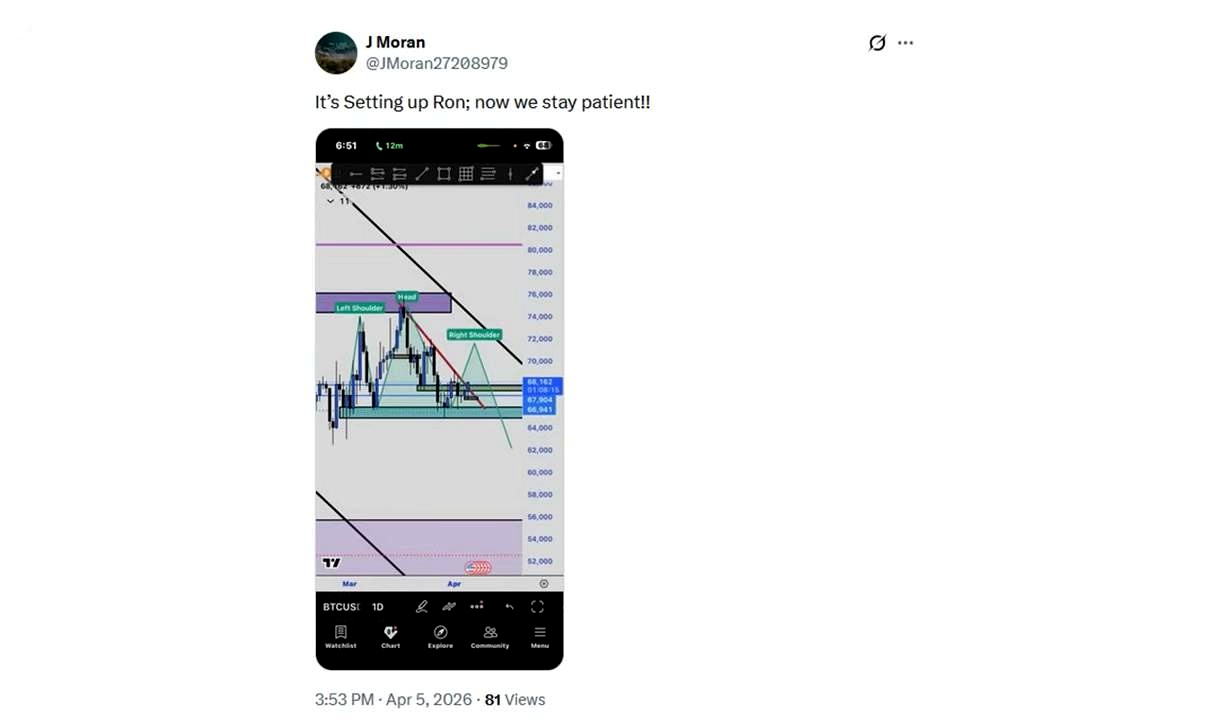
Doctor of Pump & Dump says the market may be transitioning from an earlier bearish flag into a more recognizable head-and-shoulders formation. He credits an X follower, Jay Moran, for flagging the possibility that Bitcoin is building a right shoulder rather than breaking down immediately. In that setup, BTC could bounce further, possibly back toward the $74,000 or $76,000 zone, before rolling over again.
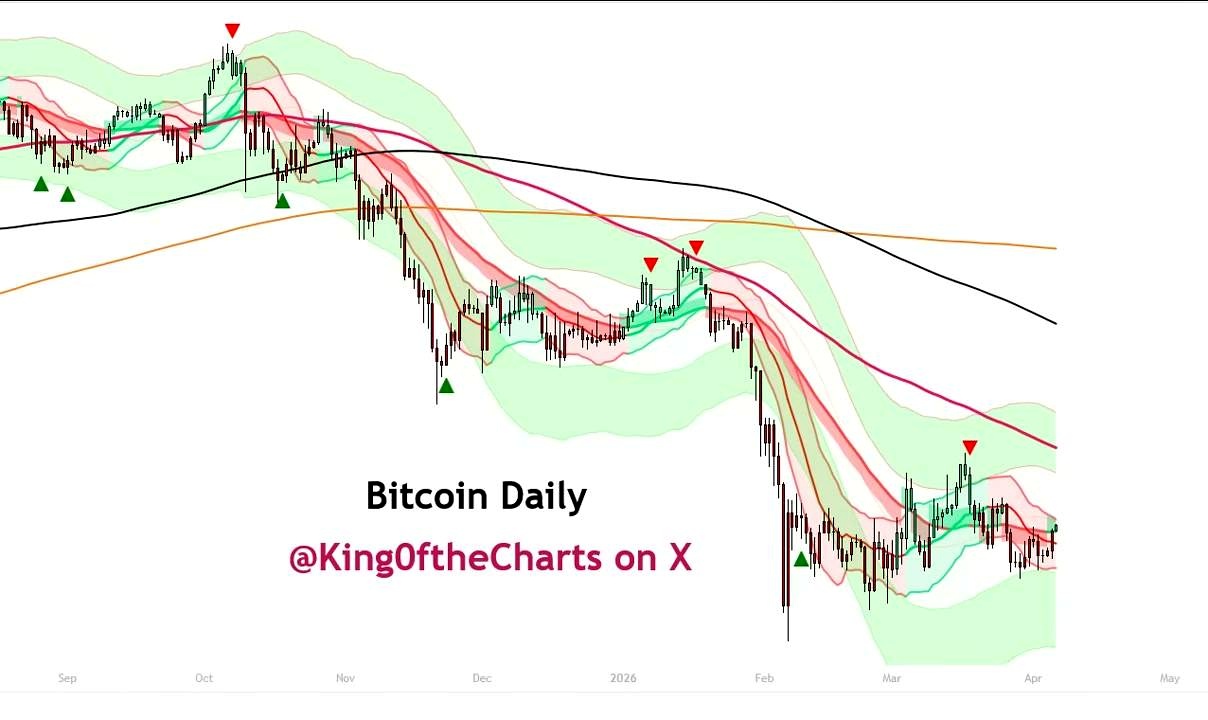
He repeatedly references the 200-period moving average as an area Bitcoin has rallied back into, while noting that momentum gauges are mixed. RSI has moved to a new high in his framework, MACD is trying to curl back above the center line, and some daily signals are attempting to turn bullish. But he argues those signals are characteristic of sideways price action and a countertrend rally rather than a true trend reversal.
His shorter-term framework is equally specific. He says the 10-period has already dropped below the 50-period, while the 20-period is also moving down toward the 50-period. He describes the 100-period moving average as declining into the same overhead resistance zone between $74,000 and $76,000, strengthening his case that any advance into that range should struggle.
The trading expression of that thesis is also clear. The analyst says he already closed half of a short after the move into his downside objective around $61,000, referencing an earlier target range of $60,000 to $63,000. If Bitcoin gets one more push lower, he says he plans to close the remainder of that short and then look for a long setup. In other words, this is not an open-ended crash call. It is a tactical bearish view that expects a final washout into major stop clusters before a better buying opportunity appears.
He also references precedent, noting a prior drawdown of nearly 39% from the January 14 high, and says weekly price action had been up 4.55% at the time of recording. That combination matters: short-term strength on the weekly timeframe does not automatically invalidate a bearish medium-term structure, particularly if the bounce occurs beneath broken support.
What Could Go Wrong With This Bearish BTC Thesis
The cleanest invalidation is straightforward: Bitcoin reclaims and holds above $76,000 instead of printing a lower high beneath it. The analyst explicitly says he does not think BTC will exceed $76,000. If price does push through that level and turns it into support, the head-and-shoulders setup weakens sharply, and the “right shoulder then breakdown” scenario becomes much less compelling.
There is also a broader structural risk to the bearish case. Bitcoin often front-runs macro resolution and liquidity shifts before traditional technical indicators fully confirm them. If geopolitical stress eases faster than expected, if inflation data comes in soft enough to improve risk appetite, or if spot demand returns aggressively, the market may not revisit the $62,000 to $63,000 stop zone at all. A market that refuses to sweep obvious liquidity levels can be just as telling as one that does.
The analyst also leans heavily on chart-based resistance behavior, but does not spend much time on one of the strongest counterarguments in this cycle: persistent institutional-style demand has changed how deep Bitcoin corrections can run before buyers step in. In recent years, crowded bearish setups have frequently been squeezed when macro fears proved less severe than advertised.
Another issue is timing. He makes an important point that being early is effectively the same as being wrong for many traders. That cuts both ways. A bearish thesis may be directionally correct over weeks, but still become untradeable if BTC rallies hard first and forces risk reduction. In leveraged markets, path matters as much as destination.
What to Watch Next
The most immediate trigger is whether Bitcoin can rally into the $74,000 to $76,000 area and then stall. That would strengthen the right-shoulder thesis. A break above that band would undermine it. On the downside, traders will watch whether BTC sweeps the liquidity pocket around $62,000 to $63,000 and whether $60,000 gives way or holds as a higher-timeframe support.
Beyond price levels, the near-term macro calendar matters. The analyst highlighted CPI on Friday the 10th, while geopolitical headlines remain an obvious source of volatility. On the technical side, traders should watch whether Monday’s close confirms the short-term bullish signal flips he mentioned, or whether those reversals fail under declining moving-average resistance.
FAQ
What is a head-and-shoulders pattern in Bitcoin trading?
A head-and-shoulders pattern is a bearish reversal setup with three peaks: a left shoulder, a higher peak called the head, and a lower peak called the right shoulder. Traders usually watch the neckline beneath those peaks. If price breaks that neckline, the pattern is often treated as confirmation of a trend reversal or continuation lower.
Why does the $74,000 to $76,000 zone matter so much?
That area matters because it combines prior support turned resistance with moving-average pressure in the analyst’s framework. When Bitcoin loses a major level and then fails to reclaim it, traders often view that as evidence sellers still control trend direction.
What does it mean when stops sit around $62,000 to $63,000?
It means many traders may have placed exit orders just below that zone. Markets often move toward dense liquidity areas because stop-losses can accelerate momentum once triggered. A fast sweep below a well-watched support band can create the kind of sharp move the analyst described as a wave-three-style decline.
How is this different from a bullish falling wedge?
A bullish falling wedge typically features price compressing lower inside converging trendlines before breaking upward. That setup can look similar to a market simply grinding lower into a final low. The difference is confirmation: a true bullish wedge usually needs a convincing breakout and follow-through, not just temporary stabilization.
What happened the last time Bitcoin corrected deeply from a major high?
Bitcoin has a long history of sharp retracements even during broader bull cycles. In this transcript, the analyst referenced a nearly 39% decline from the January 14 high. Historically, those corrections often include failed rebounds, heavy liquidation, and one final flush before trend resumes or a base forms.
Reference Video

Omar Al-Sharif lives and works in the UAE and is involved in the blockchain technology industry. He writes articles on Bitcoin and digital assets as a personal passion, explaining complex topics in simple and understandable language.


