Traders are again staring at a familiar question: is Bitcoin building for another leg higher, or running into the kind of resistance that turns a relief rally into a fresh sell-off? According to Shanky’s Trading, the answer may sit in a tight band just above the market, with BTC approaching a zone where upside exhaustion could trigger a drop back toward the low $71,000s.
Bitcoin’s near-term thesis hinges on a rejection zone above price
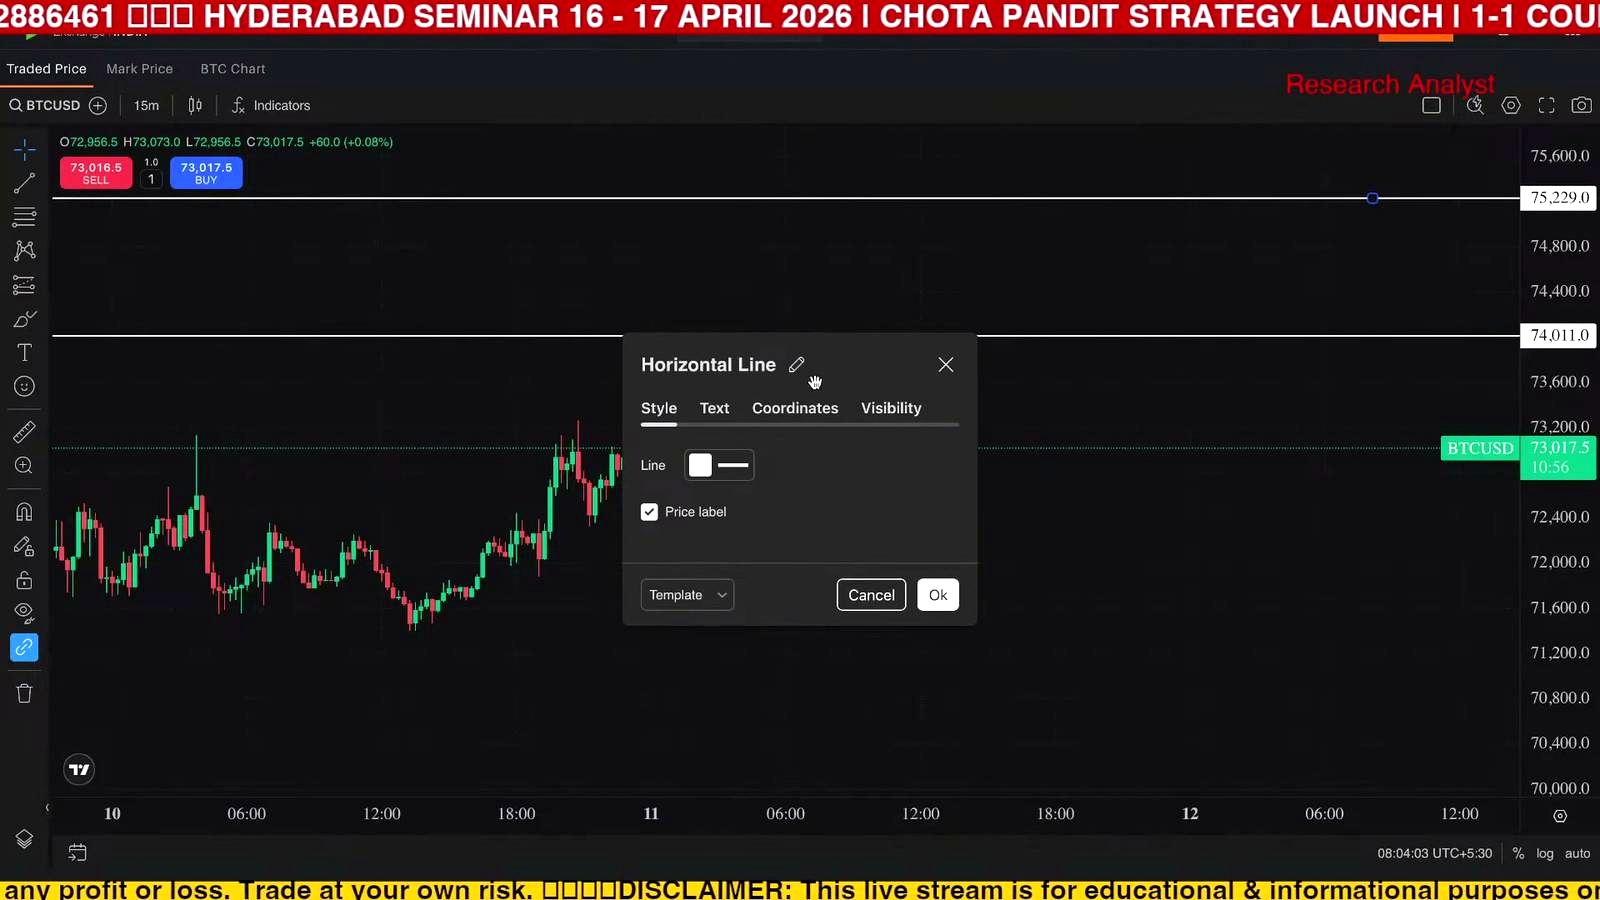
According to Shanky’s Trading, Bitcoin is moving toward a resistance cluster between roughly 74,000 and 76,000, a range the host repeatedly described as a likely “jumping and dumping” area rather than a breakout launchpad. The analyst highlighted 74.11 as an immediate level, said BTC could “drop between 74 or 76, ” and singled out 75,967 as another precise level where price could make a high before reversing.
On the downside, Shanky’s Trading mapped support at 71,744 and 71,001, while also pointing to intermediate levels around 71,400 and 71,914. In plain terms, the setup is straightforward: a move into the mid-$74,000s to high-$75,000s is, in the analyst’s view, a place to watch for weakness, not chase strength.
That makes the call notable because broader Bitcoin sentiment often turns reflexively bullish when price reclaims higher local ranges. In crypto, fast recoveries tend to pull in breakout traders, especially when leverage rebuilds after a drawdown. But technicians often treat first tests of overhead supply with caution, particularly when price is rebounding into prior rejection areas rather than discovering fresh territory. More broadly, market context still matters: Bitcoin can ignore technical resistance if macro liquidity improves, ETF-related flows accelerate, or risk assets broadly squeeze higher. By contrast, if open interest rises too quickly into resistance, that same zone can become a trap for late longs.
Secondary levels show how the analyst is framing the trade
The host’s framework was less about a sweeping long-term macro call than about execution around specific price markers. He explicitly warned viewers not to enter “blindly, ” arguing traders should wait for BTC to touch the marked levels before acting. That suggests a reactive strategy: let price come into resistance, then look for a failed push rather than pre-empting the move.
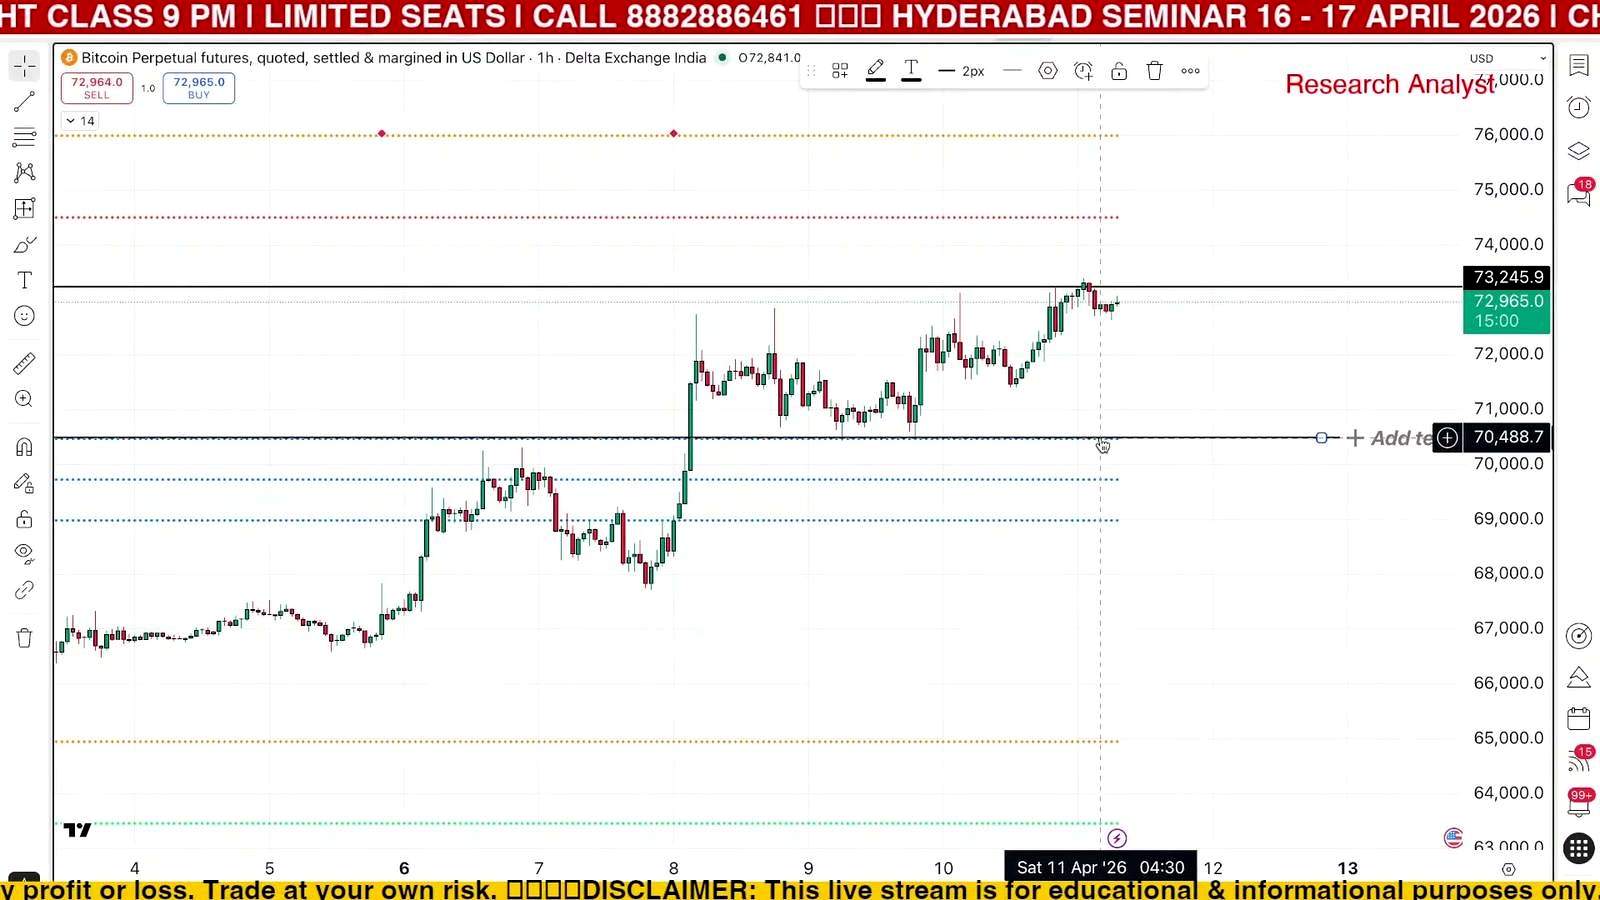
Shanky’s Trading also tied the broader setup to CPR, or Central Pivot Range, a trading framework the host uses across timeframes. In the longer-view section, he cited a prior monthly CPR setup with an entry at 74,888 and a target of 73,245, saying that target was identified on April 9 and took roughly three days to play out across 9, 10, and 11. He also referenced an hourly indicator entry at 66,224 with a first target of 68,964, then described another trade with a stop-loss near 71,000, a risk of about 1,000 points, and a gain of about 2,000 points. Elsewhere, he claimed traders were given as much as 3,000 BTC points using the same logic.
Those examples matter because they show the analyst is not simply calling for a crash. He is describing a market that can rally first, tag pre-defined resistance, and then rotate lower. That is a common posture in range-bound or corrective markets: fade strength into supply, then look for support in lower bands. The transcript also included a brief reference to “news of war, ” implying the host sees geopolitical headlines as a possible background driver of volatility, though he did not develop that point in detail.
Ethereum, in his view, was showing a similar structure. Shanky’s Trading said ETH was “trying to pull up” but identified 2,274 as resistance, followed by 2,302 and 2,357 above. On the downside, he flagged 2,229 and 2,175. That cross-asset framing matters because traders often use ETH confirmation to judge whether a BTC move is broad-based or isolated.
What could go wrong with this bearish-rejection setup
The cleanest way to break the analyst’s thesis would be a decisive Bitcoin move through the upper end of the $74,000-$76,000 band, especially if price reclaims that zone and then holds it as support. A failed rejection is one of the fastest ways short setups unravel in crypto, where thin weekend liquidity and leveraged positioning can turn a modest breakout into a sharp squeeze.
There are also risks the host did not spell out. One is that technical levels lose force when macro catalysts dominate. A softer inflation print, a sudden improvement in risk appetite, or strong spot demand can overwhelm intraday resistance. Another is that Bitcoin’s market structure can shift quickly if ETF inflows, basis expansion, or derivatives liquidations create one-way momentum. In those moments, a level that looked like obvious resistance becomes a trigger for acceleration.
The opposite side of this trade is also coherent: bulls could argue that repeated focus on 74,000 to 76,000 means the market is simply building energy beneath resistance. If sellers cannot force BTC back through the 71,900, 71,744, and 71,400 supports, then the zone may end up functioning as a staging area rather than a ceiling. That is especially true if Ethereum clears 2,274 and starts pressing 2,302 and 2,357 alongside BTC strength.
What to watch next
The first trigger is whether Bitcoin actually reaches the analyst’s sell zone around 74,000 to 76,000, and more specifically whether price stalls near 75,967. After that, traders will be watching whether BTC loses the intermediate supports around 71,914 and 71,744. A break there would make the move toward 71,400 and 71,001 more relevant.
The host also flagged Monday the 13th as a session to watch, calling a market drop on the 13th a “tradition” and linking that timing to expiry-day behavior. Even if traders do not share that superstition, the practical takeaway is clear: watch how BTC behaves around the next weekly open, around expiry, and on any push into the mid-$70,000s. If resistance rejects cleanly, the analyst’s setup stays alive. If BTC breaks and holds above it, the trade idea weakens fast.
FAQ
What is CPR in crypto trading?
CPR stands for Central Pivot Range, a technical framework built from prior price data to map likely support, resistance, and directional bias. Many intraday traders use daily, weekly, or monthly CPR levels to identify where price may reverse, trend, or consolidate.
Why does the $74,000-$76,000 area matter for BTC?
That kind of range matters because it can act as overhead supply, a zone where prior sellers reappear and breakout buyers get tested. When analysts identify clustered levels rather than a single price, they are usually looking for a reaction area, not an exact tick-by-tick turning point.
What would a bearish BTC trade look like around these levels?
In general, a bearish setup around resistance waits for price to test the zone, show rejection, and then lose short-term support. Traders typically define invalidation above the resistance band and look for downside targets at the next support levels, rather than shorting pre-emptively before price reaches the area.
How does Ethereum help confirm a Bitcoin move?
ETH often acts as a secondary read on risk appetite inside crypto. If Bitcoin pushes into resistance while Ethereum also stalls at its own resistance, that can strengthen a bearish case. If ETH breaks higher cleanly while BTC is testing resistance, it can weaken the argument that the whole market is rolling over.
What happened the last time Bitcoin moved several thousand points in a short period?
Large BTC moves over 2,000 to 3,000 points are common in high-volatility phases, especially around macro headlines, liquidations, or major technical breaks. In those periods, support and resistance still matter, but moves tend to overshoot more often, which is why traders focus heavily on confirmation and risk control.
Original Video

John Burnell focuses on Bitcoin infrastructure, wallet security and blockchain technology. He writes educational articles explaining how Bitcoin works and how the technology evolves.


