After a rebound pushed BTC back toward the mid-$70,000s, traders are again confronting the central question of this market: is this recovery the start of a durable move higher, or just another reset before a deeper leg down? According to 100XClub, the answer is still bearish, with the analyst arguing that the recent strength fits a broader setup for another move lower, potentially even below $60,000.
The Core Thesis: 100XClub Still Sees Bitcoin in a Larger Downtrend
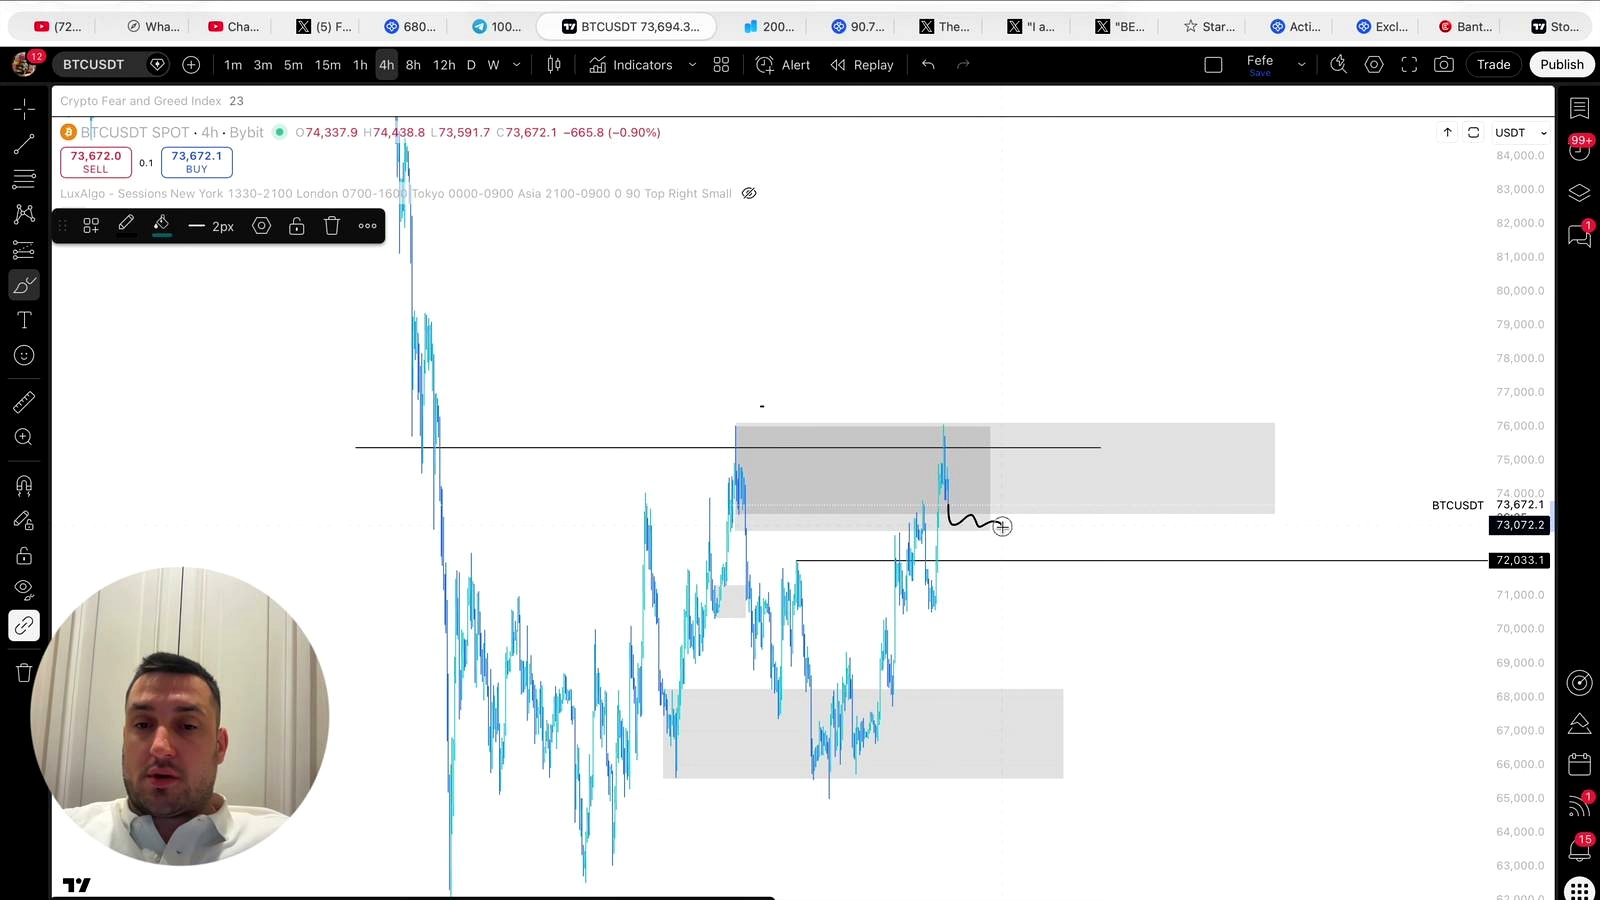
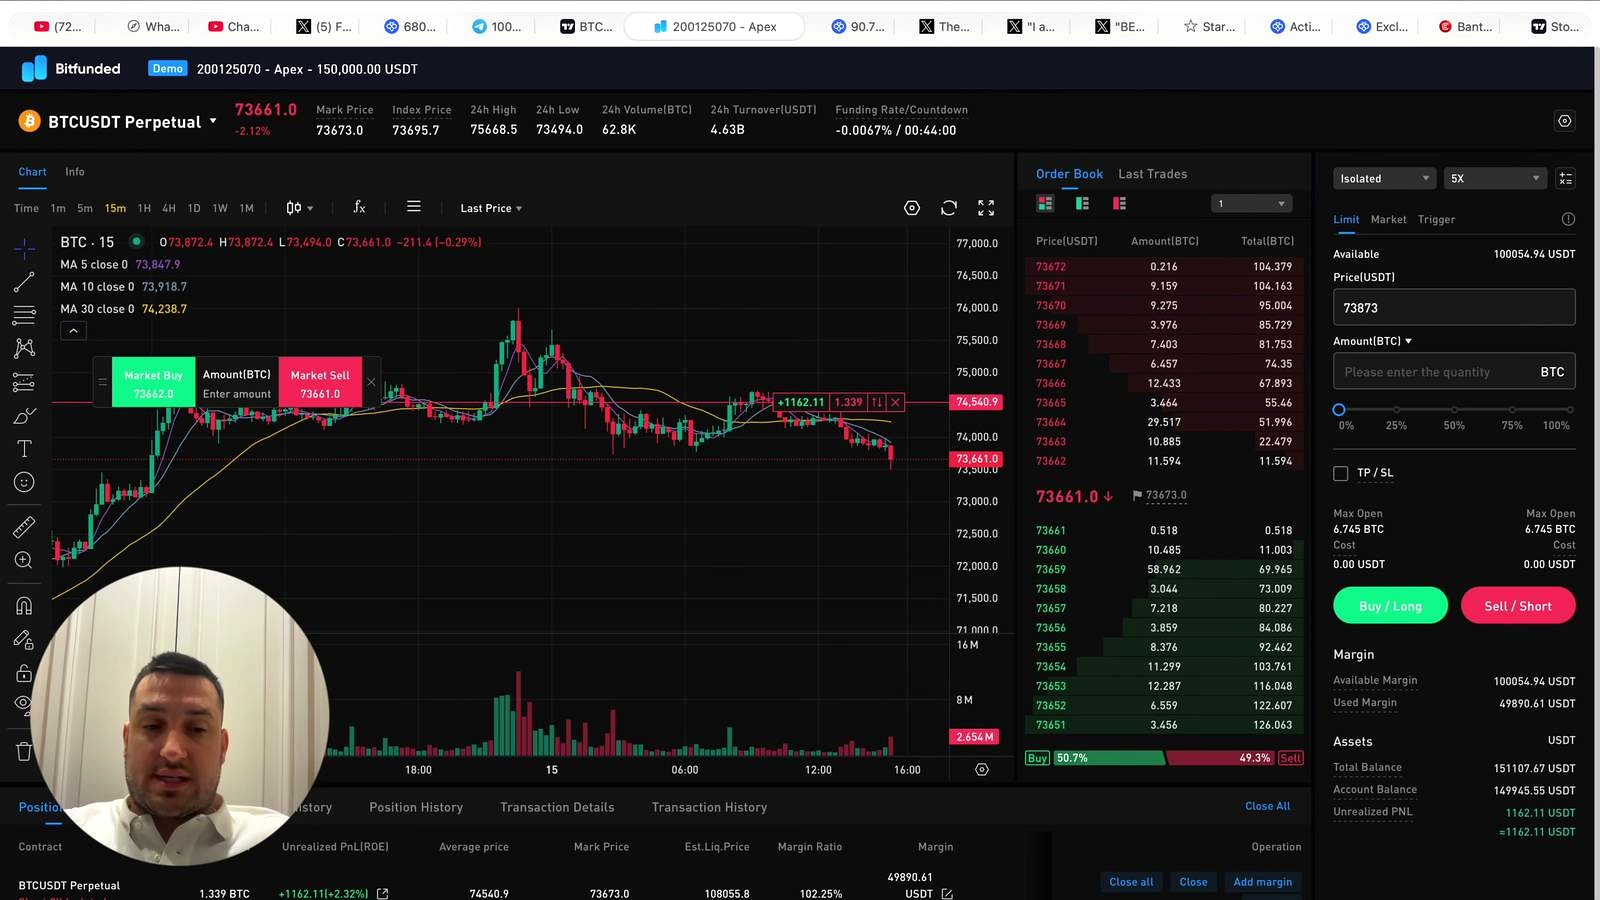
According to 100XClub, Bitcoin’s recent bounce does not mark a durable bottom. The analyst said he has believed “for quite some time” that “the Bitcoin bottom is not in, ” and that any sizable rebound should be treated as a bear market rally rather than the start of a new impulsive uptrend. His actionable view in the video was clear: he opened a short at $74,700, with a stop loss at $76,500, while also saying he may move that risk level closer to $77,000 to allow for a possible liquidity sweep above local highs.
The heart of the thesis is structural rather than macro. The host argues that Bitcoin has printed a bearish market structure shift on higher time frames and that the recent move up merely retraced into an order block that should act as resistance. He tied the current setup back to a framework he says has guided his calls since mid-March, when he focused on a retrace to the 50% level of a daily leg before rejection.
That stance sits somewhere between cautious and contrarian in the current market context. Bitcoin traders have repeatedly bought dips during this cycle, especially when price recaptures psychologically important zones and funding stays manageable. But there is also a long-running split in the market between structural bulls, who see pullbacks as consolidation inside a larger cycle, and tactical bears, who argue that repeated failures near resistance signal distribution. The broader context supports both sides: Bitcoin has often produced sharp retracements even inside bull markets, yet sustained closes back above broken support zones can quickly invalidate bearish technical setups.
Why the Analyst Thinks the Rally Can Still Fail
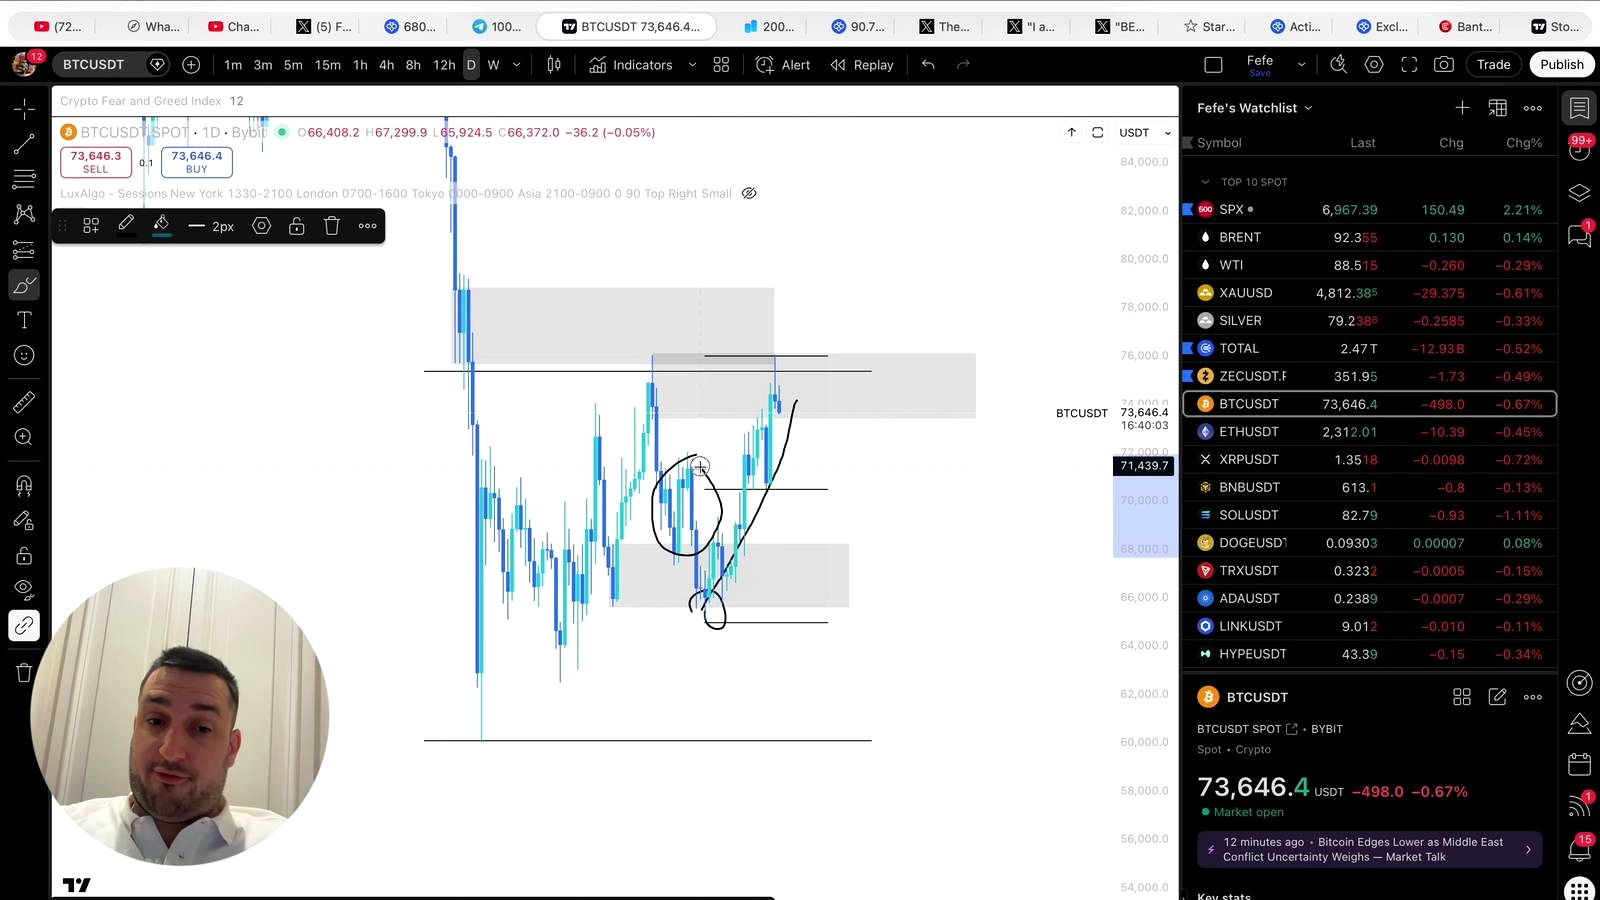
According to 100XClub, the technical case rests on how Bitcoin behaved across the 4-hour, 1-hour, 15-minute, and daily charts. The analyst said the recent move created a “clear market structure shift to the downside” and argued that the more important resistance level is the higher daily order block, not the lower 4-hour level, because the latter did not form with the pattern he requires: three consecutive candles moving upward.
In his framework, a valid daily structure break requires a close above a previous high and at least a wick below the low that created that new high. He argued that this condition was met at the daily level, making the upper resistance zone more meaningful. Once price retraced into that area, he shifted focus to lower-time-frame confirmation. There, he said a 15-minute market structure shift gave him enough evidence to enter short.
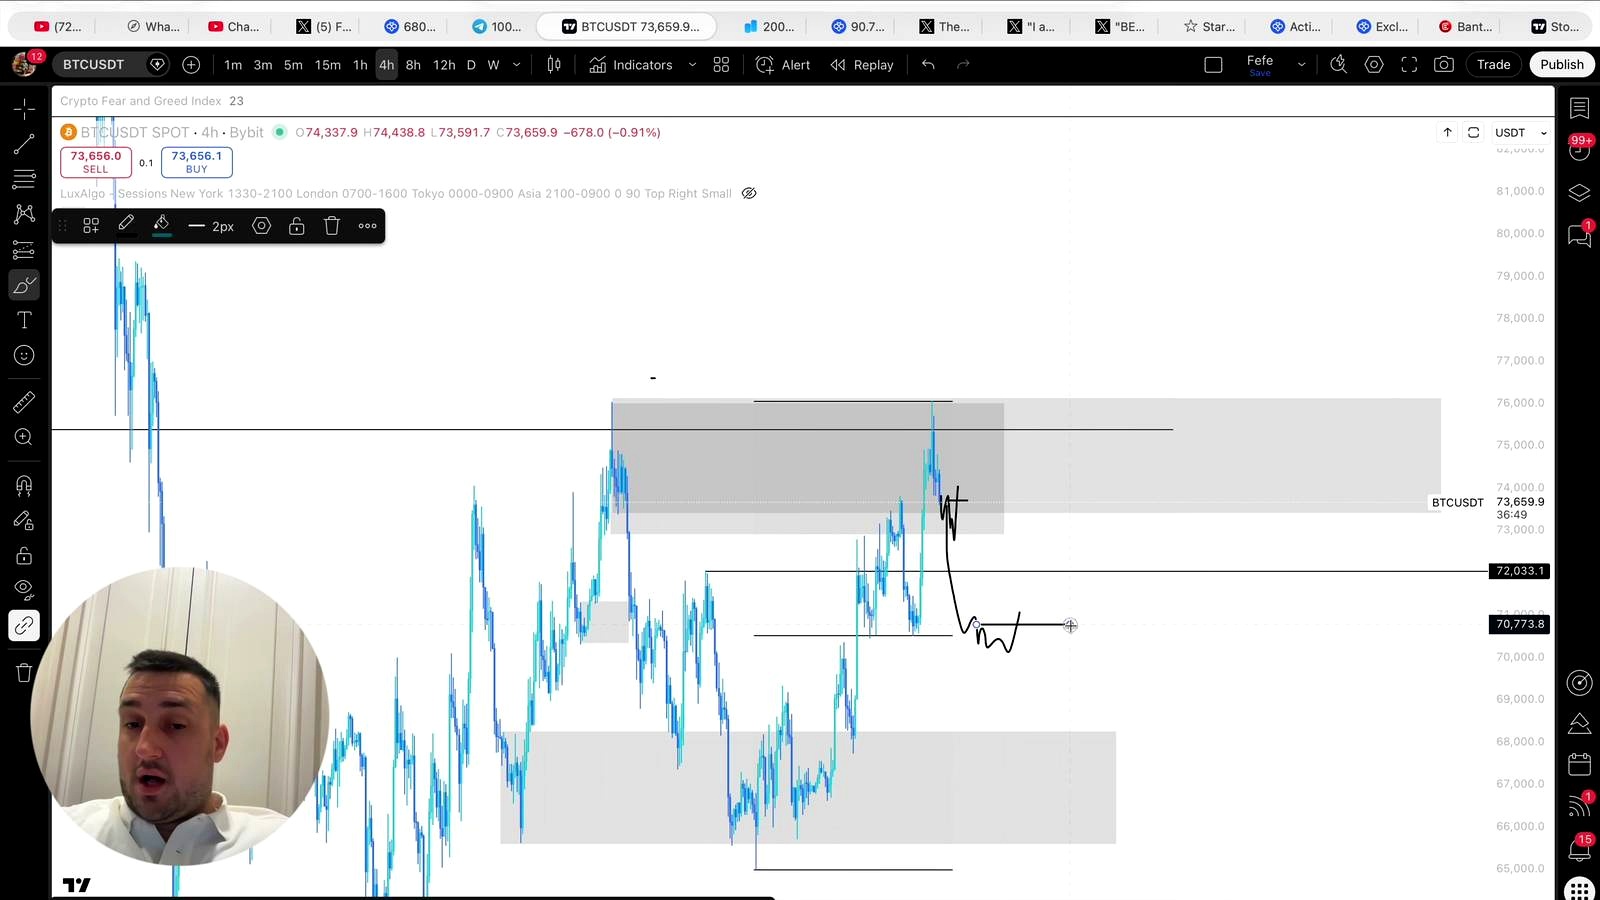
The near-term trade plan revolves around two downside scenarios. First, he is watching for a move back to around $73,000, which he described as a 50% retracement area that could produce a short-term reversal. If that happens and a fresh 15-minute bullish structure shift appears, he said he would consider closing the short. The second scenario is a deeper retrace toward roughly $70,000, tied to the 4-hour leg. Beyond that, the analyst outlined the most bearish possibility: that the recent highs mark an “ultimate top, ” after which Bitcoin rejects and trades below $60,000 to set a new low before any more durable bounce.
He also flagged the possibility of a brief move back upward first. Because there are “relative equal highs” near the recent top, the host said Bitcoin could revisit the 50% level or dip slightly, then wick above those highs in a liquidity sweep before rejecting from the 4-hour structure. That is why his stop sits above $76,500 and why he mentioned $77,000 as another possible threshold.
From a market-structure perspective, that logic is familiar. Crypto often runs clustered stop orders above equal highs before deciding direction. But traders should also recognize that this same pattern can cut both ways: a sweep of liquidity that holds can become a breakout, especially if it forces short covering and restores momentum.
What Could Go Wrong With This Bearish Bitcoin Call
The most obvious risk to the thesis is that Bitcoin simply reclaims the local range and holds above it. A stop-run through $76,500 or $77,000 is not, by itself, proof of a bullish trend. But if price pushes above those levels and then consolidates instead of sharply rejecting, the bearish setup weakens substantially. In that scenario, what the analyst sees as an order-block rejection could instead prove to be a successful retest before continuation higher.
There is also a bigger contextual risk the video did not explore in depth: strong spot demand can overpower clean-looking lower-time-frame bearish structures. Bitcoin has spent much of this cycle under the influence of institutional flows, ETF-driven sentiment, and macro shifts in rate expectations. When those forces align, local technical resistance can fail quickly.
Another counterargument is historical. Bitcoin regularly experiences 20% to 30% pullbacks inside larger bull markets without needing to make a full cycle low first. So the claim that BTC must trade below $60,000 to “bounce properly” is a strong one, and far from consensus. The bullish rebuttal would be that the market may only need time, not a dramatic flush, to reset leverage and rebuild support.
Finally, the analyst’s framework is highly dependent on candle-structure rules across specific time frames. That can be useful for trade execution, but it also means the thesis can be invalidated quickly by a few closes in the wrong place. In choppy conditions, strict structure-based systems can generate false signals on both sides.
What to Watch Next
The first level to watch is the analyst’s short entry zone around $74,700. If BTC continues lower, traders will likely focus on whether price reacts near $73,000. A clean bounce there, especially with a visible lower-time-frame reversal, would fit his first profit-taking scenario.
Below that, roughly $70,000 becomes the more important test. If Bitcoin loses that area decisively, the market will start paying more attention to the possibility of a deeper breakdown. On the upside, a push through $76,500 and especially $77,000 that does not immediately reverse would challenge the short thesis. Traders should also monitor whether any move above the recent equal highs turns into a rejection or a true reclaim, because that distinction likely decides whether this is a trap or a breakout.
FAQ
What is a market structure shift in Bitcoin trading?
A market structure shift is a technical signal that suggests trend direction may be changing. Traders usually define it by price breaking a prior swing high or low, often followed by confirmation from subsequent candles. Different analysts use different rules, which is why definitions can vary.
What is an order block?
An order block is a price zone traders believe contains significant past buying or selling interest. In practice, it is treated as a potential support or resistance area where price may react, stall, or reverse.
Why do traders care about the 50% retracement level?
The 50% retracement is a commonly watched midpoint of a prior move. Even though it is not a formal Fibonacci ratio in the same way as 61.8%, many traders use it as a simple gauge for whether a pullback is shallow, balanced, or deep before trend continuation or reversal.
What are equal highs, and why can they trigger volatility?
Equal highs are two or more nearby peaks at roughly the same price. Traders often place stop orders above them, so price can briefly spike through that area to capture liquidity before reversing. Sometimes that sweep fails quickly; other times it becomes a genuine breakout.
How does a bearish setup like this differ from a normal bull-market pullback?
In a normal bull-market pullback, price usually retraces, finds support, and then goes on to make higher highs. In a bearish setup, rallies fail into resistance, lower highs form, and breakdowns start targeting prior lows. The line between the two is often whether reclaimed levels hold after the bounce.
Original Source

John Burnell focuses on Bitcoin infrastructure, wallet security and blockchain technology. He writes educational articles explaining how Bitcoin works and how the technology evolves.


