Is this the start of a real recovery, or just a pause before the next leg lower? That is the central tension in Crypto World’s latest market read, which argues Bitcoin is bouncing for now while the larger bearish structure still dominates.
According to Crypto World, Bitcoin’s immediate move is a short-term relief bounce from a well-defined support zone, not a confirmed market bottom. The host says BTC has reached support around $65,500 to $66,000 while also flashing an oversold reading on the 4-hour RSI, a combination that typically produces at least a temporary rebound after a sharp drop.
That near-term setup matters because Bitcoin had already swept much of the downside liquidity built up over the past few days. In the host’s view, that reduces the pressure for another immediate flush lower and raises the odds of a modest rebound or choppy sideways trading over the next 1 day or so, likely through the weekend.
But Crypto World is equally clear on the bigger point: this is not being treated as a full trend reversal. On the weekly chart, the analyst says Bitcoin’s super trend indicator remains red, signaling a broader correction or bearish trend, and a large weekly bearish divergence is still in play.
The key Bitcoin levels now
The short-term case for a bounce rests on a tight set of price levels. Crypto World identifies the most important areas as follows:
- Immediate support:$65,500 to $66,000
- Minor nearby liquidity below:$65,300 to $65,400
- First resistance: around $67,500
- Major resistance:$69,000 to $69,500
- Higher resistance/liquidity target: roughly $72,000
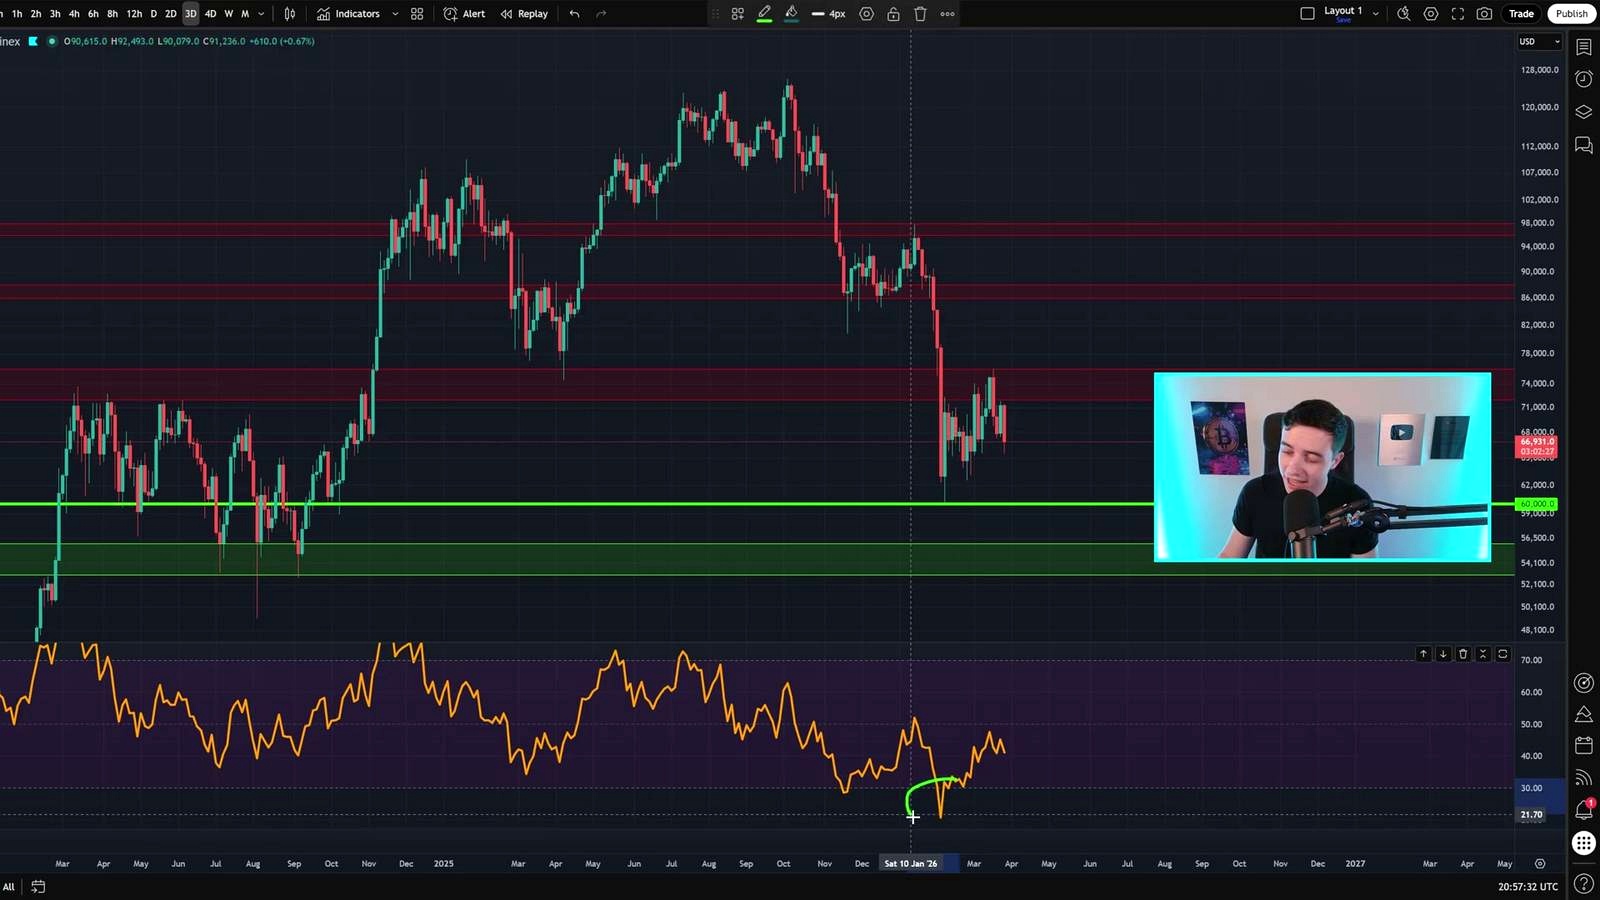
Zooming out, the analyst says Bitcoin is still trapped in a wider range on the 3-day chart. In that broader structure, support sits around $60,000, while major resistance stretches from $72,000 to $76,000. That range framing is important because it shows how limited the current bounce may be unless BTC can reclaim the upper band.
Crypto World also points to the rejection zone that helped trigger the latest pullback. Bitcoin was turned back multiple times from $71,000 to $72,000, then lost prior support at $69,000 to $69,500. Once that breakdown occurred, the host says lower short-term targets became the more likely path, which is what played out as BTC dropped into the $65,500 to $66,000 region.
Why the bounce may be real, but limited
Crypto World’s main argument is that oversold conditions can fuel relief rallies without ending a larger downtrend. The host compares the current setup to the middle of 2022, when Bitcoin’s weekly RSI also turned oversold. That earlier signal led to roughly 1 month of relief before price eventually moved lower again.
That historical analogy is central to the video’s cautionary tone. The analyst sees the current weekly oversold condition, which he says has been present for roughly a month, as a reason to expect breathing room, not as proof that the bear market is over.
In the very near term, the bounce case is supported by two factors working together: support held where expected, and the 4-hour RSI reached oversold. Crypto World argues that when price falls too far too quickly, markets often need time to reset. In practice, that usually means a mild rebound or sideways chop rather than an immediate continuation straight down.
At the same time, the host warns against expecting a clean run back to $72,000. The path upward is crowded with resistance, especially near $67,500 and again at $69,000 to $69,500. That means even if BTC continues to stabilize, the move could be uneven and vulnerable to rejection before it reaches the upper liquidity cluster.
Ethereum is following Bitcoin’s script
According to Crypto World, Ethereum looks very similar to Bitcoin right now. On the 3-day chart, ETH is still rangebound and trying to work through its own oversold RSI condition. On the shorter time frame, the host says Ethereum is also bouncing from oversold on the 4-hour RSI, which supports the case for a brief relief move through the weekend.
The key Ethereum levels mentioned in the video are:
- Short-term resistance: around $2,030
- Broader resistance:$2,150 to $2,200
- Higher 3-day resistance zone:$2,200 to $2,400
- Local support:$1,970 to $1,980
- Next support:$1,910 to $1,930
The analyst says ETH has spent most of the last 2 months inside a wider sideways range, with occasional breakouts and breakdowns failing to hold. That lack of follow-through, in his view, shows the market is still short on momentum in either direction.
XRP shows a fresh short-term bullish signal
Crypto World singles out XRP for a more distinct short-term setup. While the host still describes XRP’s larger trend as bearish on the weekly chart, he says the token is holding a crucial support zone between $1.30 and $1.40 and has now confirmed a 4-hour bullish divergence.
That divergence consists of lower lows in price alongside higher lows in the 4-hour RSI. In the host’s framework, that supports a modest bounce over the next 1 to 2 days, not a major breakout.
The downside levels remain important. Crypto World says a weekly close below roughly $1.30, especially if XRP cannot reclaim that area afterward, could open the way to around $1.13. If that fails, the next major support zone sits between $0.90 and $1.00.
For now, though, the host’s emphasis is on support holding and a short-term relief phase continuing.
Altcoins broadly are still moving with Bitcoin
Crypto World says Bitcoin dominance is moving mostly sideways, which implies many altcoins are likely to perform broadly in line with BTC rather than dramatically outperforming or underperforming.
The video uses Solana and Chainlink to reinforce that point. Solana is described as still bearish in the long term but rangebound in the short to medium term, with support at $75 to $80 and resistance at $95 to $105. On the 4-hour chart, the host flags short-term resistance at $84.50 to $85.00, support at $81.50 to $82.00, and deeper support at $75 to $78.
Chainlink is framed similarly: long-term bearish, but currently rangebound with support at $7.90 to $8.50 and resistance at $9.50 to $10.00. The host says LINK, like the rest of the market, is seeing a temporary break from bearish pressure rather than a decisive change in trend.
What to watch next
Crypto World’s roadmap is straightforward. In the short term, watch whether Bitcoin can keep holding $65,500 to $66,000 and grind higher through nearby resistance. A move into $67,500 and then $69,000 to $69,500 would fit the relief-bounce thesis.
Beyond that, $72,000 is the more meaningful upside area on the liquidation map, but the analyst does not expect Bitcoin to move there in a straight line. On the downside, any loss of the current support zone would weaken the case that the market has finished its near-term reset.
The bigger signal still sits on the weekly chart. As long as Bitcoin remains under the broader resistance band of $72,000 to $76,000 and the weekly bearish structure stays intact, Crypto World treats this rebound as tactical relief inside a larger bearish environment.
FAQ
Is Crypto World calling a Bitcoin bottom?
No. The host explicitly frames the current move as a short-term bounce from support and oversold conditions, not confirmation that the broader bearish trend has ended.
What is the most important BTC support zone in the video?
The nearest key support is $65,500 to $66,000. On the broader range, Crypto World also highlights $60,000 as significant support on the 3-day chart.
Why does Crypto World think Bitcoin can bounce now?
Because BTC has already swept much of the downside liquidity from recent sessions and hit oversold on the 4-hour RSI. The host says that combination often leads to a reset move higher or sideways.
Which altcoin had the strongest short-term bullish signal in the video?
XRP. Crypto World says XRP has confirmed a new 4-hour bullish divergence while holding support around $1.30 to $1.35, which supports a short-term relief bounce.
What numbers matter most across the market?
The video’s main levels are: BTC support at $65,500 to $66,000, BTC resistance at $67,500, $69,000 to $69,500, and $72,000; ETH resistance at $2,030 and $2,150 to $2,200; XRP support at $1.30 to $1.40 and downside risk to $1.13 if that breaks.
Reference Video

An Indian crypto journalist covering the developments in the Bitcoin and blockchain industries. Her work helps readers understand key changes in the world of digital assets.


