Bitcoin is back at a familiar fault line: strong enough to press toward $80,000, but not yet strong enough to cleanly reclaim it. That leaves traders with a live question, was the latest rejection the start of a larger rollover, or just a pause before another push higher?
Bitcoin’s core setup: rejected at $80K, but not broken below support
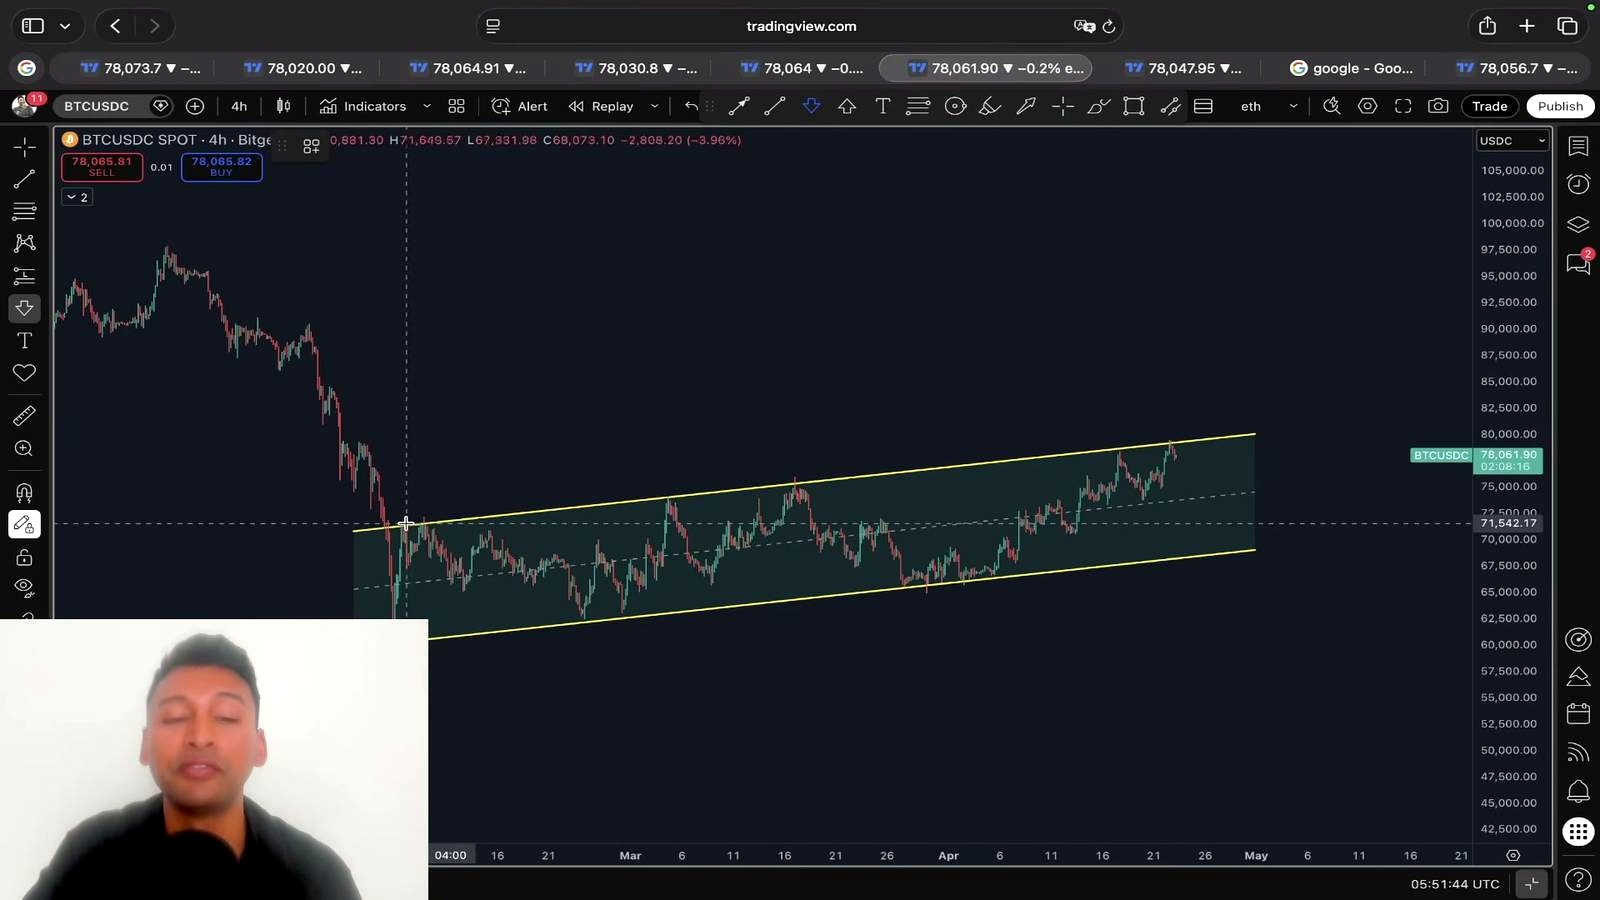
According to Crypto Anup, Bitcoin’s failure near $79,500 to $79,600 does not yet amount to a bearish reversal. His main argument is that price has already reached a first bullish target near $74,400 and still has an open upside objective around $80,740, with a similar monthly opportunity near $80,700. In his framework, a retreat back into the $74,000 to $75,000 area would still count as a temporary pullback rather than trend failure, provided Bitcoin holds the broader support zone above $70,000.
That is a relatively constructive interpretation at a moment when broader market sentiment remains split. Bulls can point to a common technical pattern: once Bitcoin breaks out from a falling channel or bull flag, the market often retests before continuing. Bears, however, can point to the obvious fact that round-number resistance matters, especially when order books appear heavy around a level as visible as $80,000. Failed breakouts near psychological thresholds often trigger fast mean reversion.
The broader context also matters. In strong bull phases, Bitcoin frequently absorbs local resistance, consolidates, and then trends higher after liquidity gets rebuilt. But in more fragile conditions, repeated rejection at a major level can morph into a lower high and invite selling. That is why the distinction Crypto Anup makes around $70,000 matters: he is effectively saying the market can stay noisy and still remain structurally bullish unless that lower support gives way.
Why the analyst still sees upside despite the rejection
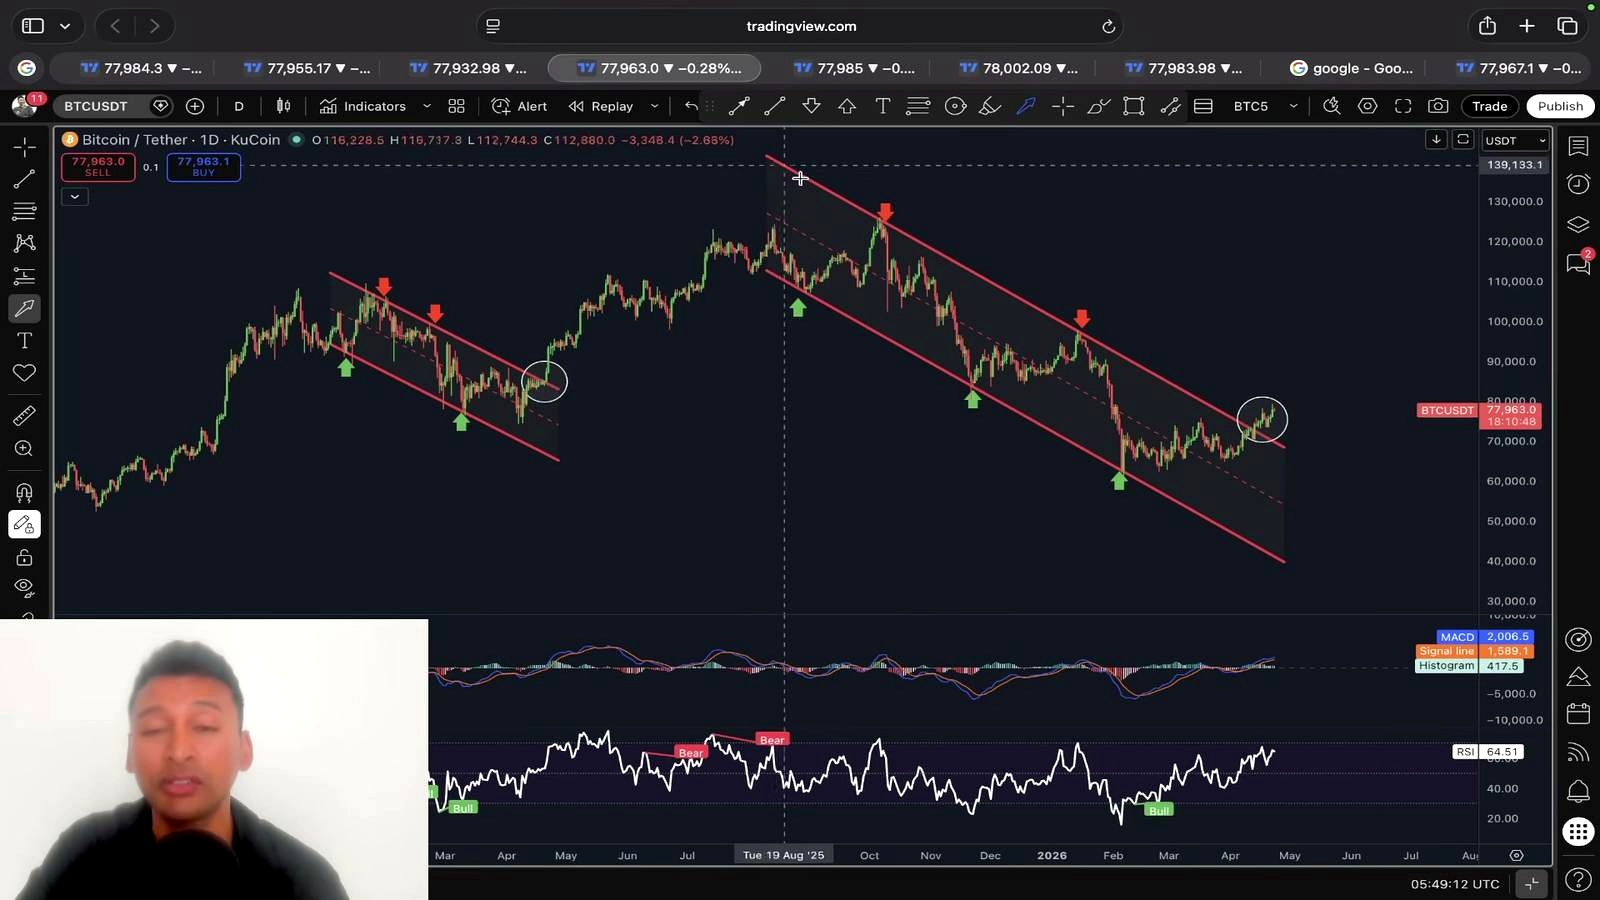
Crypto Anup argues that the recent structure remains constructive because Bitcoin has broken out of what he describes as a falling channel or bull flag formation. He compares that setup to prior periods when a breakout from a key descending resistance line led to bullish continuation and, in at least one earlier case, a new all-time high.
His near-term map centers on a horizontal trend line above the current market that he says previously acted as support and may now function as resistance. In the short term, though, he sees that same line as a “magnet” that could still pull price back above $80,000 before the market chooses a clearer direction.
He layers in moving-average analysis as well. Specifically, he says Bitcoin previously found support at the 100 exponential moving average, and now that price sits below it, the average itself could become an attraction point on a rebound. He also cites the Bollinger Bands center baseline and a bullish Williams Alligator crossover as evidence that pullbacks should still be treated as retracements within an uptrend rather than proof of a trend change.
The practical implication is straightforward. In the analyst’s view, a dip from current levels does not automatically invalidate the bullish case. Instead, he frames weakness above $70,000 as a potential buying opportunity, even while acknowledging that the current rising or ascending channel can also be interpreted as a bearish continuation pattern. That tension is the key feature of the setup: Bitcoin has bullish support underneath, but it is also trading beneath a major resistance cluster that still needs to be reclaimed.
What could go wrong for the bullish thesis
The cleanest way to break Crypto Anup’s thesis is also the level he repeats most often: a decisive loss of $70,000. He argues that as long as Bitcoin remains above that zone, pullbacks should be treated as temporary. If that floor fails, the market would no longer be dealing with a routine retest of breakout structure; it would be confronting the possibility that the move above key trend resistance was a false breakout.
There is also a shorter-term risk the analyst acknowledges but arguably underplays. Bitcoin has already been rejected once near $80,000, where he says there were heavy sell orders. If price continues to stall beneath that level, traders may start to read the setup less as consolidation and more as distribution. In technical terms, repeated failure at resistance can drain momentum, especially if spot demand weakens and the market starts depending too heavily on leveraged positioning.
Another risk is that indicator confluence can become self-canceling when macro conditions shift. Bull flags, moving averages, Bollinger midlines, and trend channels all work best when liquidity conditions are stable and momentum is broad. If risk assets wobble or ETF-related flows cool, chart support can break faster than expected. The other side of this trade is simple: bears do not need an immediate collapse. They only need Bitcoin to keep failing at $80,000 until the market starts accepting lower prices.
What to watch next
The first trigger is whether Bitcoin can reclaim and hold the area between roughly $80,000 and $80,740. A clean break there would strengthen the analyst’s case that the recent rejection was only a pause and that the “magnet” level above price has done its job.
Below the market, the key test remains the $74,000 to $75,000 zone, followed by the broader line in the sand at $70,000. If Bitcoin pulls back but stabilizes in that higher support band, bulls can still argue the market is building for another attempt at resistance. If it slices through $70,000, the thesis shifts from healthy consolidation to failed breakout risk.
FAQ
What is a bull flag in Bitcoin trading?
A bull flag is a continuation pattern where price pauses or drifts lower after a strong upward move, then breaks out again. Traders watch it because a successful breakout can signal trend continuation, though failed bull flags can reverse sharply.
Why does $80,000 matter so much for BTC?
Round numbers often attract heavy trading interest because they are easy psychological reference points. They also tend to cluster stop orders, take-profit orders, and fresh breakout trades, which can make them act as stronger resistance or support than nearby prices.
What is the 100 EMA and why do traders use it?
The 100 EMA is the 100-period exponential moving average, a trend-following indicator that gives more weight to recent price action. Traders use it to gauge trend direction and potential dynamic support or resistance.
How is a rising channel different from a bull flag?
A rising channel is an upward-sloping range where price bounces between parallel trend lines. Depending on context, it can be bullish or bearish. A bull flag usually follows a strong impulse move and is specifically viewed as a pause before possible continuation.
What happened in past Bitcoin rallies after repeated resistance tests?
Historically, repeated tests can resolve either way. In strong bull markets, multiple taps of resistance often weaken sellers before a breakout. In weaker environments, repeated failures can form a local top and lead to sharper retracements as traders abandon breakout attempts.
Original Video

Omar Al-Sharif lives and works in the UAE and is involved in the blockchain technology industry. He writes articles on Bitcoin and digital assets as a personal passion, explaining complex topics in simple and understandable language.


