Risk assets are sending mixed signals: tech stocks slipped on renewed geopolitical worries, oil pushed higher, and yet BTC held up better than many traders expected. The key question now is whether Bitcoin’s resilience marks accumulation before another leg up, or a pause inside a larger bearish setup.
Bitcoin’s Setup: Bear Flag on the Daily, Buy Signal on the Weekly
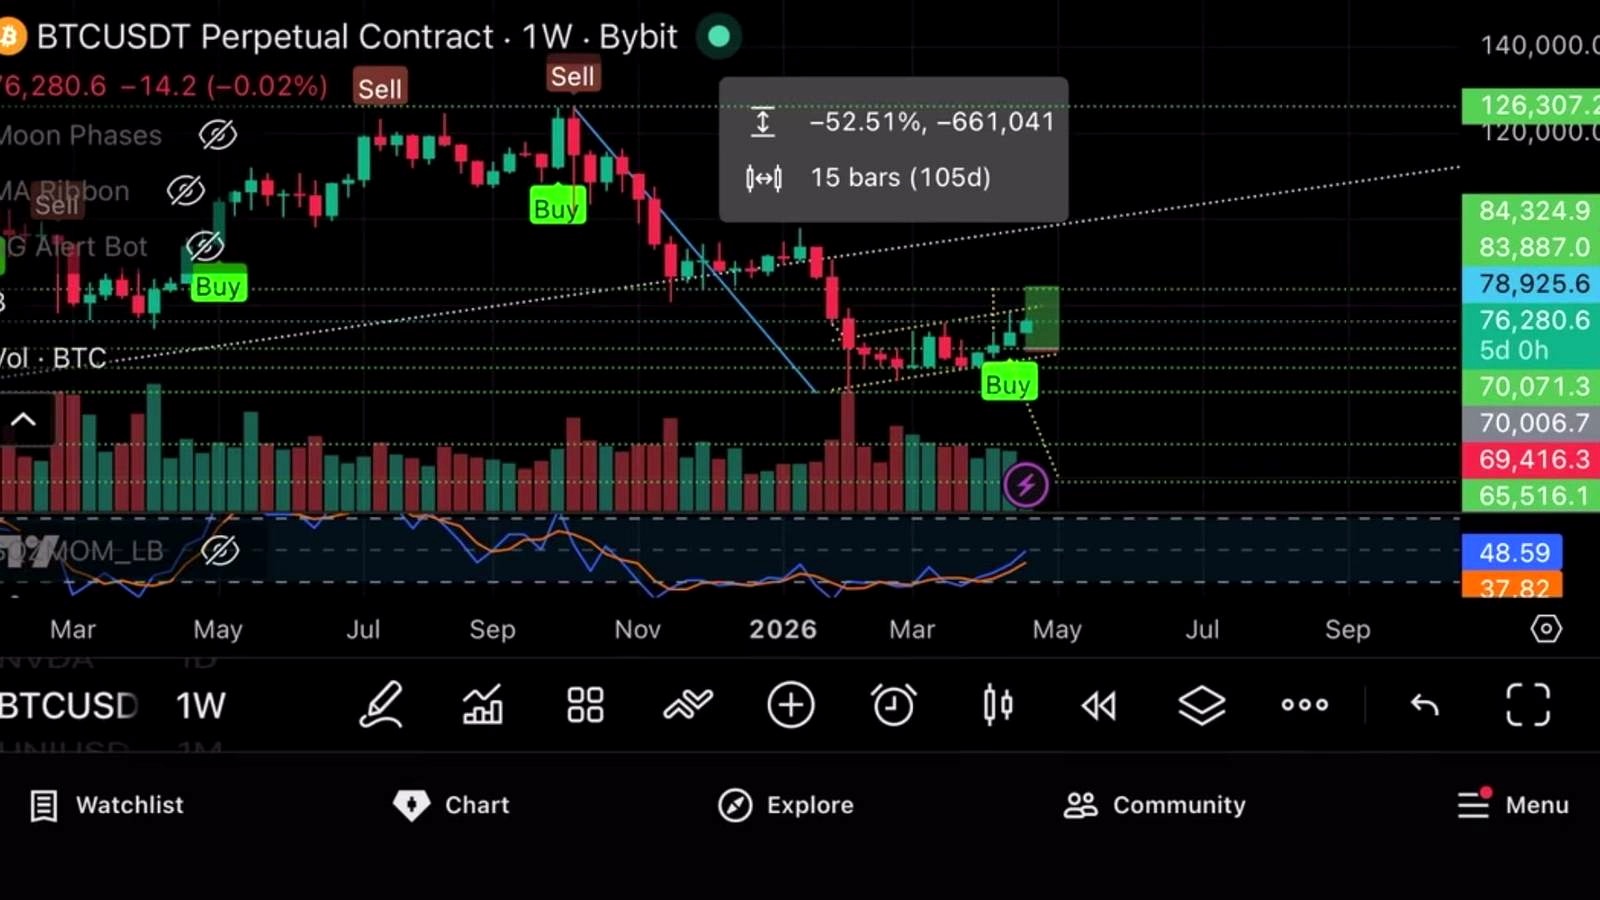
According to James Crypto Guru, Bitcoin is flashing a troubling short-term technical pattern even as his higher-timeframe view remains constructive. His central argument is straightforward: BTC looks like a daily bear flag, and if that pattern breaks lower, the implied downside target is about $38,000. At the same time, he says the weekly stochastic is oversold and turning higher, which is typically the kind of condition where he prefers to buy rather than short.
That tension is what makes the call notable. The analyst said Bitcoin’s weekly indicator had recently fired a buy after being on a sell signal for nearly five months. He contrasted that with what he described as an earlier weekly sell at $126,000. On the daily, however, he said his indicator had just flipped back to sell and that BTC was sitting at resistance.
This sits somewhere between consensus and contrarian. The broader market has spent much of this cycle treating pullbacks as buying opportunities, especially when higher-timeframe momentum resets without a complete break in structure. But technicians also know that bear flags appearing after a sharp decline can resolve lower, particularly if macro sentiment deteriorates. In general market terms, Bitcoin tends to respond sharply to a stronger dollar, rising real yields, ETF flow slowdowns, or broad risk-off moves in equities. On the other hand, periods of consolidation after a washout can mark the start of a recovery if spot demand absorbs selling and leveraged positioning is not overcrowded.
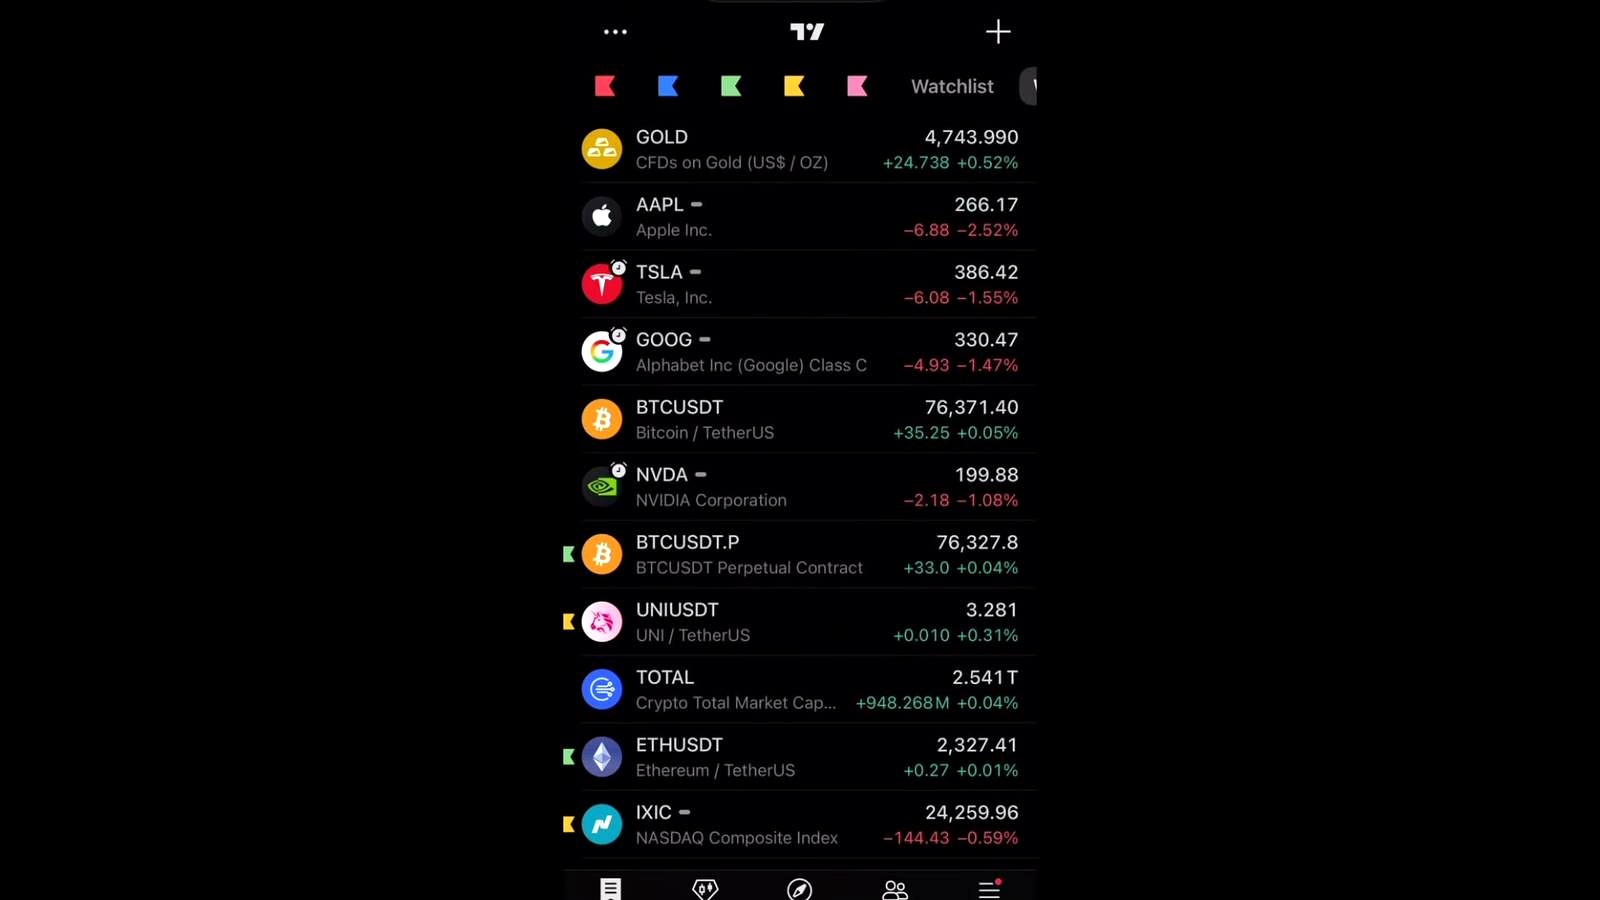
James Crypto Guru also framed BTC’s relative strength against weak tech performance as meaningful. He noted that Apple fell 2.5%, Tesla 1.5%, Google 1.4%, and Nvidia 1%, while Bitcoin was up. He attributed some of that strength to Michael Saylor buying $2.5 billion worth of Bitcoin on Monday. Even if traders debate how much one corporate buyer can move the market on its own, the broader point matters: BTC outperforming mega-cap tech during a risk wobble tends to draw attention.
The Trade Levels He’s Watching
According to James Crypto Guru, the practical response to this mixed setup is not to short aggressively here, but to scale into weakness. He said he would keep a Bitcoin trade around $70,000, with a stop loss near $69,100 after also referencing $69,000, while targeting $83,000. He described that as risking about $1,000 to make $14,000, or roughly a 13x risk-reward, and said that with 10x leverage the profit would be $140,000.
Those numbers show the nature of the setup he is trying to capture: a tight invalidation point below support and a much larger upside target if weekly momentum continues to improve. He also said he had laddered Bitcoin buy orders at $72,000, $70,000, $68,000, $67,000, and $65,000, with the goal of building the position on pullbacks rather than chasing strength.
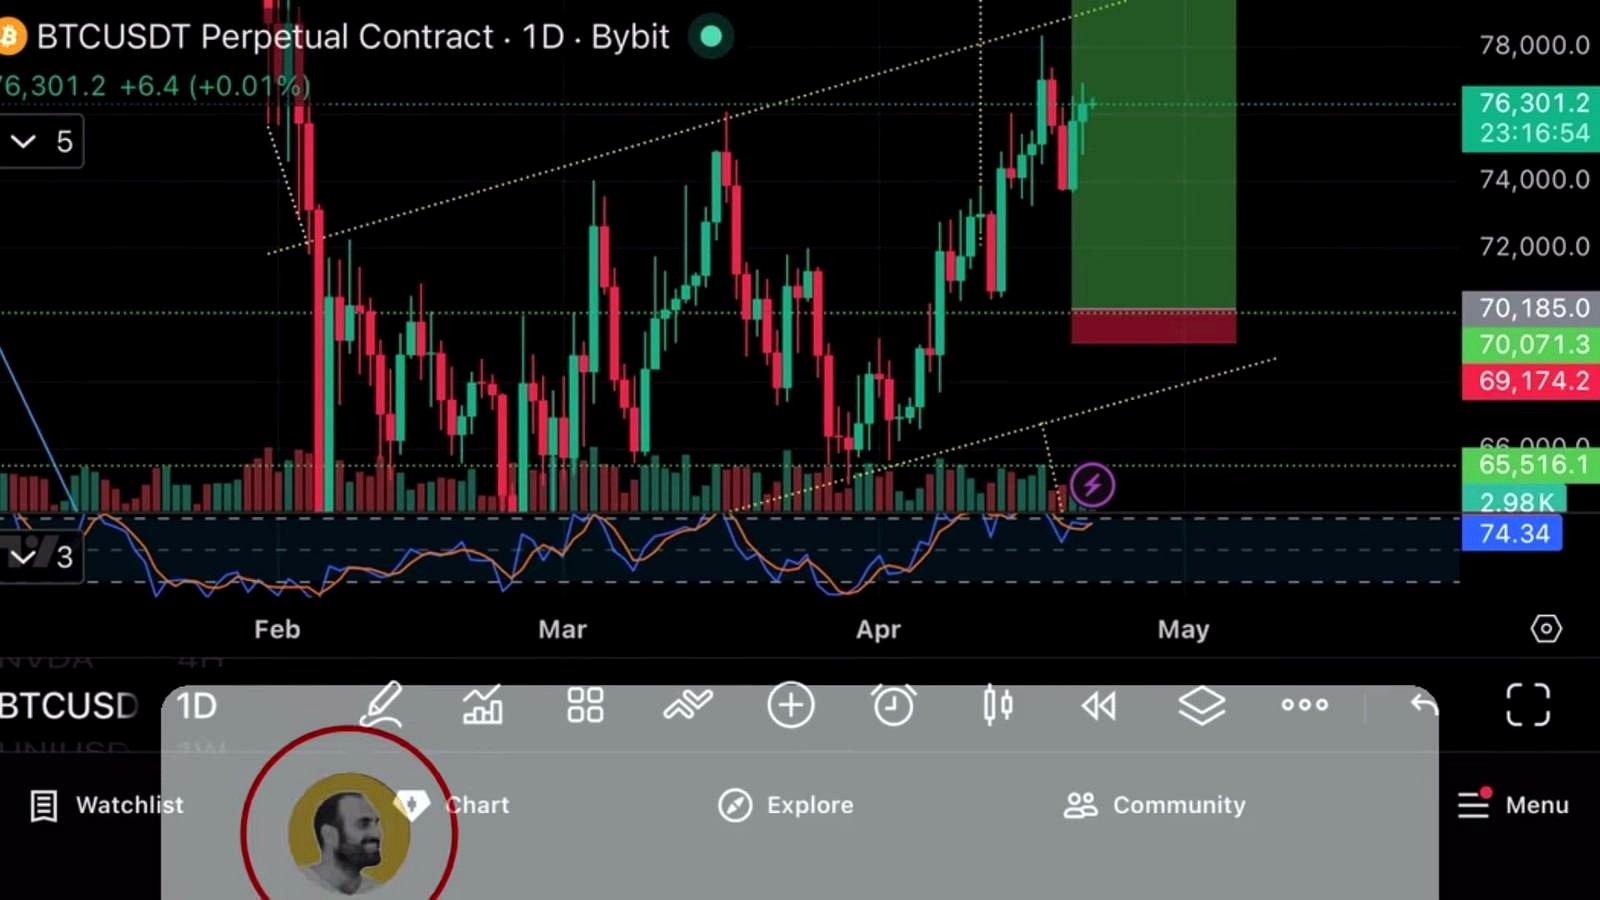
Shorter term, he was more cautious. On the four-hour chart, he said Bitcoin was still heading up but also showed “a little bit of a head and shoulders, ” implying the market could see a near-term pullback before any broader continuation. That makes the near-term path heavily dependent on whether support zones hold during the next wave of volatility.
The Ethereum side of his view is cleaner. According to James Crypto Guru, ETH has already broken out of a symmetrical triangle on both the weekly and daily timeframes, with a measured target of $2,900. He said he had laddered ETH orders at $2,100, $2,000, $1,900, and $1,800. In his own account, he said his Bitcoin trade was up $2,100 on a position of 1.5 BTC, which he valued at around $114,000, while his Ethereum trade was up $570. He also said he had taken about $6,000 in profits on a previous BTC trade around the 20th before reopening.
One more part of the video is worth separating from the trade thesis: he said AI models in his group had switched long on Bitcoin, including one long entry at $76,000. That may be relevant to his process, but for readers the more important point is that his positioning remains net bullish despite the daily chart warning.
What Could Go Wrong
The obvious failure case is the one the analyst himself outlined: the daily bear flag breaks down and the higher-timeframe oversold bounce fails to develop into a durable reversal. In that scenario, Bitcoin would not just dip into his laddered entries but could slice through them, making the $38,000 measured-move target a live risk rather than a remote tail case.
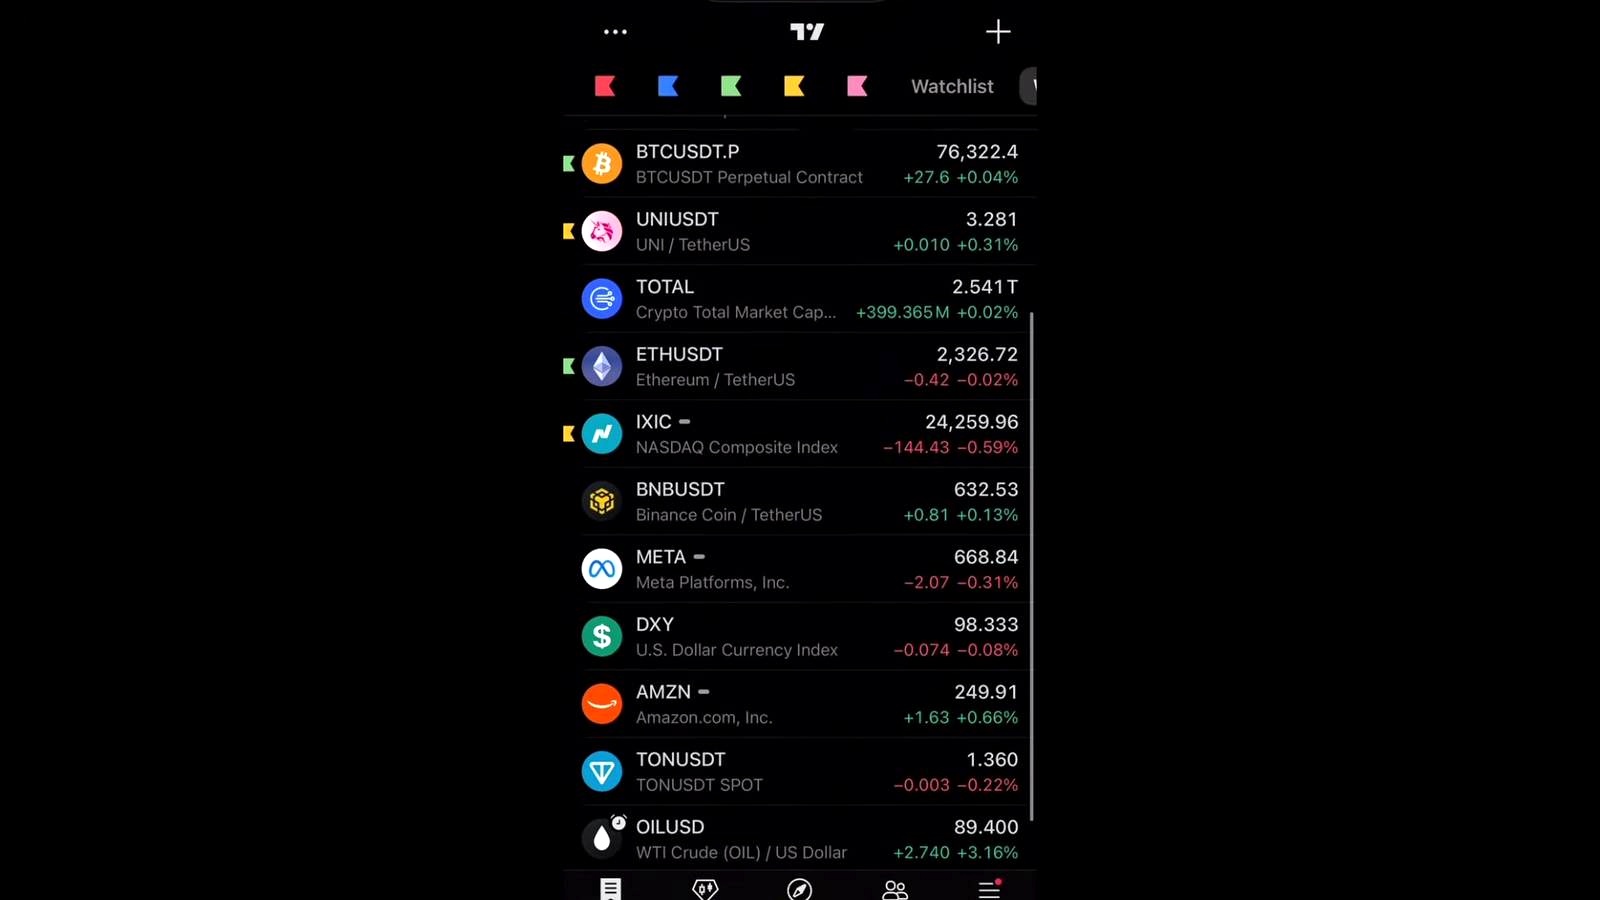
There are also risks he touched on only indirectly. He linked market weakness to ceasefire concerns and broader geopolitical headlines. That matters because crypto can trade like a high-beta macro asset during periods of stress. A sudden equity drawdown, a spike in oil, or a flight into dollars and Treasuries can overwhelm even attractive technical setups. If BTC starts correlating more tightly with Nasdaq weakness instead of decoupling from it, the bullish weekly argument weakens fast.
Another issue is indicator conflict. Weekly oscillators turning up can stay early for longer than bulls expect, while daily sell signals often matter more for traders operating on shorter horizons. If spot demand does not show up around the support zones he listed, “oversold” can turn into “staying weak.” And while Saylor-related buying can support sentiment, relying on a single headline or buyer to offset broader macro selling is rarely enough.
The other side of this trade is simple: bears will argue that resistance held, the daily pattern is clearer than the weekly rebound case, and any bounce toward the low $80,000 area could be a sellable relief rally rather than the start of a new trend leg.
What to Watch Next
The first trigger is whether Bitcoin can hold the support cluster between $72,000 and $65,000. That is where James Crypto Guru has concentrated his laddered bids, and it is the zone that would need to attract buyers if the weekly thesis is going to work.
Above, traders will watch whether BTC can reclaim and sustain momentum toward $83,000, his take-profit level. Failure to do that, combined with a confirmed breakdown from the daily flag, would shift attention back to much lower downside projections. On the macro side, keep an eye on geopolitical headlines, oil, and whether Bitcoin continues outperforming large-cap tech during risk-off sessions. If that relative strength fades, the bullish case becomes harder to defend.
FAQ
What is a bear flag in Bitcoin trading?
A bear flag is a continuation pattern that usually forms after a sharp decline. Price then consolidates upward or sideways in a narrow channel before potentially breaking lower again. Traders often estimate the downside target by measuring the prior drop, known as the flagpole, and projecting it from the breakdown point.
What does an oversold weekly stochastic mean?
The stochastic oscillator is a momentum indicator. When it is oversold on a weekly chart, it suggests selling pressure may be exhausted relative to recent price action. Traders often treat a turn higher from oversold conditions as an early sign of recovery, though it is not a guarantee that price has bottomed.
How is a symmetrical triangle target calculated for Ethereum?
Traders generally measure the height of the triangle at its widest point and then project that distance from the breakout level. In the video, James Crypto Guru applied that method to ETH and arrived at a target of $2,900.
Why would Bitcoin rise while tech stocks fall?
That can happen when Bitcoin-specific demand is stronger than broader risk sentiment, such as during periods of corporate buying, ETF inflows, or improving crypto market structure. It can also reflect temporary decoupling. But that divergence does not always last, especially if macro stress intensifies.
What would invalidate a bullish Bitcoin trade near these levels?
A clean break below key support with no strong rebound is the clearest invalidation. In the framework discussed here, that means Bitcoin failing to hold the laddered buy zone between $72,000 and $65,000, while the daily bear flag confirms to the downside and BTC loses its recent relative strength versus other risk assets.
Content Source

Omar Al-Sharif lives and works in the UAE and is involved in the blockchain technology industry. He writes articles on Bitcoin and digital assets as a personal passion, explaining complex topics in simple and understandable language.


