After a sharp relief bounce, the question for traders is whether Bitcoin just reclaimed momentum or walked into another bull trap. Coin Bureau Trading argues the latest move looks more like a local top than the start of a fresh leg higher, a call that matters because BTC is again pressing levels that have repeatedly flipped from support to resistance.
Why the latest Bitcoin bounce may be a pivot, not a breakout
According to Coin Bureau Trading, Bitcoin is showing a “strong case” for a pivot high after a news-driven rally of more than 5% on Monday. The analyst ties that view to a cluster of signals: a crypto fear and greed index reading of 21, weakening momentum on a fast RSI setting, stretched price action into resistance, and an on-balance volume setup that he says has previously coincided with local tops.
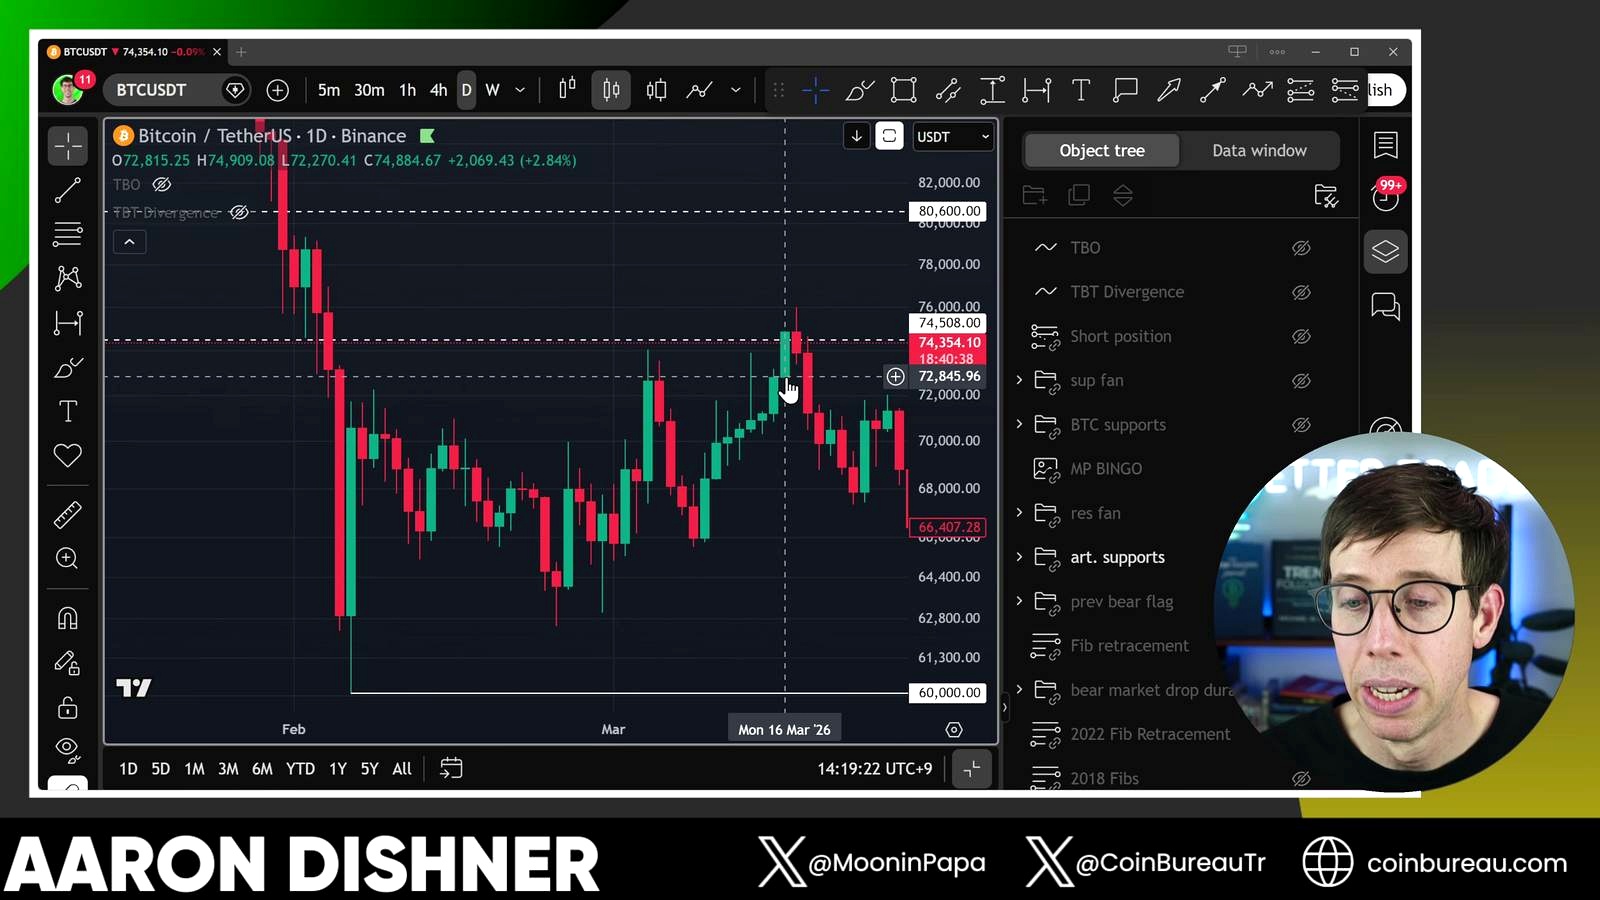
The core of the thesis is not that Bitcoin cannot trade slightly higher from here. It is that the quality of the rally has deteriorated. The analyst notes that Bitcoin previously made a large up day of 6.3% on March 4 before rolling over, and then pushed into another pivot high on March 17. On his preferred RSI length of 7, he says the March 4 move peaked at 69.75 and was followed by an 11% drop, while the March 16 setup reached 76.83 before a short-term decline of around 10% and a deeper move closer to 15%.
By contrast, this week’s rally reached roughly $74,900, below the earlier push toward $76,000, while RSI failed to get back above 70 despite a green candle of 5.2%. That is a classic bearish momentum divergence argument: price nearly retests prior highs, but the oscillator does not confirm.
In broader market context, that is a cautious-to-bearish interpretation rather than consensus. Many traders still treat sharp recoveries after headline-driven selloffs as signs of resilience, especially when institutional flows and macro liquidity remain constructive over the medium term. But short-term divergences often matter most when Bitcoin is retesting a breakdown area. If a rally cannot regain prior support cleanly, the market can slip from recovery into distribution very quickly.
Resistance, trade levels, and the path Coin Bureau Trading is mapping
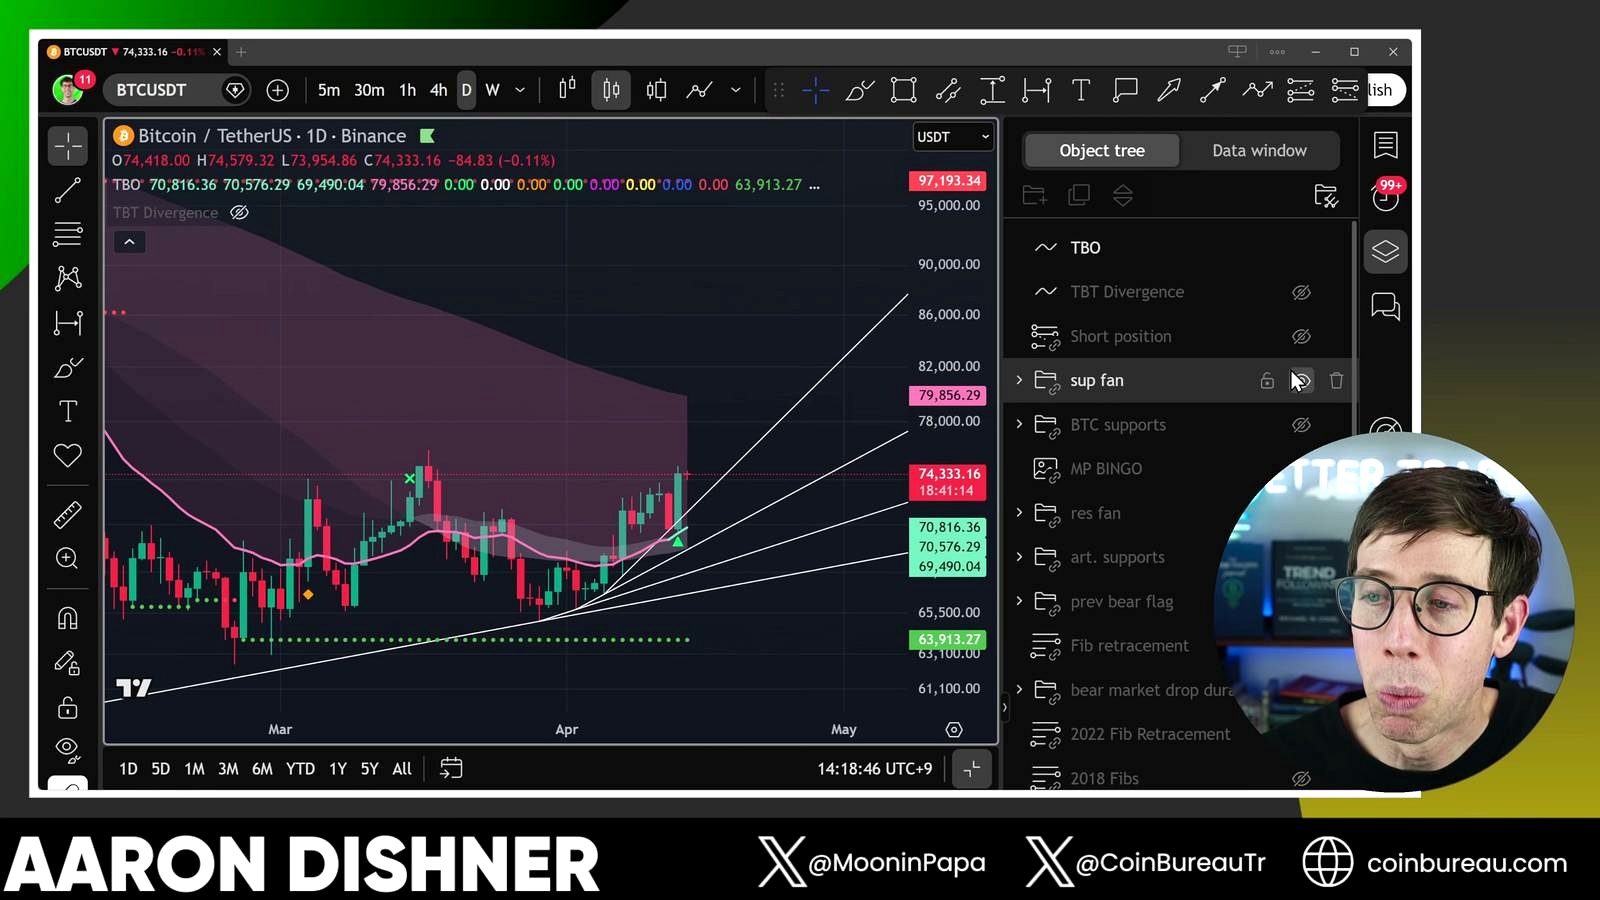
According to Coin Bureau Trading, the immediate technical battleground sits near a former pivot area around $74,500 to $74,58 as cited in the video, which the analyst describes as a prior artificial support that later turned into resistance. Bitcoin briefly pierced that zone around the 16th and 17th, but failed to hold it, and he says BTC then closed just below it.
That level drives the near-term map. If Bitcoin closes and holds above roughly $74,58, the analyst says the next upside target is the TBO slow line near $80,600. He does not expect that scenario to play out, but he leaves room for a marginal move higher first.
His preferred downside path starts with the TBO fast line at $71,818, which he describes as the first pullback target and roughly a 4.7% decline from the price at the time of recording. A move there would also break the first support fan line, which he characterizes as weak but still important as an early sign that the rebound is failing. Once that gives way, he argues, the odds rise that Bitcoin starts breaking lower supports in sequence.
From there, the analyst points to much deeper downside targets of $60,000, then $49,000, then $38,55 as stated in the transcript. He frames that roadmap within a broader bear-market thesis, arguing that Bitcoin fell from above $100,000 to $74,000, a drawdown of 32%, and that the current rebound resembles prior “fake rally” behavior.
He extends that framework beyond Bitcoin. On Ethereum, he highlights a run from the 9th to the 16th of 23%, followed by an 8% daily close, with RSI hitting 84.03 at the earlier top. The latest ETH push, he says, only got RSI to 70.83, even as price ran back into resistance. That cross-market weakness is relevant because BTC reversals often become more credible when ETH and broader risk sentiment also lose momentum.
What could go wrong with this bearish Bitcoin call
The cleanest invalidation is straightforward: Bitcoin reclaims the breakdown area and holds it. If BTC can close above roughly $74,500 to $74,58 and then continue toward $80,600, the bearish divergence case weakens fast. Momentum divergences are useful, but they fail often in strong uptrends. Markets can stay overbought longer than bears expect, especially after panic unwinds.
There is also a structural counterargument the analyst touches only partly: a local pivot high does not automatically imply a full bear-market continuation to $60,000, $49,000, or below. Bitcoin has repeatedly printed sharp corrections inside larger bullish cycles, then resumed higher once spot demand returned. In practice, a pullback to the low $70,000s could happen without validating the more aggressive downside targets.
Another risk for the bearish thesis is macro. If bond yields ease, equity markets stabilize, and crypto-specific flows improve, Bitcoin can absorb technical overbought readings that would otherwise trigger larger reversals. Short squeezes can also extend further than expected. The analyst explicitly mentions that Monday’s rally was news-driven and references Iran, which underlines the point: headline markets can reverse technical setups just as quickly as they create them.
Finally, his larger bear-market clock is debatable. He argues Bitcoin is only 190 days into a downturn from an October 6 top at 126 199 as stated in the transcript, and compares that with prior bear markets of roughly 50 to 52 or 54 weeks. But cycle compression is a live debate in crypto. ETF demand, derivatives market structure, and growing macro integration may make older four-year analogs less reliable than they once were.
What to watch next
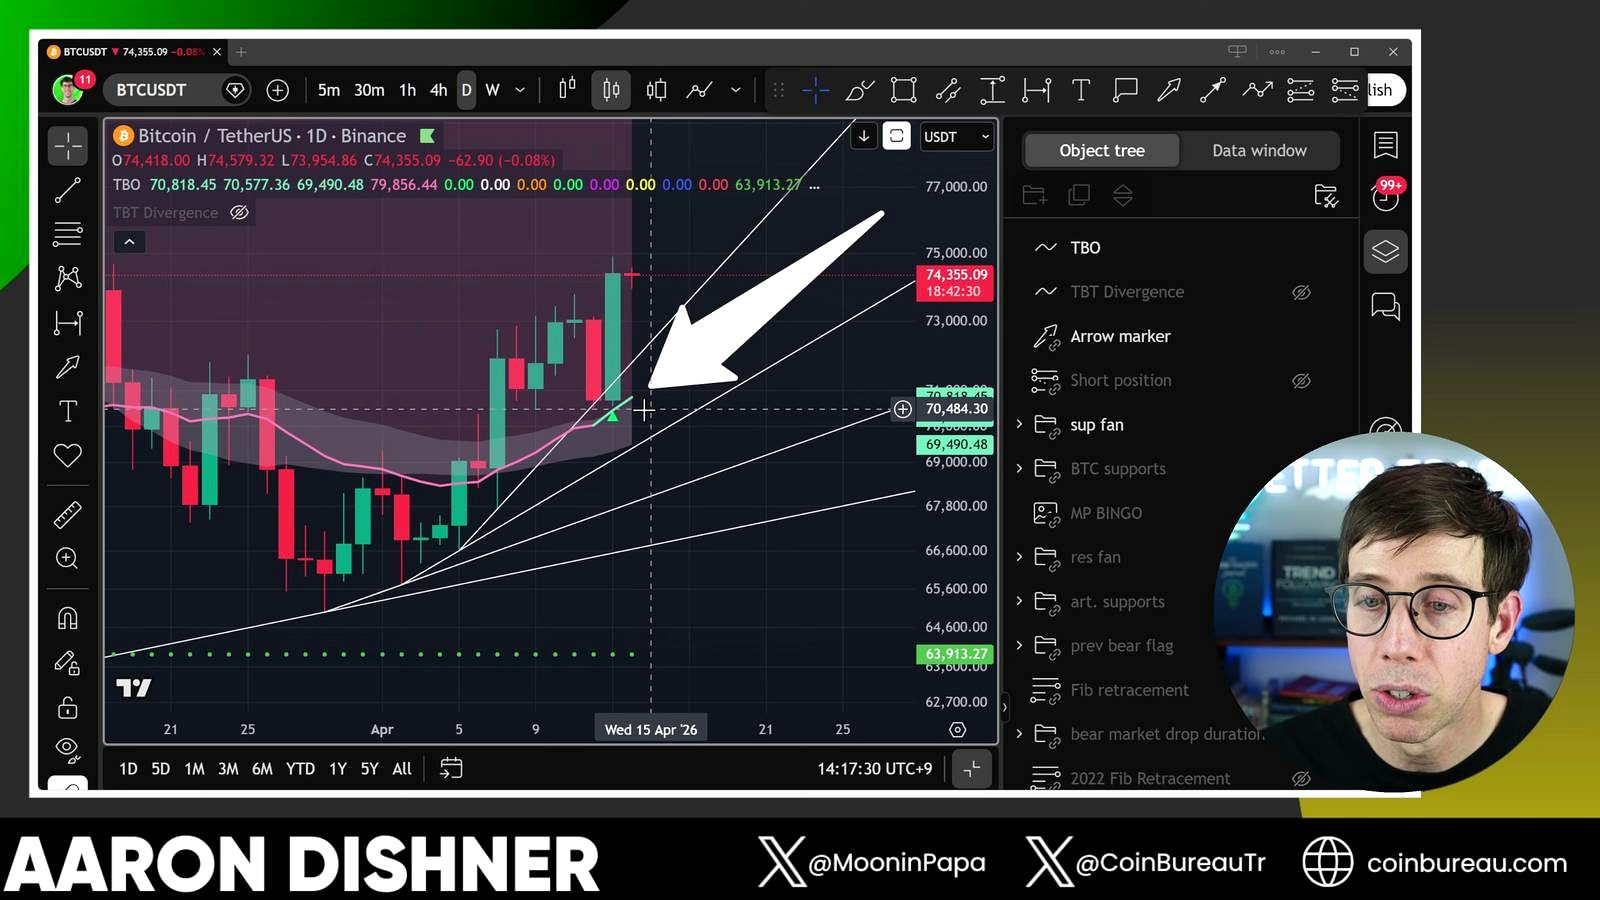
The first trigger is whether Bitcoin loses $71,818, the analyst’s TBO fast-line target. A clean move there would support the idea that the latest rally was a local exhaustion event. The second is whether BTC can reclaim and hold roughly $74,500 to $74,58. That is the near-term invalidation line for the bearish setup.
Beyond price, traders will be watching whether RSI can break back above 70 with conviction instead of forming another lower high. On timing, the analyst expects weakness into May and June, with the possibility of a reversal rally in July if the market follows patterns seen in prior bear cycles. That makes the next few weekly closes more important than any single intraday spike.
FAQ
What is a pivot high in Bitcoin trading?
A pivot high is a local top where upward momentum stalls and price starts reversing lower. Traders look for it near resistance, especially when indicators like RSI or volume stop confirming new highs.
What does RSI above 70 usually mean for BTC?
RSI above 70 is commonly treated as overbought, meaning price may have run too far too fast. It does not guarantee a drop, but it can warn that momentum is stretched and vulnerable to reversal.
How is on-balance volume used in crypto analysis?
On-balance volume, or OBV, tracks whether volume is flowing more on up days or down days. If price rises but OBV weakens or flattens, traders may read that as a sign the rally lacks conviction.
Why does reclaimed support turning into resistance matter?
When a former support level breaks, traders often expect it to act as resistance on the next bounce. If price cannot hold above that area, it suggests sellers are still defending it and the trend has not truly reversed.
How does this setup compare with previous Bitcoin corrections?
It resembles prior episodes where Bitcoin staged a sharp relief rally into resistance, printed weaker momentum than at the prior peak, and then rolled over. The difference this time is that the market is also digesting a more mature institutional backdrop, which could make old cycle comparisons less precise.
Video Reference

Omar Al-Sharif lives and works in the UAE and is involved in the blockchain technology industry. He writes articles on Bitcoin and digital assets as a personal passion, explaining complex topics in simple and understandable language.


