Is Bitcoin following its usual bear-market script, or is this cycle already bending the rules? A new video from Wolves of Crypto argues that the key tension is no longer the death cross itself, but whether a dense wall of support around $60,000 can keep breaking old patterns.
According to Wolves of Crypto, Bitcoin is approaching a critical point where one of the market’s better-known bearish signals may simply fail to play out on schedule. The host’s central claim is straightforward: if the current 3-day death cross is supposed to lead Bitcoin to the bottom of its next macro range, time is running out fast.
The big takeaway: the death cross trend is close to invalidation
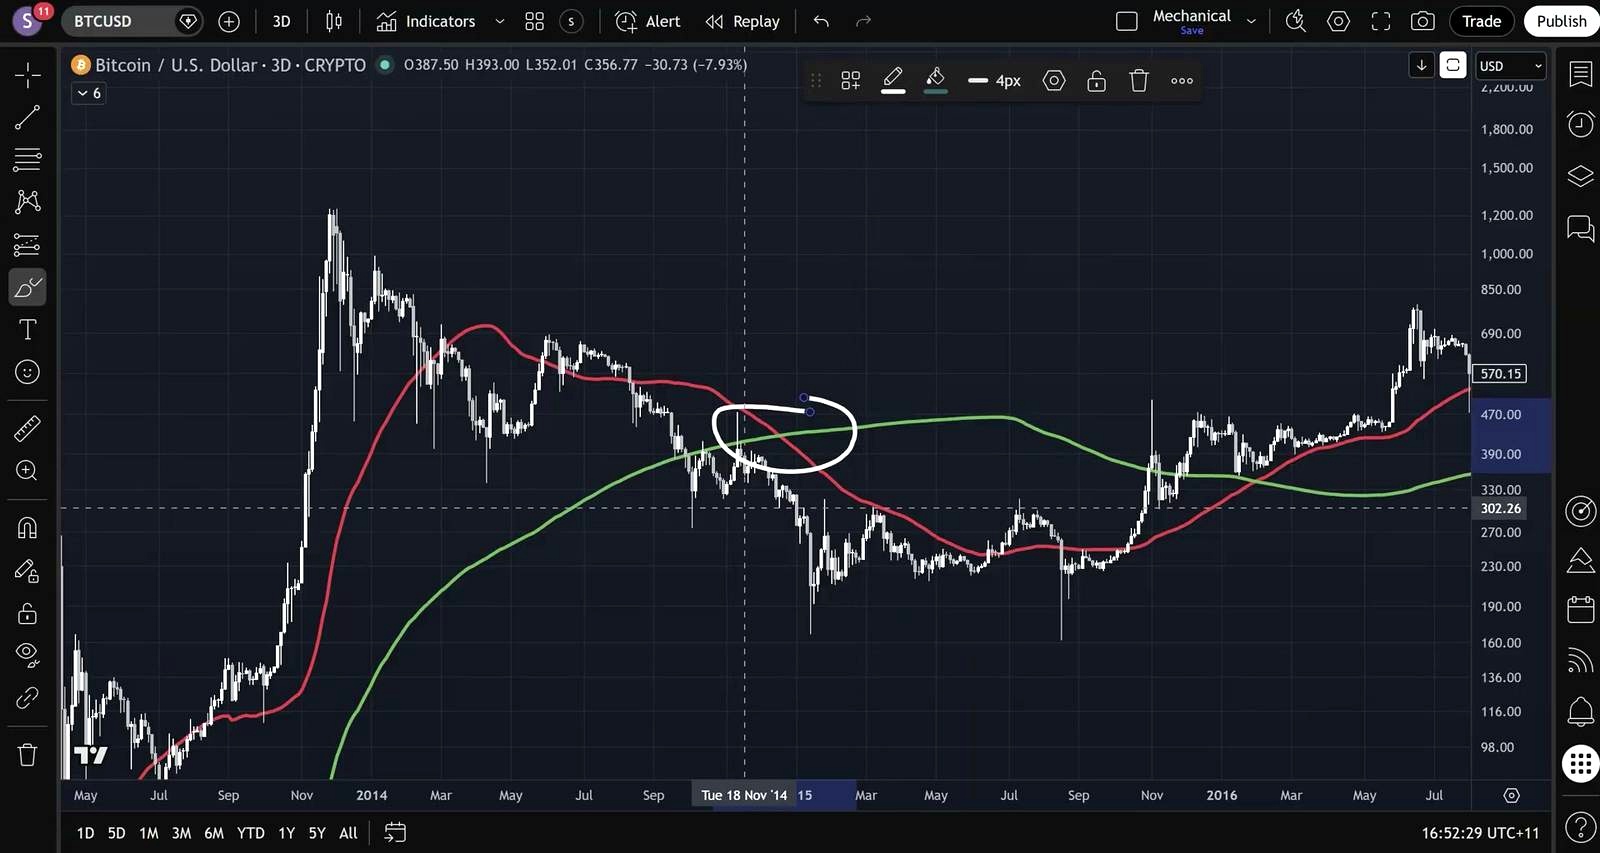
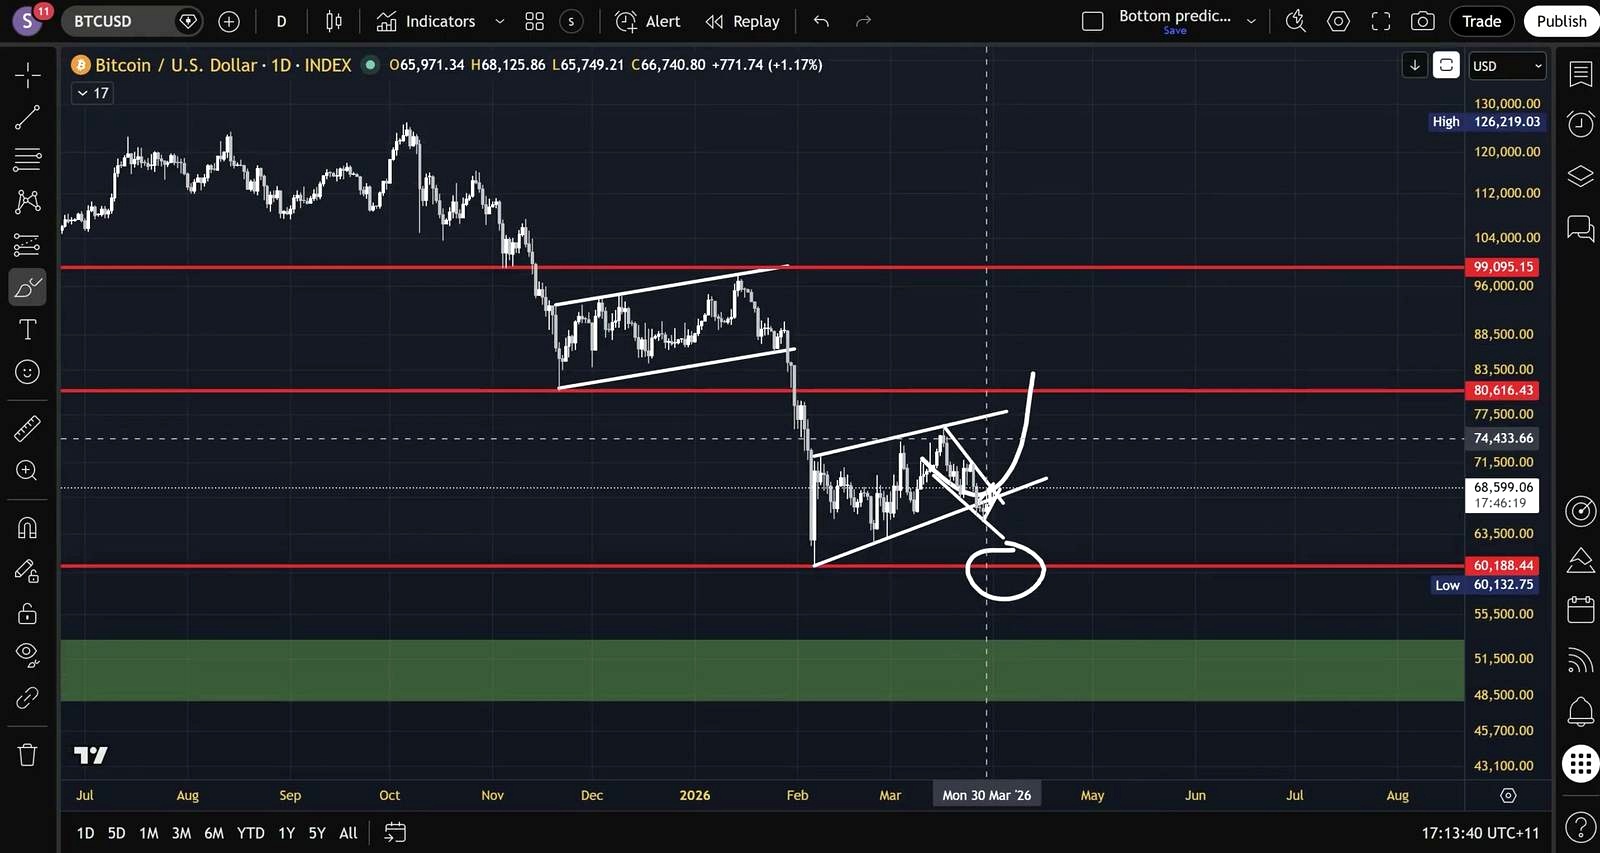
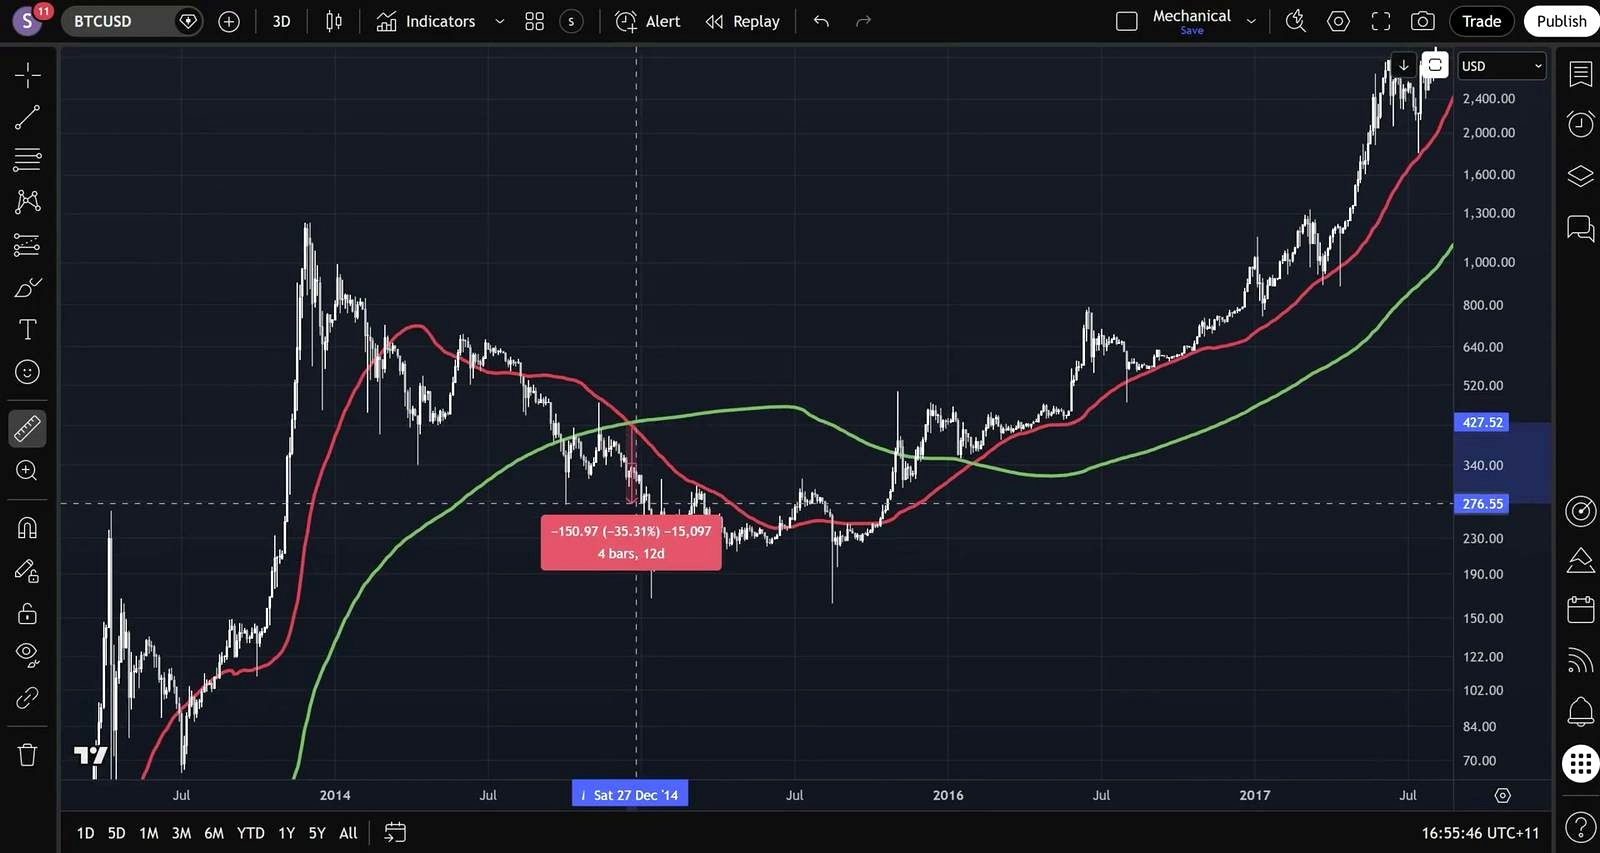
Wolves of Crypto argues that the 3-day chart death cross has historically been followed by a move into Bitcoin’s next major macro low within a fairly tight window. In prior cases, that pattern appeared in 2014, 2018, and 2022. This time, however, the market is not behaving the same way.
The host says the usual timeline for that setup is 25 to 32 days from the death cross to the bottom of the next macro range. The previous occurrences came in at 25 days, 30 days, and 32 days. Based on that history, he allows for a maximum extension of roughly 5 days, taking the outer boundary to about 37 days.
Bitcoin is already at roughly 31 days since the signal, he says, yet price is not only failing to make a new macro low, it is still above where it was when the death cross appeared. In his view, once the market starts stretching into 40, 45, or 50 days, the pattern stops being useful.
That matters because the death cross, as he frames it, is not just supposed to coincide with weakness. It is supposed to lead to the bottom of the next range. If that destination is not reached within the historical time window, the signal loses its value.
Why this cycle may be acting differently
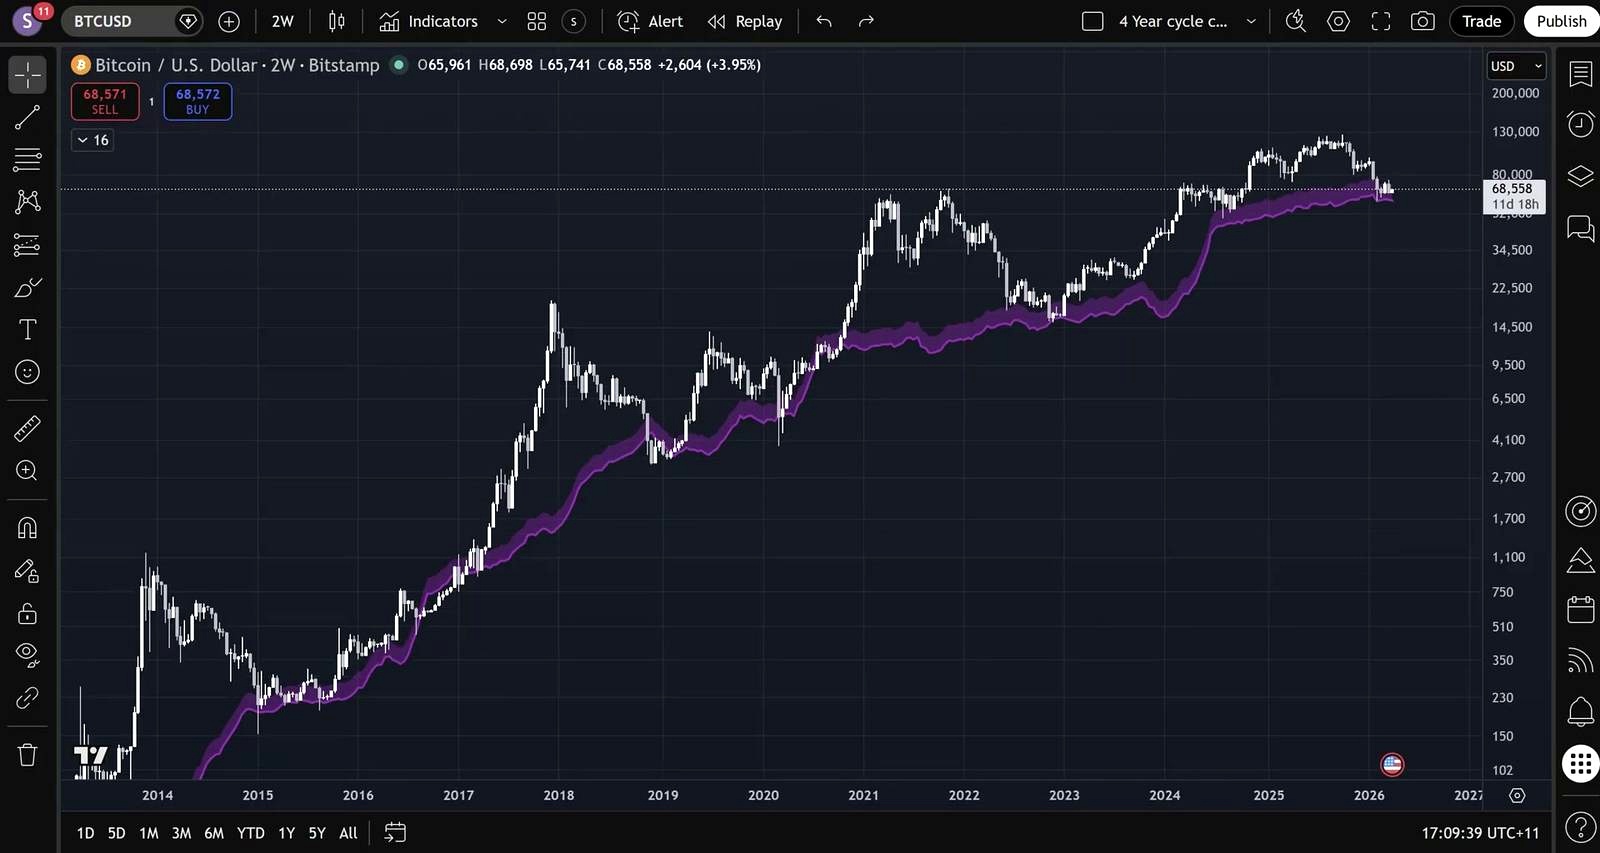
Wolves of Crypto says the answer is not that Bitcoin suddenly turned bullish. He still thinks the broader bear-market cycle remains intact and says he ultimately expects lower prices later. But he argues that this specific stage of the cycle may be unfolding differently because Bitcoin is sitting on unusually strong, layered support.
That support, in his telling, is concentrated around $60,000. He points to four separate forms of support clustering in the same area:
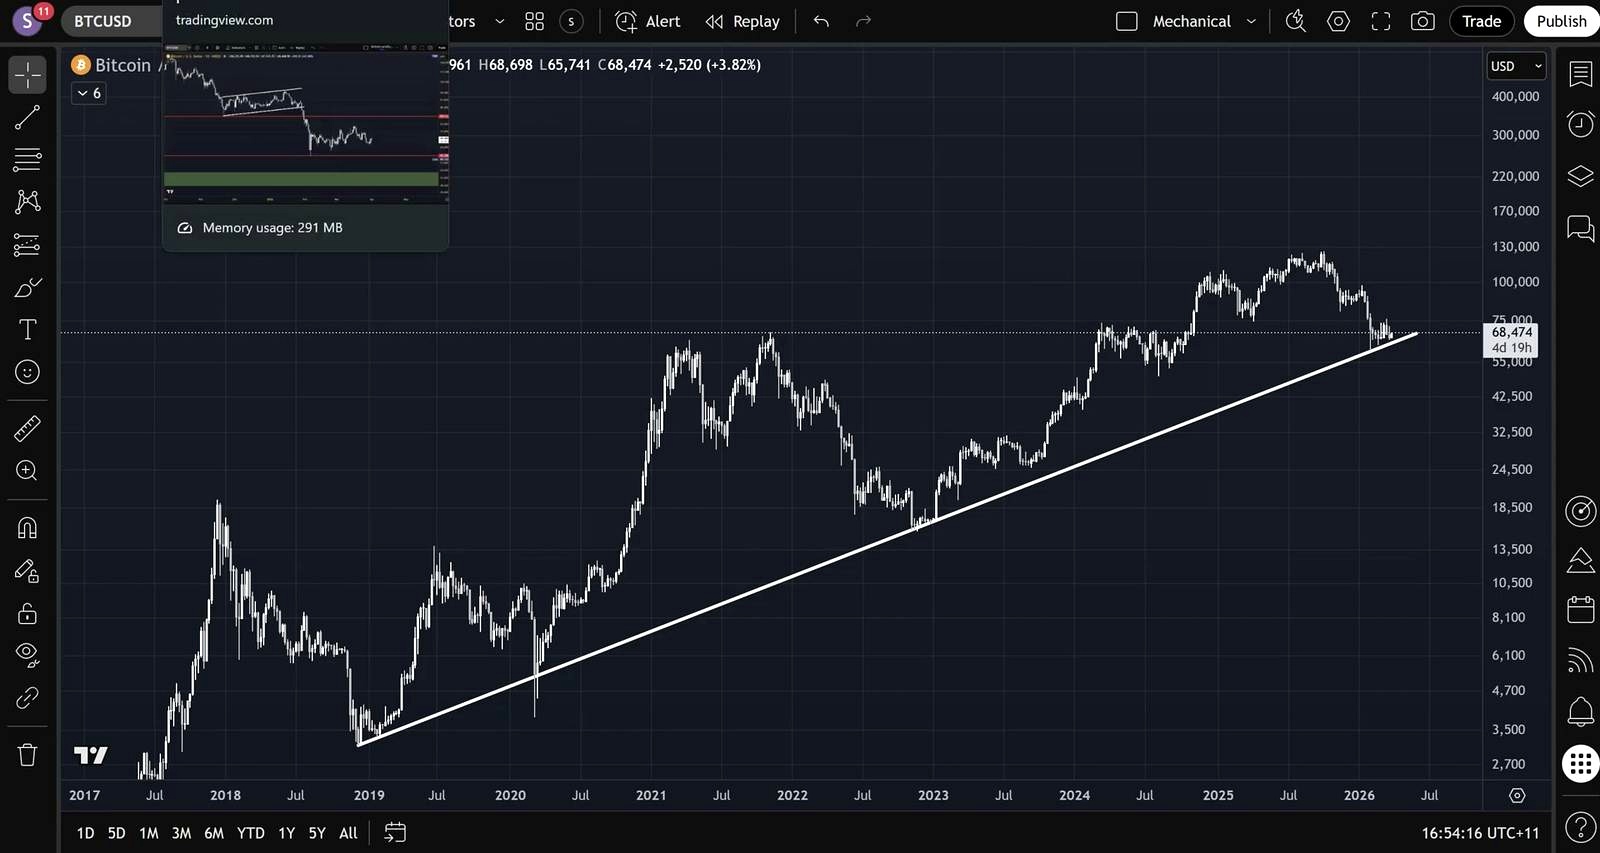
- A long-term support line that, he says, has held since the 2018 bear market and also runs through the COVID-era drop and 2022
- A second major support line dating back to 2019
- A Bitcoin cost-of-production indicator
- A power law support zone sitting just below $60,000
The host’s argument is that this stack of support did not exist in the same way during prior examples of the death cross trend. In earlier cycles, support was not “this big, ” “this unique, ” or “this layered.” That, he says, is likely why several historical analogues are starting to deviate at the same time.
Short-term fractals are getting messy too
Wolves of Crypto also highlights a second warning sign for traders relying too heavily on pattern repetition: shorter-term fractals are no longer cleanly matching previous market structure.
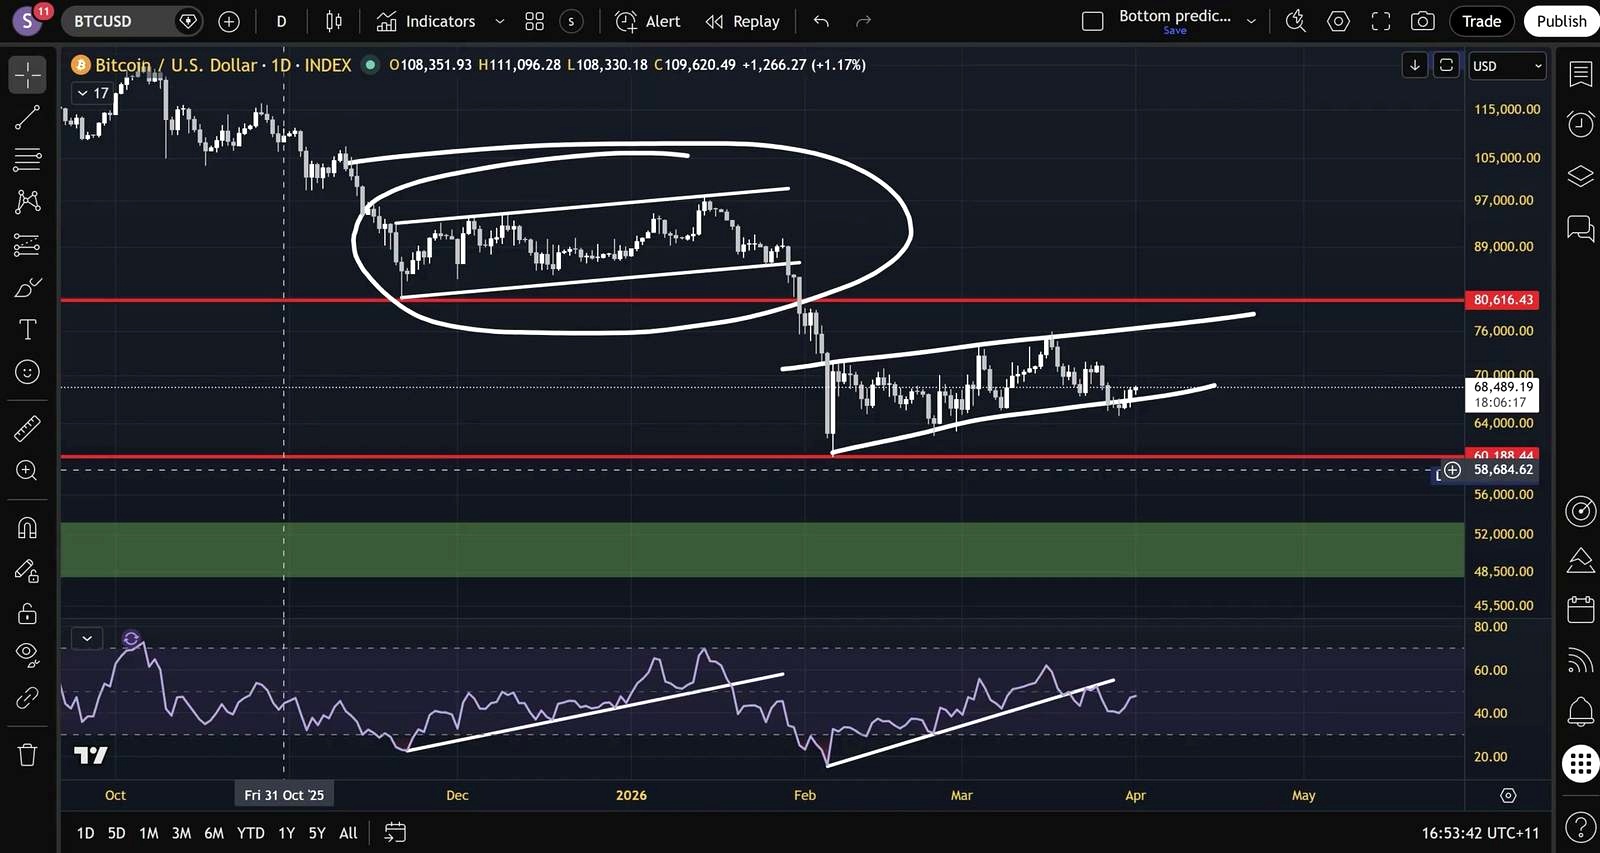
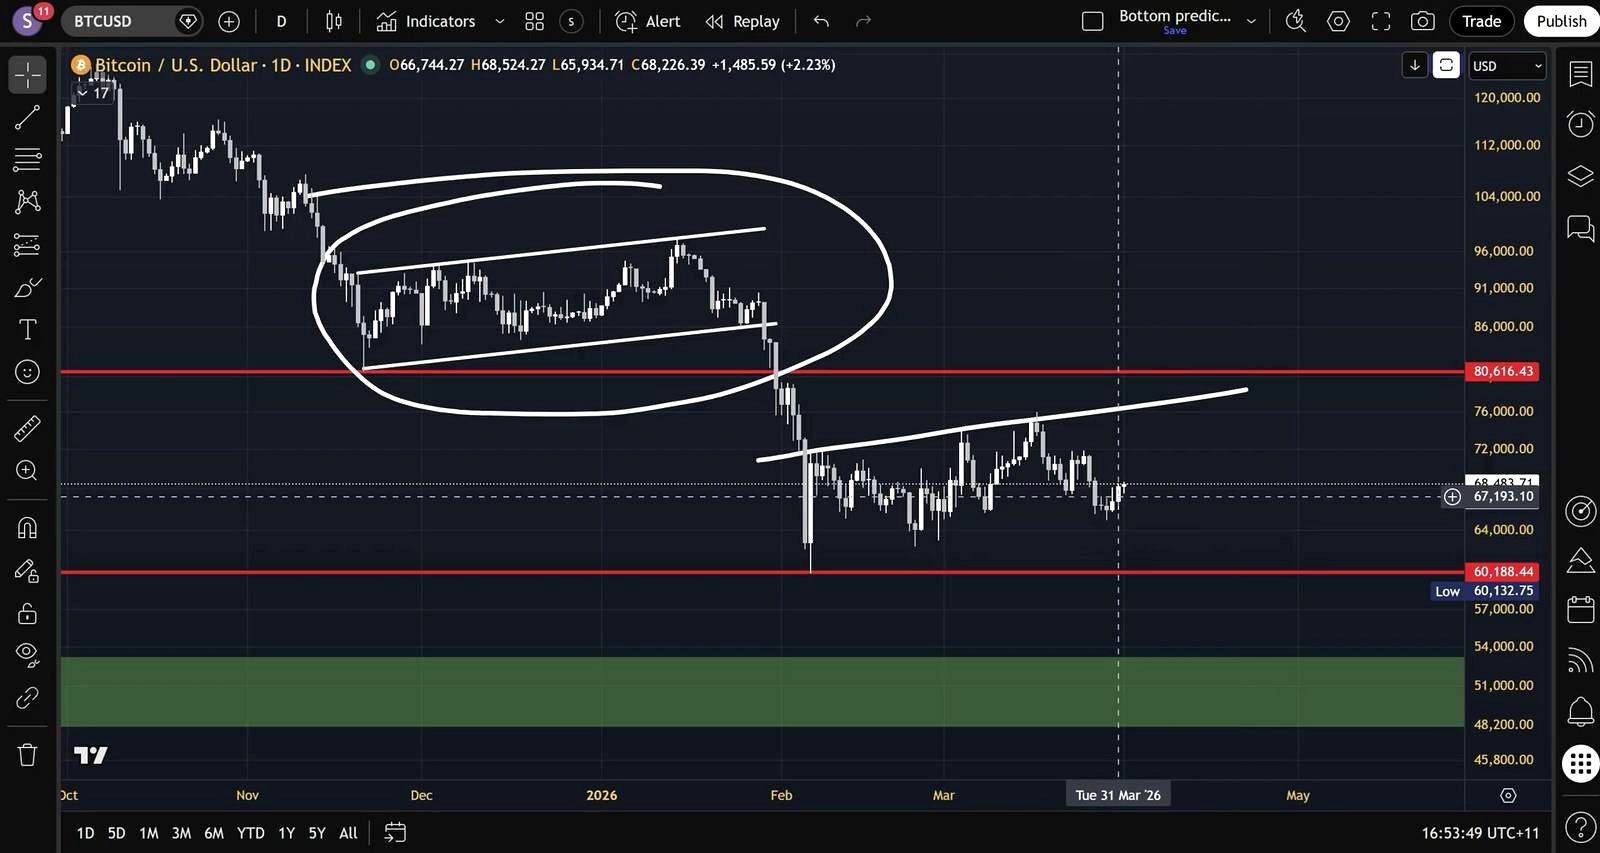
He compares two major Bitcoin ranges: $80,000 to $100,000 and $60,000 to $80,000. In his telling, both ranges shared the same broad anatomy. The top of one range acted as support from the prior range, the bottom was defined by the selloff that brought price into that range, and the internal structure was dominated by an ascending channel.
For a while, that comparison held. Then it stopped. What looked like a breakdown instead turned into a fakeout, followed by a move back upward on the short-term chart. On lower time frames, the host says the structure has become confused enough that multiple patterns can be drawn at once, including a descending channel and an ascending broadening formation, and each appears valid based on repeated touches.
His point is not that one specific short-term pattern now guarantees upside. It is that the market has become messy enough that short-term chart interpretation is losing clarity.
The 2022 comparison is weakening, not broken
The host makes a similar point about a separate fractal based on Bitcoin’s 2022 price action. He says that setup had been tracking well through the first two stages of a five-step pattern, but now appears to be diverging on step three.
Instead of the horizontal consolidation seen in 2022, the current market looks more like a channel. He describes that as a structural change that could damage the usefulness of the fractal, although he stops short of saying the comparison is fully broken. Liquidity ranges are still being respected, he says, which leaves room for debate.
Still, the broader message is consistent: historical templates that looked reliable just weeks ago are becoming less reliable as Bitcoin interacts with this unusually dense support zone.
Why the analyst still favors the cycle over bullish reversal calls
Even with support clustering at $60,000, Wolves of Crypto does not argue that Bitcoin has already bottomed. In fact, he pushes back against that conclusion.
He says one support model, the cost-of-production indicator, could lead some to call for the end of the bear market. He disagrees for two reasons. First, a full reversal here would require a break from the normal cyclical pattern, and he prefers to side with the existing cycle rather than bet against it. Second, he says that indicator was built in hindsight to line up with previous lows, which weakens its predictive value.
For that reason, the host keeps returning to the same macro framework: trust the cycle first, and treat the noise inside the range as secondary.
The levels that matter most now
According to Wolves of Crypto, the market is now simple in one sense, even if it looks chaotic on lower time frames. He says almost everything that happens inside the current range is less important than two levels:
- $60,000 on the downside
- $80,000 on the upside
In his framework, a break below $60,000 would mean continuation of the broader bear-market cycle and likely validate the idea that lower prices are still ahead. A break above $80,000 would be the first meaningful sign that the bullish case deserves more attention and that this cycle may be weaker than usual on the downside.
He also ties the bigger macro question to timing, saying the main long-term issue is whether Bitcoin reaches its macro low in October. Beyond that, he sees most of the intrarange action as noise unless one of those two boundaries gives way.
What to watch next
The immediate watchpoint is the death cross clock. If Bitcoin is going to fulfill the historical pattern described by the host, it would need to move quickly toward the next macro range low within the remaining few days of that 37-day outer window. He says that would likely require a far more dramatic catalyst than the market is currently showing.
The other watchpoint is whether $60,000 continues to absorb pressure. If it does, the current cycle may keep drifting in a more drawn-out and structurally unusual way. If it breaks, the macro bear-market script reasserts itself. If $80,000 breaks first, the conversation shifts toward whether Bitcoin is resisting its usual cycle behavior more deeply than expected.
FAQ
What exactly is the death cross setup discussed here?
It is a 3-day chart moving-average crossover that Wolves of Crypto says has historically preceded Bitcoin reaching the bottom of its next macro range within about 25 to 32 days, with an outer limit near 37 days.
Did Wolves of Crypto call for an immediate Bitcoin rally?
No. The host says support around $60,000 may be disrupting historical bearish patterns, but he still believes Bitcoin is in a bear market and ultimately expects lower prices unless the market delivers stronger bullish confirmation.
Why is $60,000 such an important level in this analysis?
Because the host says four separate support frameworks converge there: a long-term line tied to major lows since 2018, another support line from 2019, a cost-of-production model, and a power law support zone just below that price.
What would make the bullish case stronger?
Wolves of Crypto says a break above $80,000 would be the first distinctive sign that bulls are regaining control and that the downside phase of this cycle may be weaker than expected.
Were specific downside targets given?
Yes. The host said the bottom of the next macro range could be at $53,000 or $48,000, though he presented those as possible areas rather than a firm target.
Source

An Indian crypto journalist covering the developments in the Bitcoin and blockchain industries. Her work helps readers understand key changes in the world of digital assets.


