Is Bitcoin setting up for another leg lower, or is this the kind of oversold stretch that traps late bears? That tension sits at the center of Thomas Boleto’s latest market update, where a bearish daily breakdown collides with signs that short-term relief could still appear.
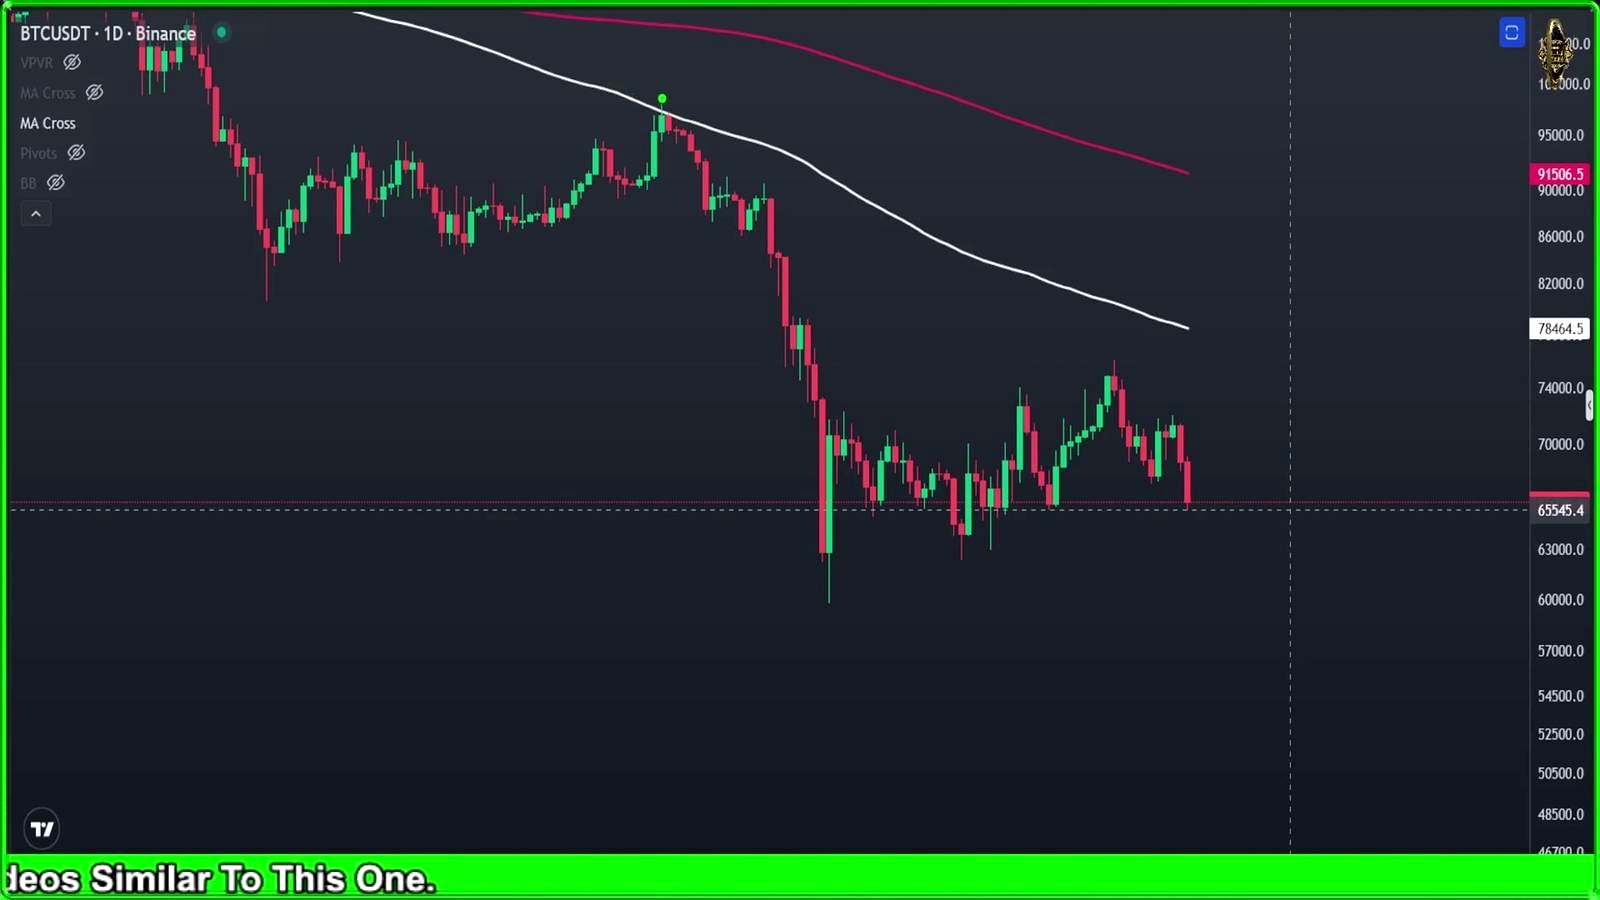
According to Thomas Boleto, Bitcoin Insights, the most important development is a break from a bearish flag on Bitcoin’s daily chart, a move he says opens the door to a deeper decline with $40,000 as the measured target. That does not mean the market drops there immediately, but in his view the pattern break is a clear warning that the current structure has weakened.
The bearish flag break is the main signal
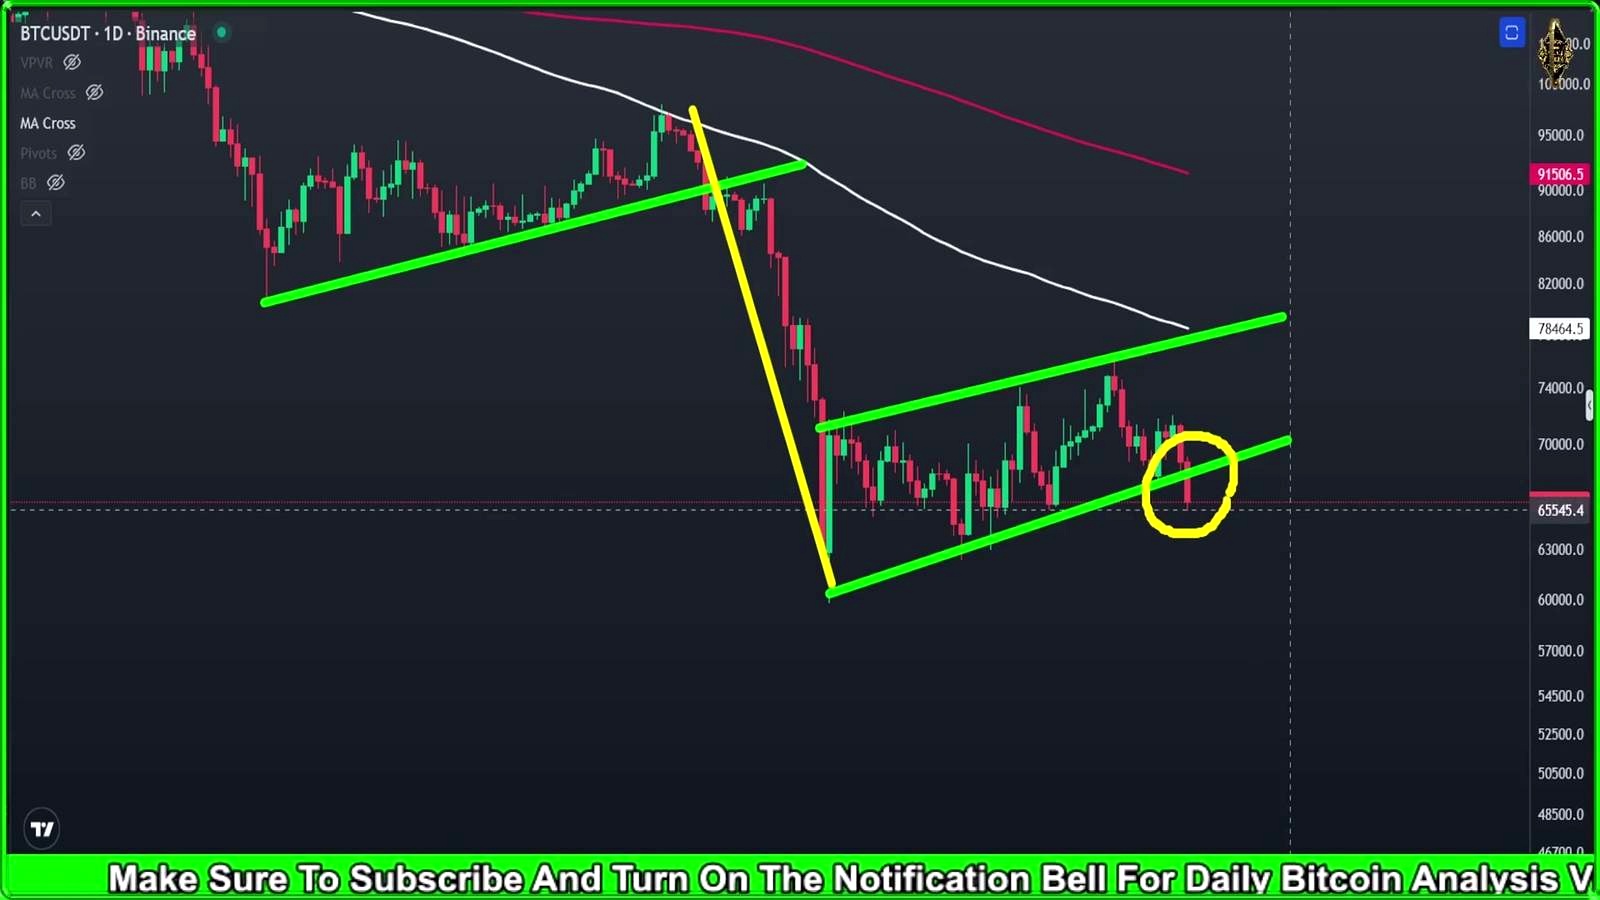
Thomas Boleto, Bitcoin Insights argues that the daily chart has shifted into a more fragile phase after Bitcoin broke down from a bearish flag formation he had been watching for several days. He frames the move as a pure price-action signal rather than a macro thesis, and he treats it as the clearest sign that downside risk is still active.
His stated target from that pattern is $40,000. He presents that as the technical objective derived from the flag, while also saying the market still needs to play out over the coming days. In other words, the target is on the table, but the path remains uncertain.
That bearish interpretation is reinforced, in his view, by momentum indicators. He says the daily MACD has turned down and the RSI has also entered a downtrend. Together, those indicators support the idea that the breakdown is not happening in isolation.
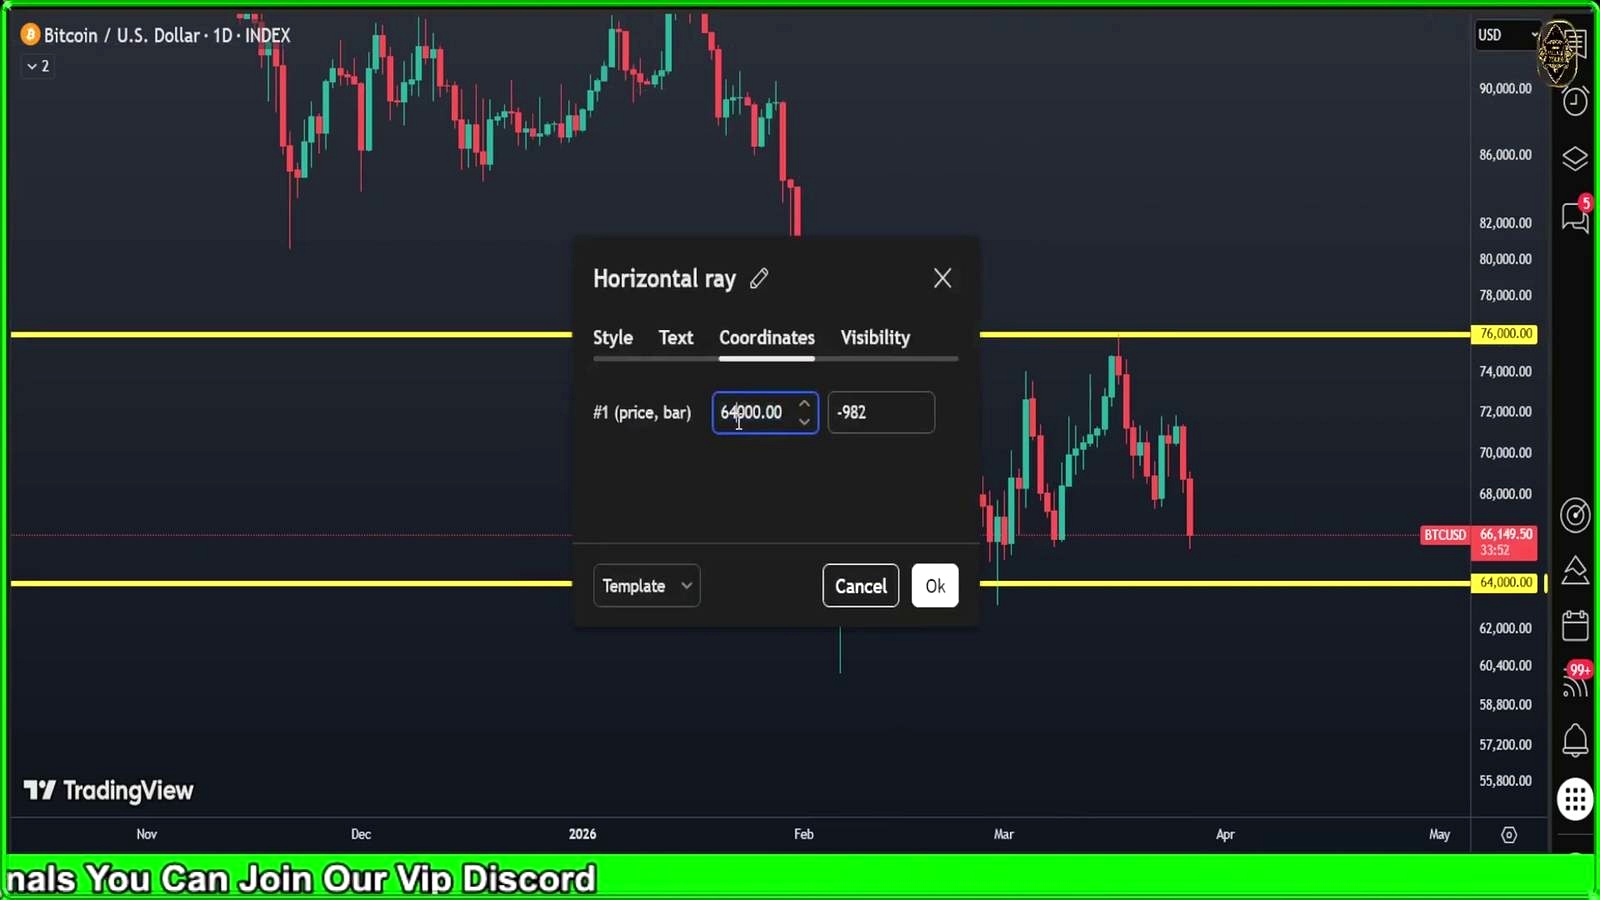
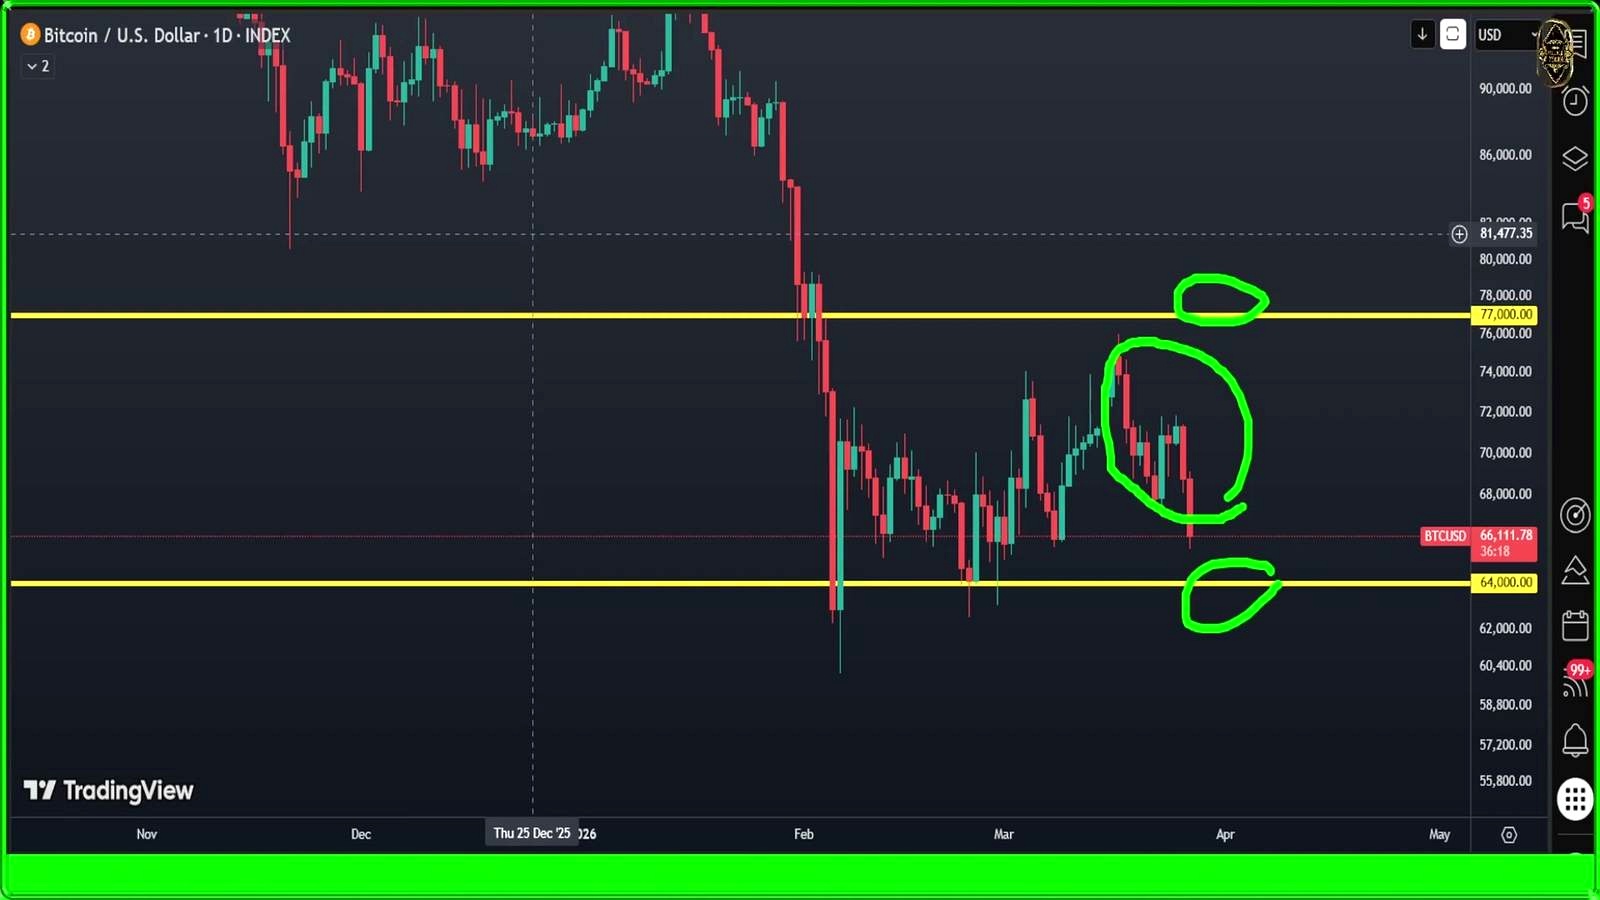
The levels that matter this week: 62K below, 76K above
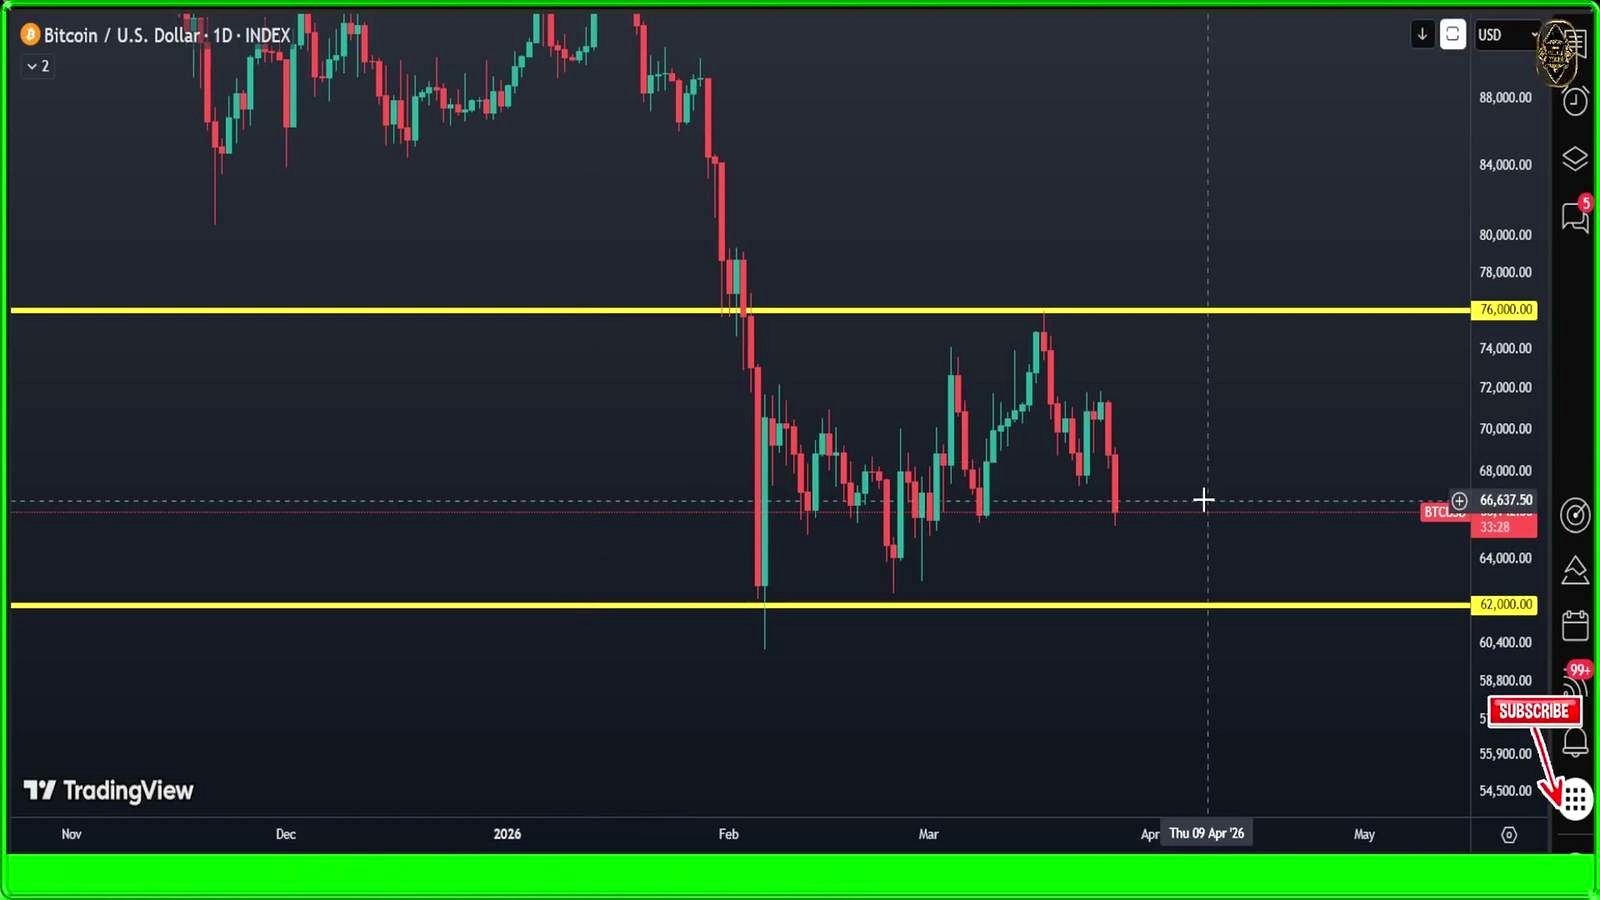
Beyond the chart pattern, the host leans on Bitcoin options positioning to define the range he thinks traders should watch next. He says the past week’s expectation was for Bitcoin to trade between $64,000 and $77,000, and at the time of recording he notes that Bitcoin was closing around $66,000 with roughly 36 minutes left on the candle.
For the coming week, he shifts focus to two new options-derived levels:
- $62,000 as the lower level
- $76,000 as the upper level
He ties those numbers to specific options data. At $62,000, he cites 376 BTC in puts, 0 calls, and total volume of $24 million. At $76,000, he cites 0 puts, 2.27K BTC in calls, and total volume of $149 million.
His takeaway is straightforward: options traders appear to be defining a broad zone between $62,000 and $76,000, while still leaving room for Bitcoin to dump further. That makes $62,000 the immediate support area he is watching, even as the larger daily pattern points lower.
Short-term charts hint at a bounce, but not a trend change
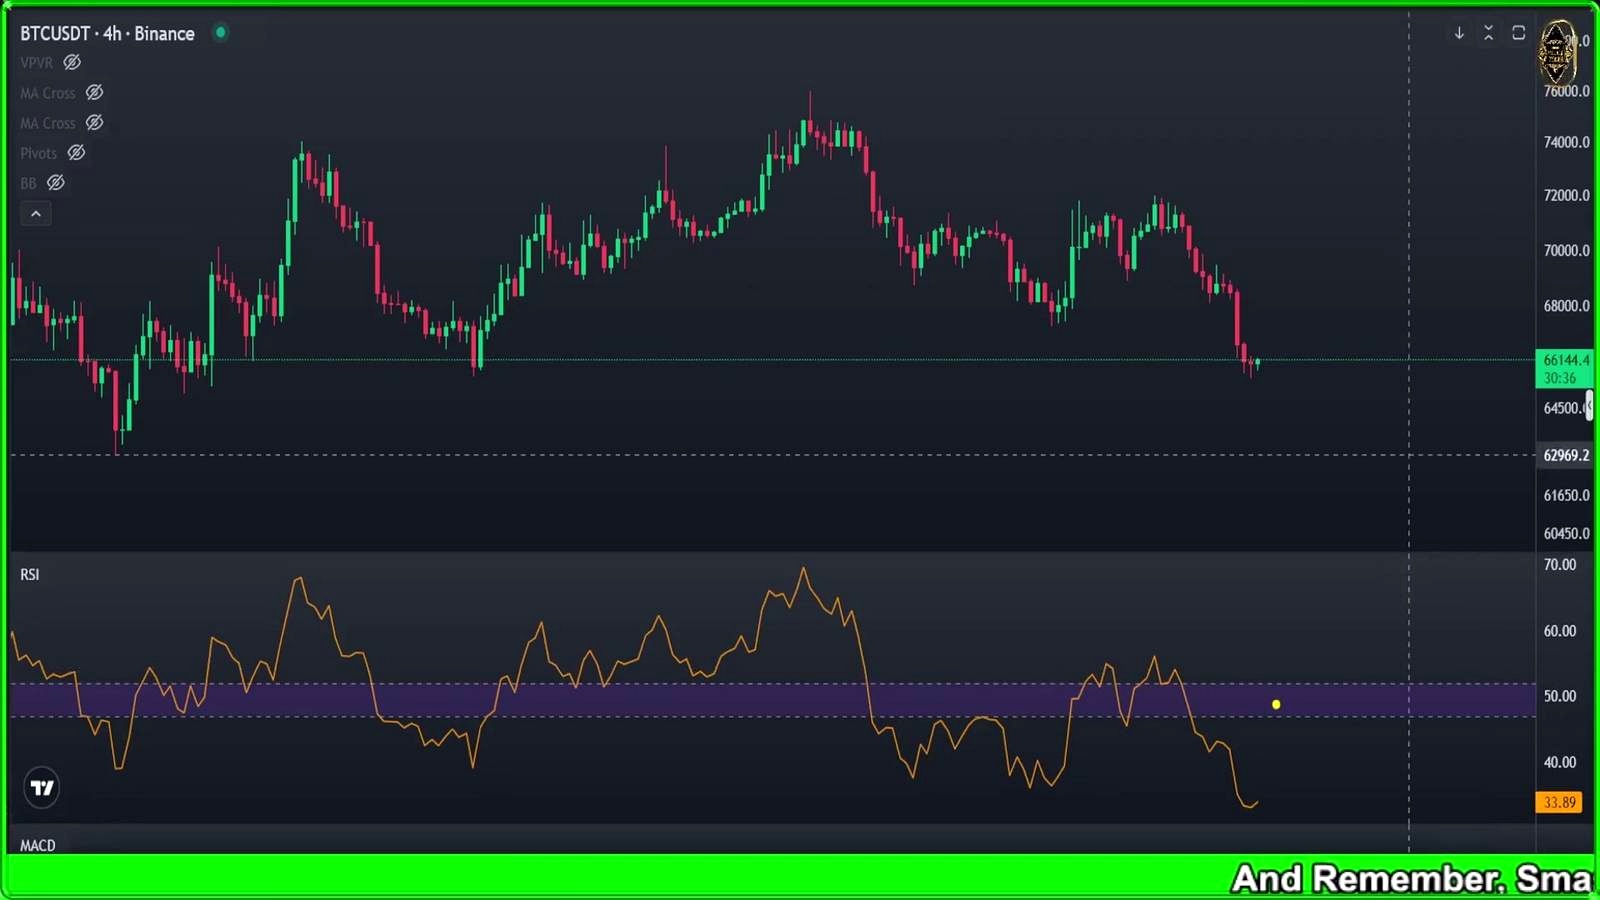
The sharpest tension in the update comes from the shorter time frames. While the daily chart is bearish, Thomas Boleto, Bitcoin Insights says the 4-hour RSI was around 33, putting Bitcoin close to an extreme oversold area. That matters because oversold conditions can produce a rebound even inside a broader downtrend.
He also points to a bullish divergence on the 30-minute chart using the MACD. In his framework, that creates the possibility of a tactical long setup if price confirms with the right action. He does not present that as a full reversal call. Instead, he describes it as a scenario where Bitcoin could bounce, retest a broken level, and then decide its next move.
On the 4-hour chart, he says Bitcoin has already broken a double-top structure and may either continue lower or rebound to retest the upper boundary of a down channel. He also references a cup-and-handle style setup on the same time frame, though his broader message stays consistent: short-term upside is possible, but the dominant structure still looks weak.
Why 70K was a trigger and 66K was the immediate reality
The host says he had previously highlighted $70,000 as a breakdown level on the lower time frame. Once that level gave way, he viewed it as a short trigger. By the time of this update, Bitcoin was trading closer to $66,000, which fits his case that lower support zones were already coming into play.
That matters because his analysis is not centered on one giant target alone. It is layered. The lower-time-frame break under $70,000 set the market moving, the options market frames $62,000 to $76,000 as the near-term operating zone, and the daily bearish flag keeps $40,000 in the background as the larger technical objective.
His message to long-term holders is very different from his message to traders
Thomas Boleto, Bitcoin Insights draws a clear line between trading and investing. For long-term investors, he says there is “nothing” to do beyond buying low and waiting for the market to recover. He rejects claims that Bitcoin is going to zero and says holders should filter out that kind of noise.
For leveraged traders, though, his tone is more cautious. Because the higher-time-frame structure still looks weak, he says extra confirmation is needed before taking aggressive long exposure. That distinction is important in his framework: spot accumulation may make sense in a strong zone, but leverage requires a cleaner signal.
Ethereum is flashing a similar warning
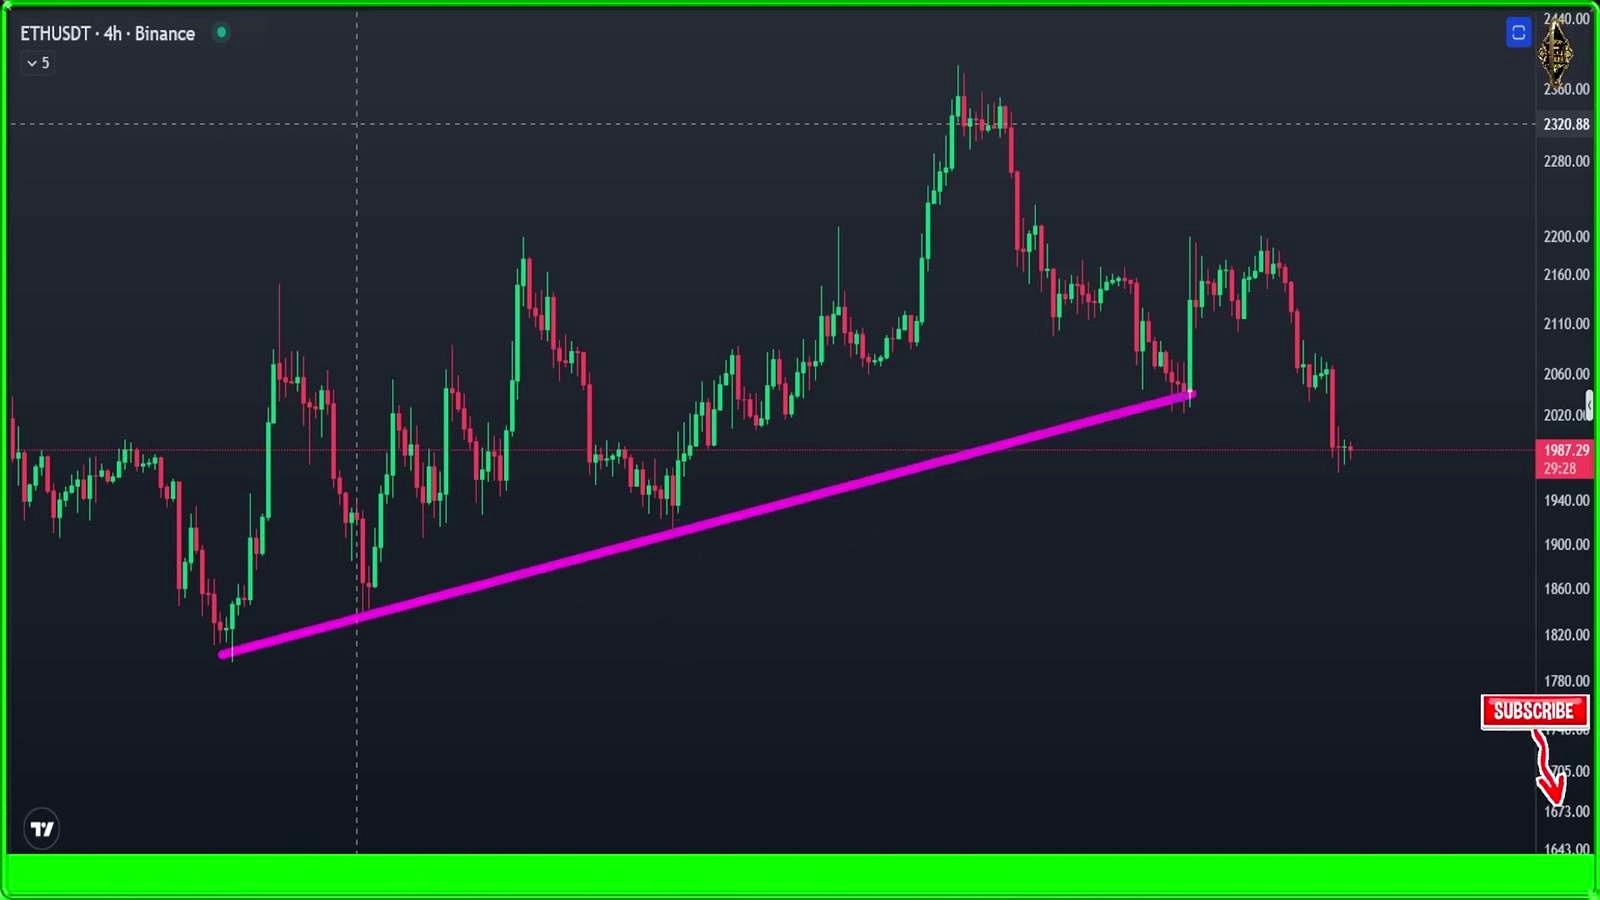
The host briefly extends the bearish argument to Ethereum. He says ETH is breaking below its 200 moving average and that its chart structure resembles Bitcoin’s. In his reading, that increases the risk of a larger dump in the coming hours.
He also notes a possible down-channel scenario for Ethereum, suggesting that even if a bounce develops, the lower boundary of that channel has not yet been fully tested. No specific Ethereum price target was given.
What to watch next
The next checkpoints are clear in Boleto’s setup. First, traders need to see whether Bitcoin holds near $62,000, the lower options level he highlighted. A failure there would keep the broader bearish structure in control. Second, any bounce needs to be judged carefully: an oversold 4-hour RSI at 33 and a 30-minute bullish divergence can support a relief move, but not necessarily a durable reversal.
The time marker also matters. He notes that the coming Friday is 3/4, when the monthly candle is set to close. That gives the market a near-term deadline for confirming whether this is simply a hard pullback inside a range, or the early stage of the deeper breakdown he believes the daily chart is starting to signal.
Key numbers from the video
- $40,000: bearish flag target on the daily chart
- $62,000: lower options level for the coming week
- $76,000: upper options level for the coming week
- $64,000 and $77,000: prior week’s range levels cited by the host
- $70,000: lower-time-frame breakdown level previously flagged
- $66,000: approximate price at the time of recording
- 33: 4-hour RSI reading cited as near oversold
- 376 BTC puts and $24 million volume at $62,000
- 2.27K BTC calls and $149 million volume at $76,000
- 200 moving average: level Ethereum was said to be breaking
- 30 minutes, 4 hours, and daily: main chart time frames discussed
- 36 minutes: time left on the candle during recording
- 3/4: date cited for the coming Friday monthly close
- 100 likes: non-market number mentioned in the video
FAQ
Why does the $62,000 level stand out in this analysis?
It is the lower boundary Thomas Boleto, Bitcoin Insights pulled from Bitcoin options data for the coming week. He pairs it with $76,000 as the upper boundary, making $62,000 the most immediate downside level to monitor before the much lower $40,000 chart target comes into focus.
Did the host call for an immediate crash to $40,000?
No. He said $40,000 is the target implied by the daily bearish flag break, but he also said the move still needs to develop over the coming days. His update leaves room for shorter-term rebounds before any larger continuation lower.
Was there any bullish signal in the video?
Yes, but it was limited to shorter time frames. He cited a 30-minute MACD bullish divergence and a 4-hour RSI at 33, which he described as close to an extreme oversold zone. Those signals point to bounce potential, not a confirmed trend reversal.
What was his advice for long-term Bitcoin investors?
He separated investors from active traders. His message to long-term holders was to buy low and wait for recovery, while his message to leveraged traders was to demand extra confirmation before entering longs.
Did he give any Ethereum target?
No specific Ethereum price target was given. He said ETH was breaking below its 200 moving average and warned that the structure could point to a larger dump in the coming hours.
Reference Video

Omar Al-Sharif lives and works in the UAE and is involved in the blockchain technology industry. He writes articles on Bitcoin and digital assets as a personal passion, explaining complex topics in simple and understandable language.


