Is Bitcoin merely cooling off with tech, or has a much larger breakdown already begun? A new chart read from Rudy’s Chart Based ETFs : ASX & US argues that BTC is no longer in a buy-the-dip phase and now carries downside targets that stretch far below recent sentiment.
Bitcoin’s key call: the analyst says BTC has flipped to a sell
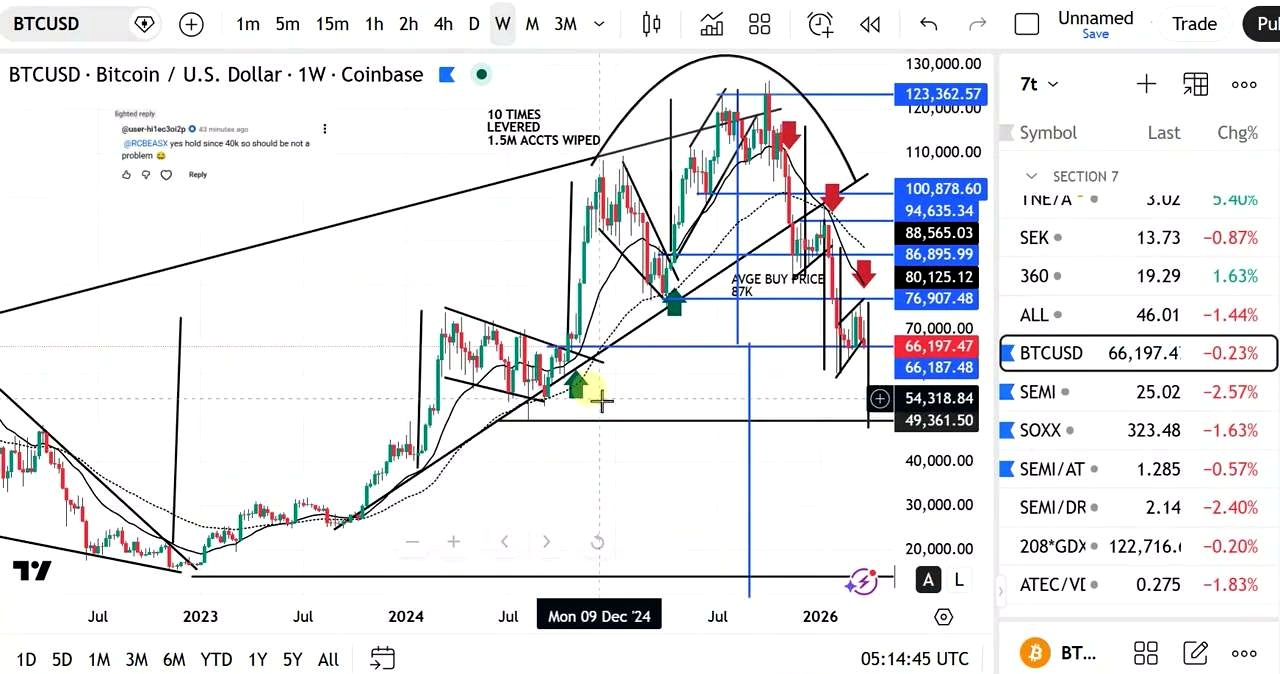
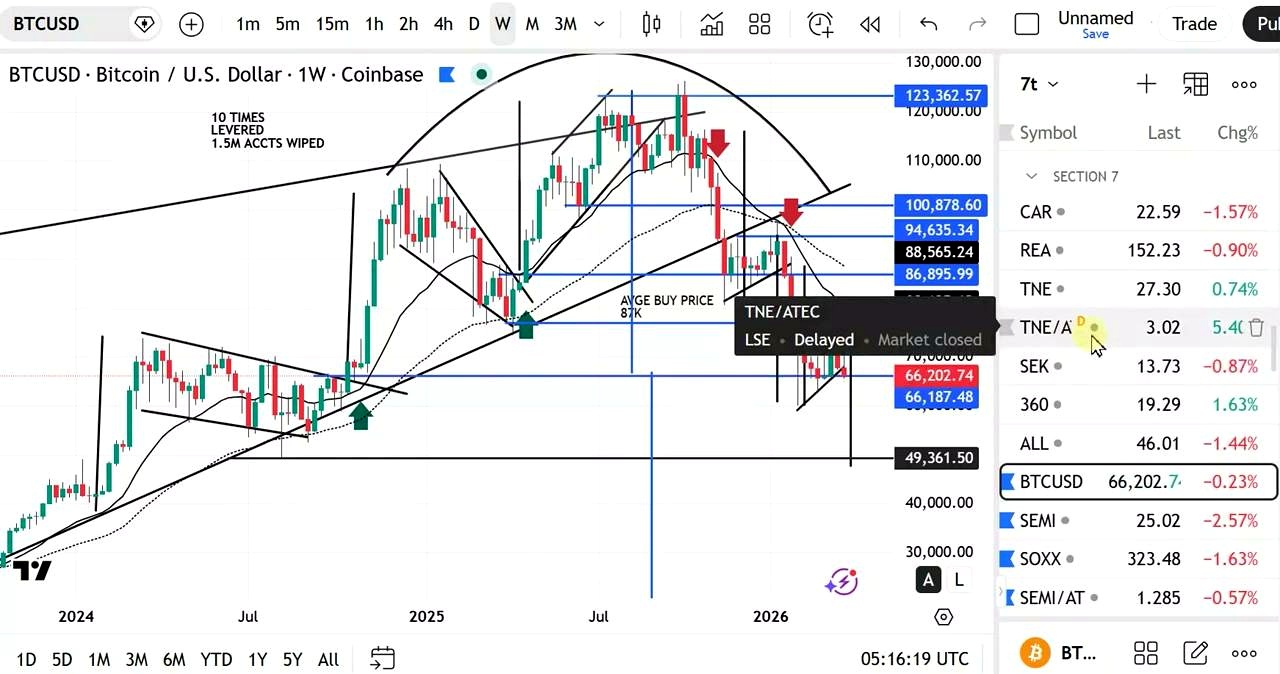
According to Rudy’s Chart Based ETFs : ASX & US, Bitcoin had previously respected a series of constructive measured moves, but that changed after a bearish channel break. He now classifies BTC as a sell, tying the shift to technical damage that he says resembles a broken rising channel and a bear flag.
The host presents two downside frameworks. The first is the more conservative one: an ABC measured move based on the recent flagpole structure. He says that setup implies Bitcoin could fall to $50,000. The second is more severe. He describes a larger head-and-shoulders pattern, with a neckline break on a declining channel, and says that structure projects a move to roughly $20,000.
Those are the clearest Bitcoin numbers in the video:
- $50,000: the analyst’s minimum downside target from the recent measured move
- $20,000: the deeper target from the larger head-and-shoulders interpretation
- March 28: date referenced at the start of the video
Why he thinks Bitcoin is moving with Australian tech
Rudy’s Chart Based ETFs : ASX & US argues that Bitcoin has been tracking the Australian tech ETF ATEC closely enough to matter. He explicitly compares the two and says BTC and ATEC “sort of track” each other, using that relationship as part of the reason he turned bearish on both at the same time.
That matters because his broader thesis is not centered on crypto-specific news. It is built on a wider risk-off move in growth assets, led by weakness in US technology. In his framing, Bitcoin is behaving less like an isolated macro hedge and more like a high-beta extension of the same trade that lifted and now threatens tech-heavy markets.
US tech weakness is the backdrop for the Bitcoin call
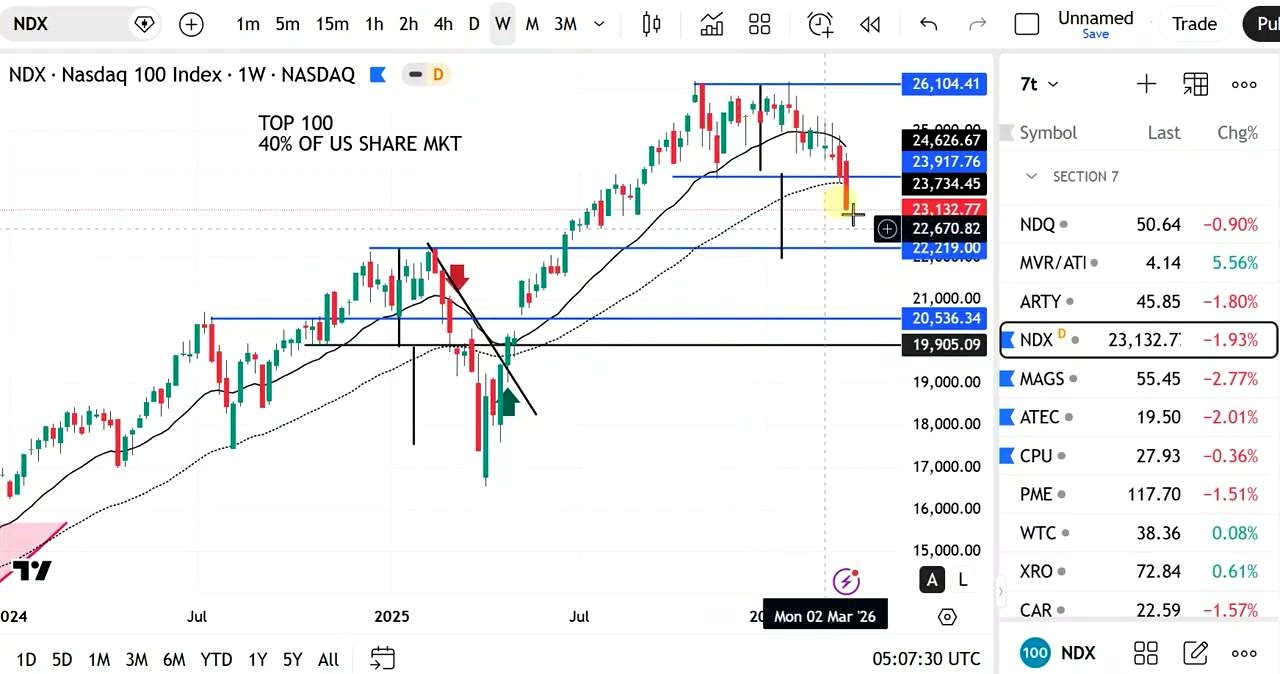
According to Rudy’s Chart Based ETFs : ASX & US, the Nasdaq has broken its 50-week moving average on the weekly chart, and that breach is the first major warning sign. He says underlying stocks do not look healthy and expects the index to come down and test a prior resistance area.
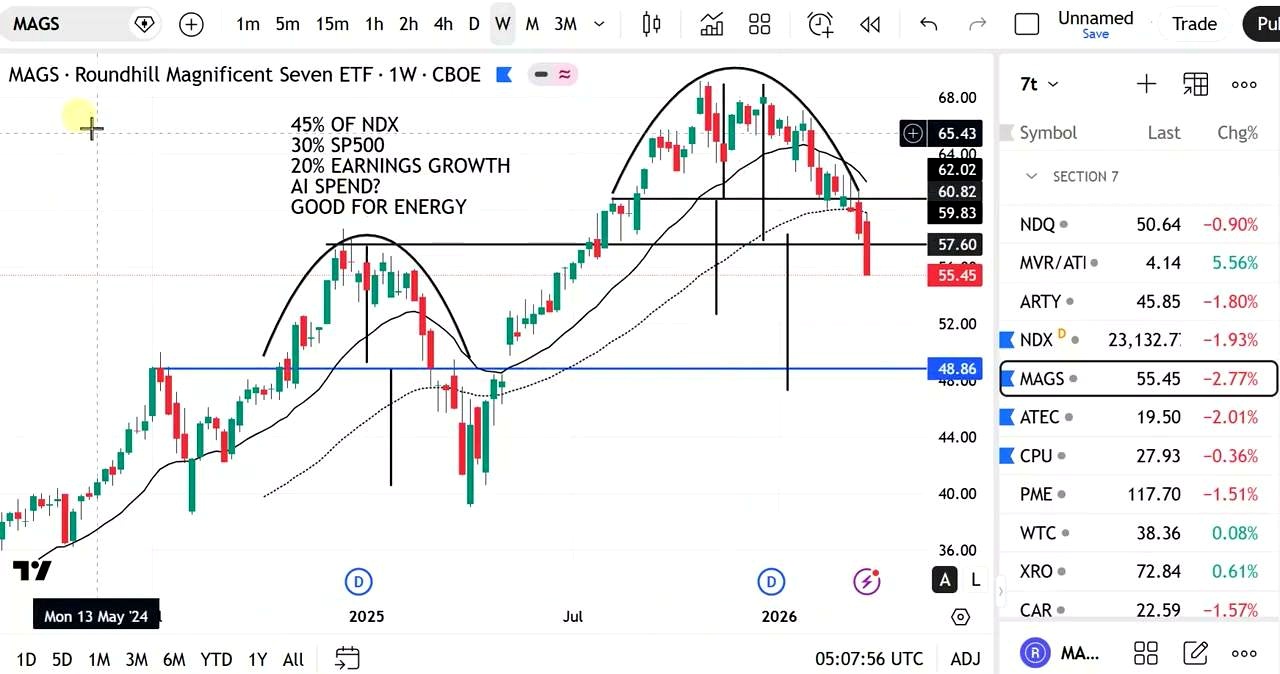
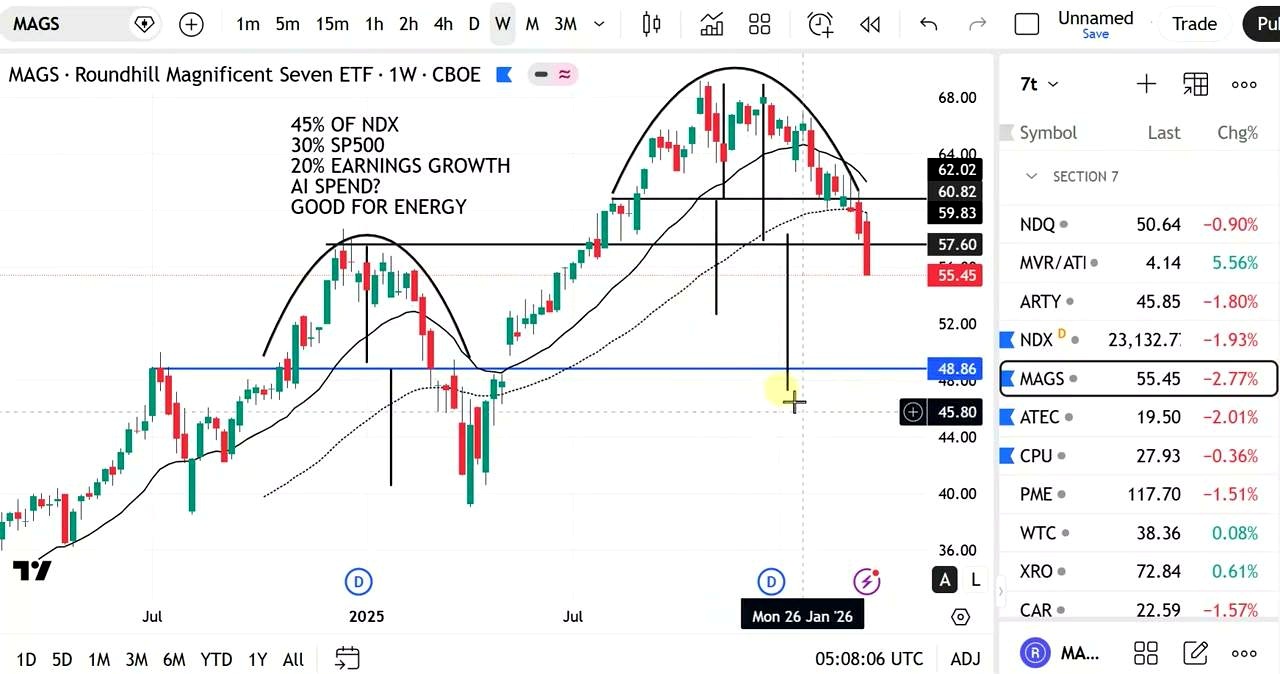
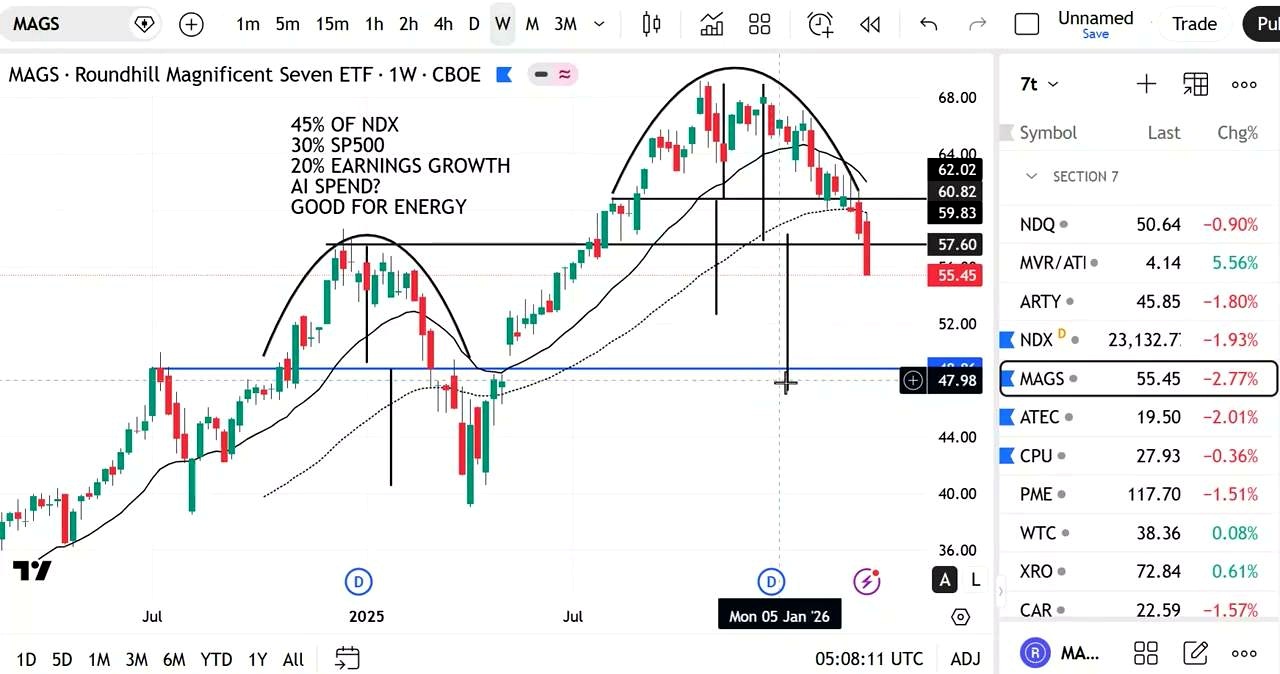
He also points to the US-listed MAGS ETF, which tracks the Magnificent Seven, as a likely driver of further weakness. While he does not give a precise numeric target for MAGS in the transcript, he says the ETF has “a couple of measured downside projections” that align with his bearish Nasdaq setup.
The implication is straightforward: if the largest US tech names continue rolling over, the pressure would not stay confined to equities. In his reading, it spills into ATEC and then into Bitcoin.
ATEC is also a sell, with another 20% downside in play
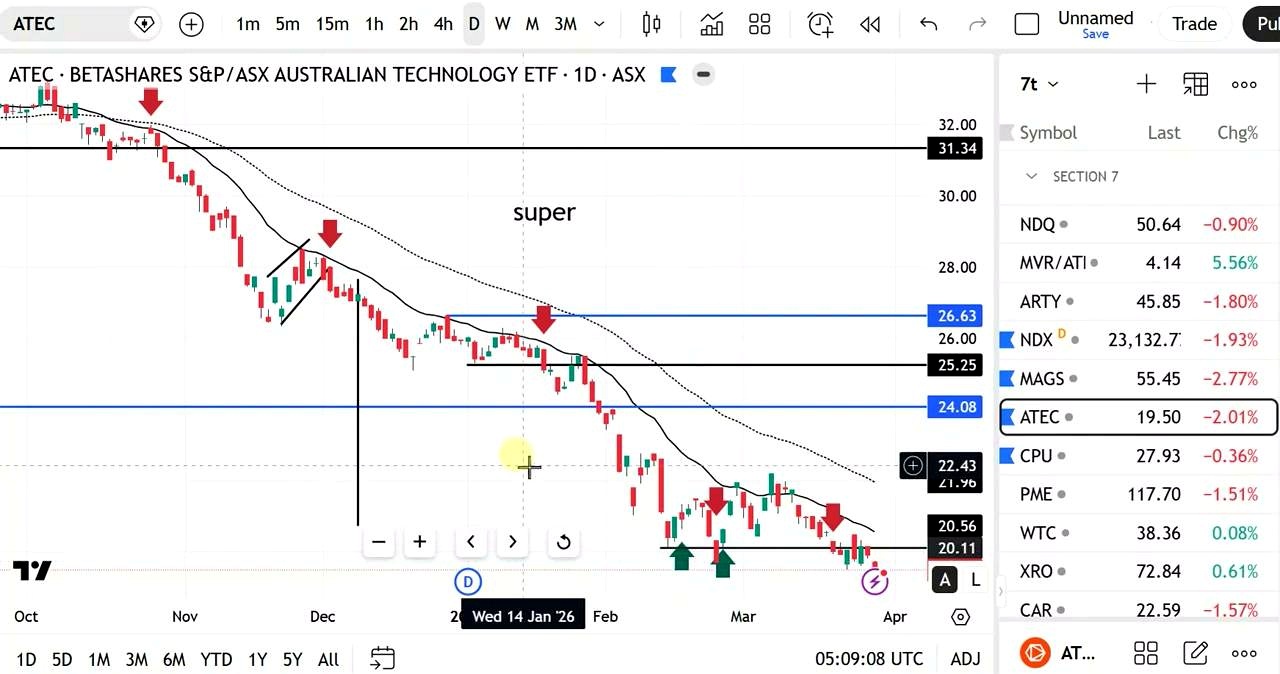
The analyst’s Bitcoin warning sits beside an equally bearish call on Australia’s ATEC ETF. He says he had already been selling ATEC since October after it completed a measured move from a rounded-bottom setup, and that repeated attempts to buy oversold bounces failed as support broke.
His current chart target for ATEC aligns with what he describes as “the start of the whole thing, ” and he says that implies another 20% downside from current levels. Later in the video, he refines the likely range as roughly 10% to 20%, with “a good 15%” drop presented as plausible when the weakness in the ETF’s main holdings is added up.
He also flags a weekly shooting star at resistance as a negative technical sign for ATEC.
The stock-level breakdown behind the ATEC warning
To explain how ATEC could fall another 10% to 20%, the host walks through several underlying holdings and estimates their individual downside to support or breakdown levels. These stock-by-stock figures are the most concrete numbers in the equity part of the video.
- Computershare: about 10%
- PME: about 23%
- WiseTech: about 26%
- Xero: about 13%
- Carsales: about 17%
- REA: about 15%, or up to 25% if support fully breaks
- Seek: about 19%
- Aristocrat: about 11%
He notes that one name, which he refers to as “T&N” in the transcript, had actually worked when he tried buying the bottom and reconfirmed. But that was presented as the exception rather than the rule. His main point is that enough heavyweights in ATEC still look vulnerable to justify a broader ETF decline.
Repeated failed dip-buying shaped the bearish turn
One of the more revealing parts of the video is the host’s admission that he tried to pick bottoms several times across ATEC and some of its holdings. He says those attempts repeatedly failed, forcing stop-outs after support gave way. That experience appears central to the change in tone.
Rather than arguing that the assets are fundamentally broken, he says some Australian tech names have already been oversold. But he also says oversold conditions alone are not enough when chart support keeps failing. That is why his message shifts from bottom-fishing to capital protection.
For Bitcoin traders, that detail matters. His BTC sell call is not presented as a casual short-term wobble. It comes from the same process that led him to abandon rebound attempts in tech when the charts did not confirm.
Where he says capital is rotating instead
Rudy’s Chart Based ETFs : ASX & US says there are “much better places to be investing” than Bitcoin and tech right now. He mentions energy as an area where he is still positioned, and says he is also looking at gold and copper, which he describes as being at bottoms.
No price targets were given for energy, gold, or copper in the transcript.
What to watch next
The next checkpoints in this framework are clear. For Bitcoin, the first level to watch is whether the bearish measured move toward $50,000 starts to play out. If price action instead confirms the larger head-and-shoulders structure the host describes, the discussion would shift to the much deeper $20,000 area.
Outside crypto, the analyst’s view depends heavily on continued weakness in US tech. If the Nasdaq stabilizes after breaking the 50-week moving average, or if the Magnificent Seven stop leading lower, that would challenge the logic tying Bitcoin and ATEC to a broader growth-stock unwind. If those assets continue to deteriorate, his bearish case gets stronger fast.
FAQ
Is the analyst calling for Bitcoin to go straight to $20,000?
No. He presents $50,000 as the nearer and more conservative target from a recent measured move, while $20,000 comes from a larger, more bearish head-and-shoulders interpretation.
What technical patterns is he using for Bitcoin?
He cites a broken rising channel, a bear flag, an ABC measured move, and a possible head-and-shoulders with a neckline break. Those patterns form the basis for the two BTC downside targets.
Why is ATEC relevant to a Bitcoin article?
Because the host explicitly says Bitcoin and ATEC have been tracking each other. In his framework, both are expressions of the same risk appetite tied to weaker tech markets.
What is the clearest ATEC downside range given in the video?
He gives two versions of the same warning: another 20% down from his chart target, and a broader estimate of roughly 10% to 20%, with around 15% presented as a realistic aggregate move.
Did he give any bullish alternative for Bitcoin?
No. In this video, BTC is framed as a sell after prior buy signals worked earlier in the trend. The constructive ideas he mentions are outside crypto, namely energy, gold, and copper.
Original Video

John Burnell focuses on Bitcoin infrastructure, wallet security and blockchain technology. He writes educational articles explaining how Bitcoin works and how the technology evolves.


