Everyone is running around panicking and asking the same questions: should you sell, should I sell, and what happens next? This article focuses only on the idea that Bitcoin moves in predictable historical patterns, and that these patterns can be used to make high-probability predictions without relying on emotion, fear, or greed.
The core argument is simple: instead of reacting to rumors, craziness, and panic, the market should be examined through historic behavior, time cycles, drawdowns, and recurring seasonal patterns. Based on that approach, the article outlines what has happened, what is likely to happen next, and what this means for the recovery.
Recent Market Move
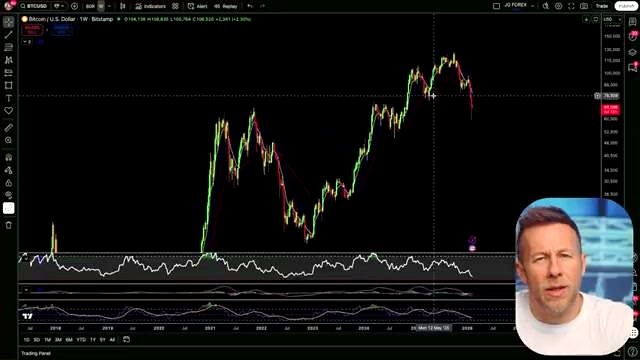
Bitcoin topped out on the 6th of October at about 126,000. From that point, the market is currently down about 45%.
Looking at the Weekly Chart
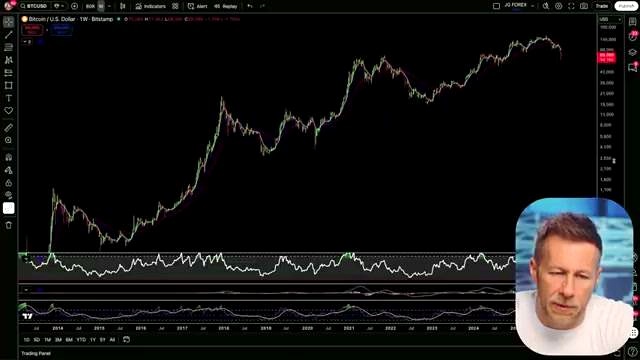
The analysis zooms out to the weekly chart to compare the current move with earlier Bitcoin cycles. The purpose is to gain confidence and insight into what is likely to happen next by studying historic behavior.
The argument presented is that intelligent investors and traders make money consistently by executing a plan based on probabilities and historic behavior. The focus here is not emotion, but facts, figures, and projected outcomes based on high probability.
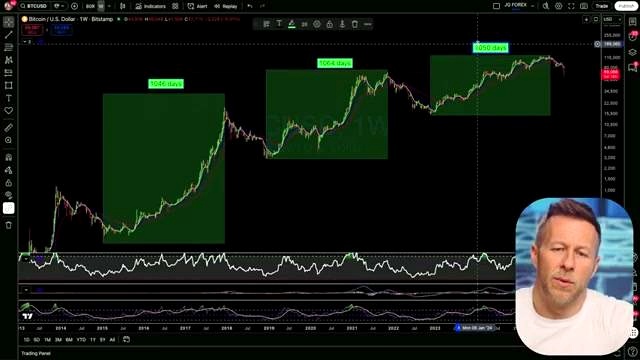
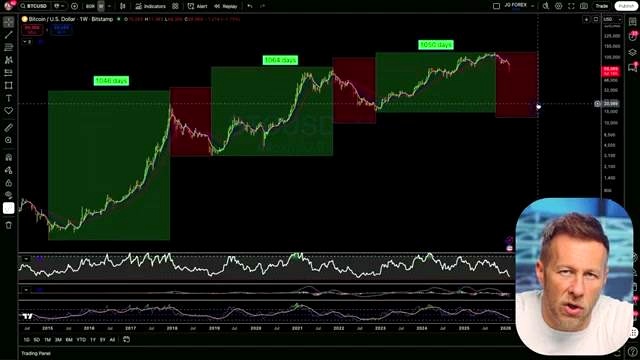
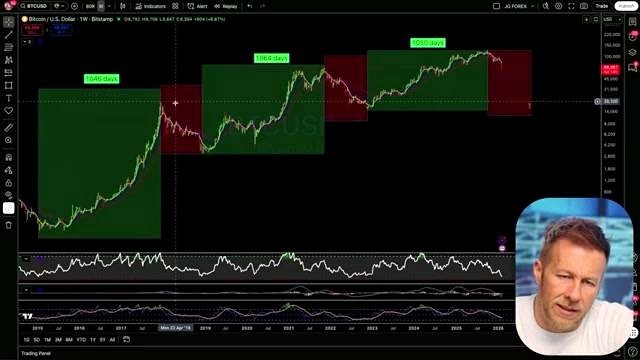
Recovery Periods From Major Lows to New Highs
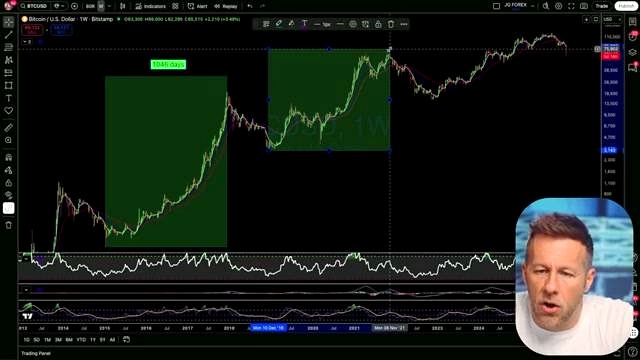
Three major recovery periods are compared:
- From the January 2015 low to the 11th of December 2017 high: 1,046 days.
- From around the 10th of December 2018 low to the 8th of November 2021 high: 1,064 days.
- From the 21st of November 2022 low to the 6th of October high: 1,050 days.
These periods are described as very close to one another, averaging about 1,050 days from major low to major high.
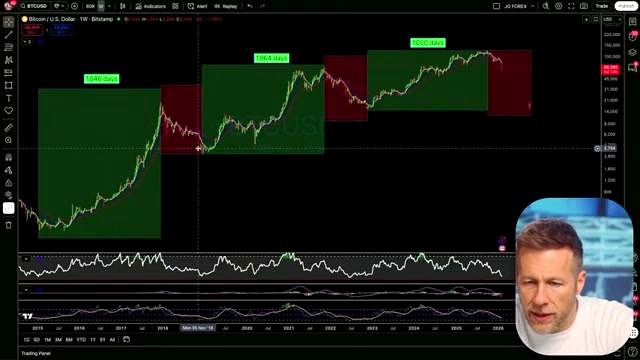
Bearish Periods After the High
The bearish phases are also compared. In one example the period is 364 days, and in another it is 378 days. These are presented as very close and part of a predictable pattern.
Based on that pattern, the current bear phase is described as only about 30% complete. From the 6th of October to the current point, which is stated as the 12th of February, the expectation is that there are roughly another 200 days or so before the market bottoms out.
Predicted Bottom
The article argues that if history repeats itself, the bottom will be around the 6th of October 2026, or around the 5th to the 10th of October 2026. This is presented as the point where the cycle should bottom based on historic results.
The broader point is that this is not described as luck or coincidence, but as a repeated timing structure that has appeared within about two weeks over a three-year period, every single three years.
Relief Rally Pattern After the High
Another pattern described is a relief rally during February and March after a major high. In these periods, people begin to think the market is recovering, but the move is framed as a temporary rally.
The article says this relief rally is usually about a 65% recovery in that period. In one example, in February and March 2019, there was about a 90% recovery to the previous high. After that, the market went into basically a year of decline. The same pattern is described in another cycle: a big retracement up in February to March, followed by a year of decline.
Why It Could Get Worse Before It Gets Better
Judging by history repeating itself, the decline is expected to deepen before the real recovery begins.
Spring Weakness
April and May are described as the period where the decline really starts to accelerate.
- May 2018: about a 19% decline.
- May 2021: about a 35% decline.
- May 2022: about a 16% decline.
Three out of the last five Mays are described as having a double-digit percentage decline.
July Strength
July is described as the most consistently positive month in Bitcoin.
- July 2015: rally of 8.2%.
- July 2018: rally of 21%.
- July 2022: rally of 16.8%.
October and November Lows
October and November are described as the period where Bitcoin consistently forms the lows of the cycle. This is called the bottom of the cycle.
The article repeats that in past cycles the bottom came around 365 days after the peak, and that the same pattern is expected again. October is also described as the point where the early recovery should begin if history repeats itself.
Historic Drawdowns
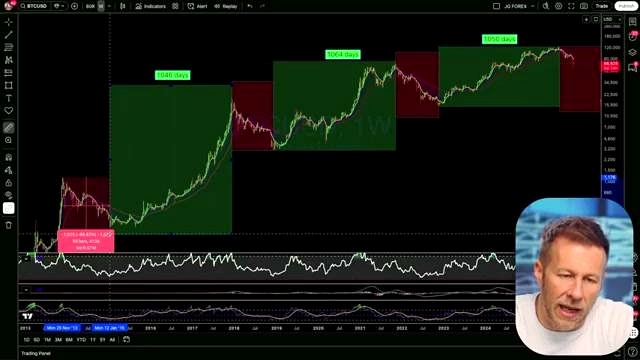
To address the idea that the current decline is abnormal, several historic drawdowns are listed:
- One drawdown: about 84%.
- Another drawdown: about 78%.
- From 2013 to 2015: about 86%.
Compared with those examples, the current drawdown of about 45% is presented as relatively limited so far.
The article then states that if the current cycle mirrors earlier ones, even conservatively with a 70% to 75% drawdown, there is still a long way to go. On that basis, the projected level before recovery begins is around the 36k to 40k mark.
Main Takeaway

The main message is that money should not be managed with emotion. If this market move is keeping someone up at night, the view presented here is that they should not be in it.
According to the article, intelligent investors do not trade off emotion. They trade off facts, figures, and projected outcomes based on high probability. While everyone else is panicking and reacting to rumors and conspiracy theories, a minority of intelligent investors are described as entering the market and taking advantage of the situation.
The broader lesson is that markets contain predictable patterns because they are driven by human participants. Once someone understands these patterns and follows a consistent set of rules around them, that is described as the point where they begin to think like a real trader.
FAQ
Is the current Bitcoin drop presented as unusual?
No. The article compares the current 45% decline with earlier drawdowns of about 86%, 84%, and 78%, and argues that the present move is not abnormal in historical terms.
When is the bottom predicted?
Based on the historic timing patterns discussed, the bottom is predicted around the 5th to the 10th of October 2026, with the 6th of October 2026 mentioned specifically.
What happens before the bottom, according to the analysis?
The analysis suggests there may be a relief rally around February and March, followed by further decline. It also says the market may weaken more in April and May, with October and November forming the cycle lows.
What price area is mentioned before recovery?
The article suggests that if the drawdown reaches around 70% to 75%, Bitcoin could hit roughly the 36k to 40k range before starting to recover.
What is the main investing lesson in the article?
The main lesson is to avoid trading on emotion and instead rely on historic behavior, probabilities, facts, figures, and a consistent plan.
What resources are mentioned at the end?
The article mentions watching the trading videos on the channel, visiting tier onetrading.com for a 12-month coaching and mentorship program, and checking out the 30-day trader challenge.
Video Reference

Omar Al-Sharif lives and works in the UAE and is involved in the blockchain technology industry. He writes articles on Bitcoin and digital assets as a personal passion, explaining complex topics in simple and understandable language.


