Bitcoin is back at a familiar crossroads: is this a routine pullback inside an uptrend, or the start of a deeper unwind after a failed breakout? According to BitcoinHyper, a newly broken daily support level and a short-term bearish setup point to lower prices first, even as the broader trend still leaves room for a rebound toward $80,000.
BitcoinHyper’s core thesis: local breakdown, bigger uptrend still intact
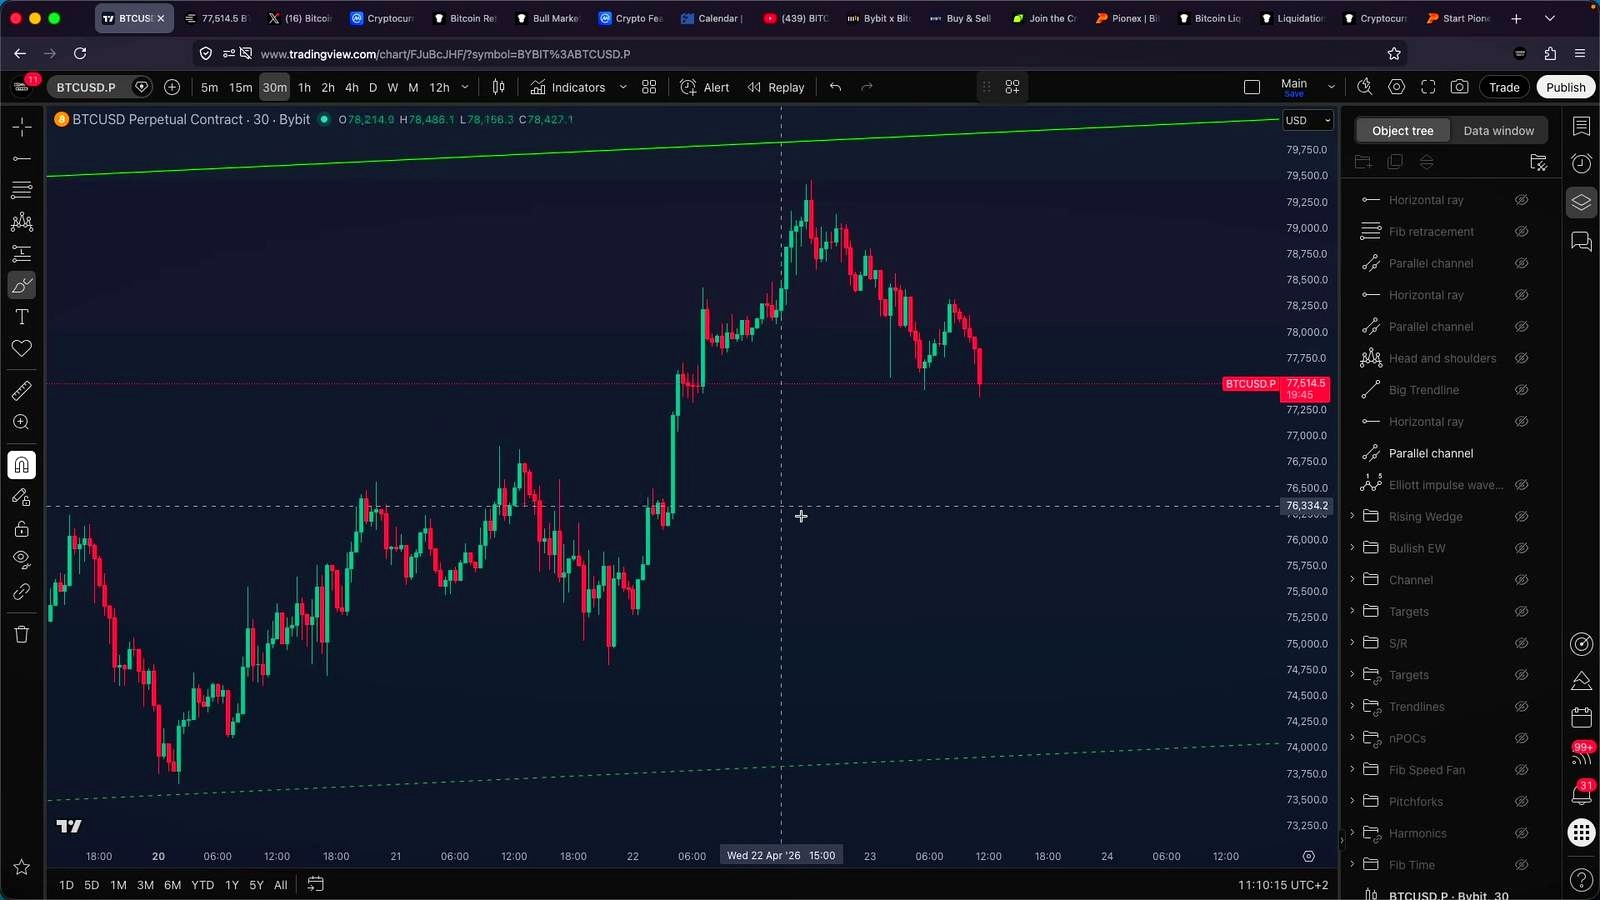
According to BitcoinHyper, Bitcoin’s rally into a daily resistance zone near $78,650 has now flipped into a local bearish rejection. The analyst says BTC hit that level “almost to the exact dollar, ” swept liquidity above the recent high, and then fell back through what had been acting as daily support. In his view, that loss of support is enough to justify a short-term bearish bias.
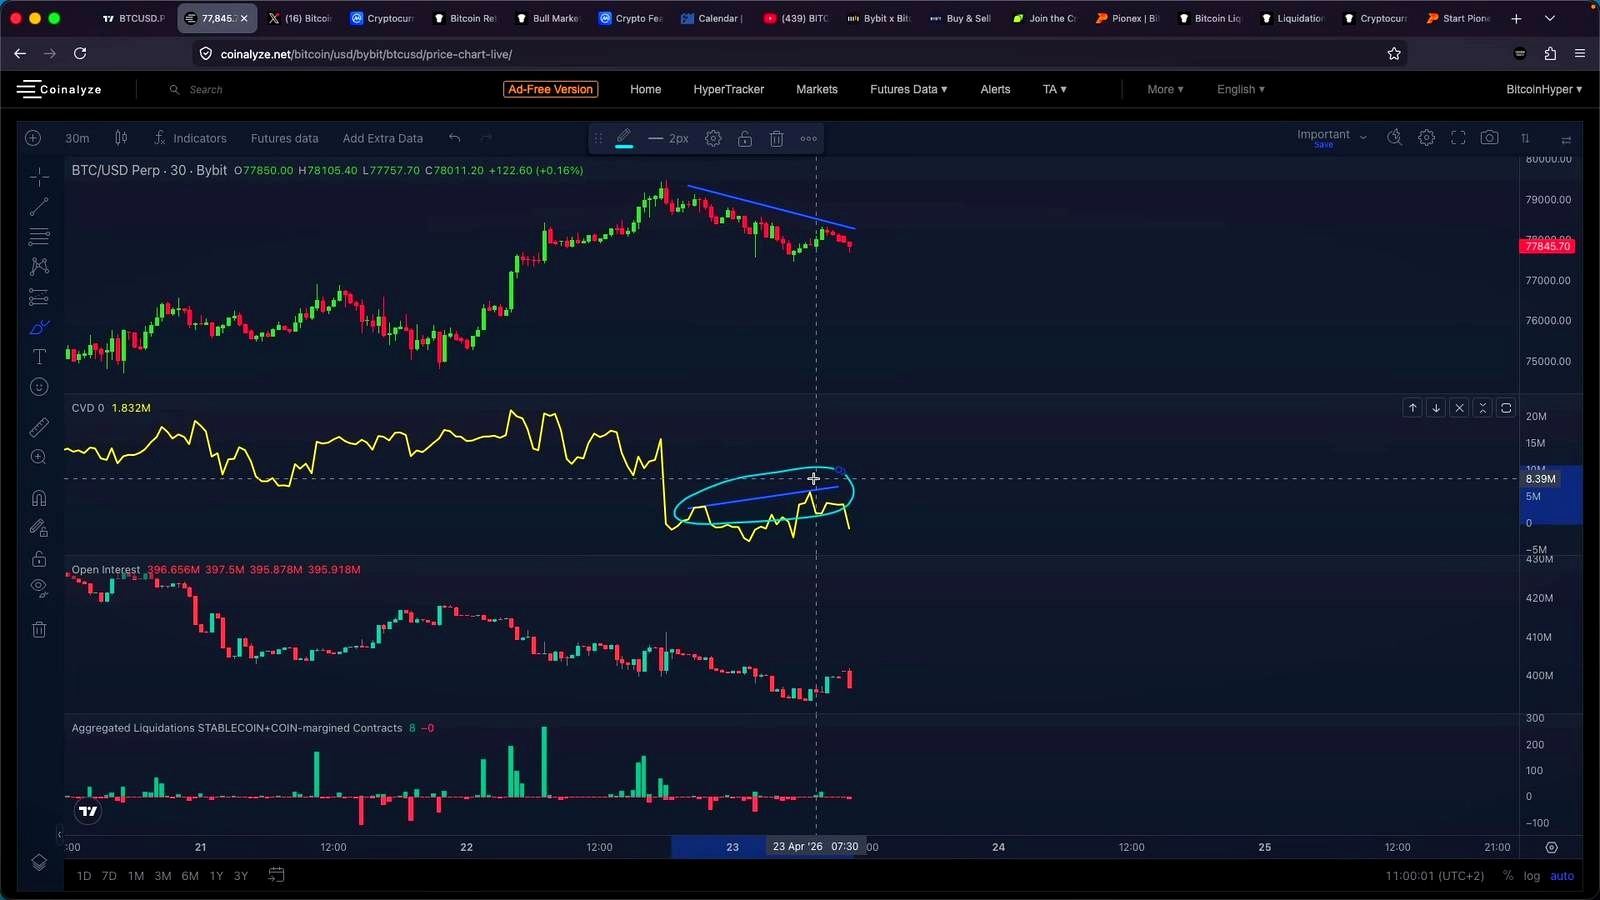
He ties that thesis to several intraday signals: a lower high forming despite visible buying pressure, a bearish divergence on CVD, and what he describes as bearish absorption. On that basis, he entered a fresh short on Bitcoin and says he also opened shorts on Ethereum, XRP, and Solana.
The key nuance is that this is not presented as a full trend reversal call. The host repeatedly distinguishes between local weakness and the broader structure, noting that the 15-minute, 30-minute, 1-hour, and 2-hour market structure still points upward, with higher highs and higher lows intact. That framing matters because it puts the view somewhere between outright bearish and cautiously tactical. In broader market terms, that is close to how many active traders approach late-stage breakouts: fade resistance if momentum stalls, but avoid declaring the macro move dead until higher-timeframe structure actually breaks.
That balanced view also reflects a wider Bitcoin reality. In strong uptrends, failed pushes above local highs often become liquidity grabs rather than cycle tops. At the same time, when price loses a newly reclaimed daily level after a breakout attempt, traders usually begin watching for a move back into prior value before trusting the trend again.
Why the analyst is focused on $77,300 and $76,000
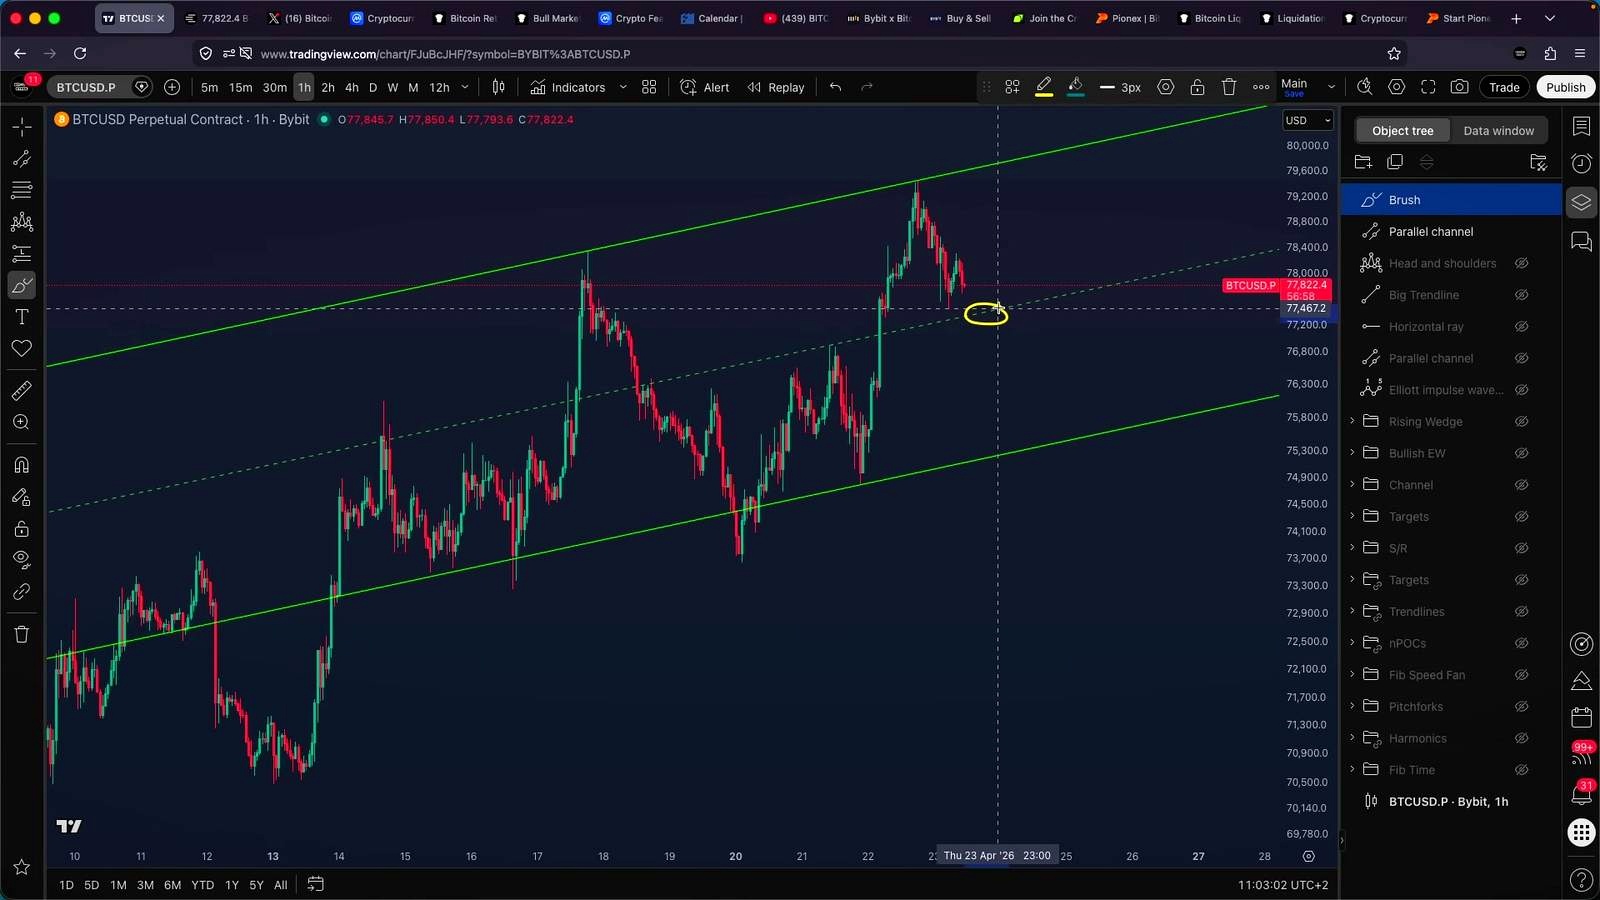
According to BitcoinHyper, the first meaningful downside area is near $77,300. He describes this zone as a confluence area: the midline of a rising channel on the 1-hour chart and a liquidity pocket sitting just below the recent low on the 30-minute timeframe. That is where he says short traders could consider taking at least partial profits.
The more ambitious downside target is around $76,000 to $76,100. The analyst reaches that zone in two ways. First, he says a potential head-and-shoulders pattern on the 15-minute chart projects to roughly $76,000. Second, he argues that the target aligns closely with a major trend-line support that has been in focus for weeks. In his telling, that overlap makes the level more than a random chart projection.
He also outlines the path for a bounce. If Bitcoin reacts from around $77,300, he says BTC could shift into a horizontal range rather than immediately resume either a breakdown or breakout. In that case, the first key resistance overhead becomes the value area high near $78,600, which he says also aligns with a “golden Fibonacci ratio” and sits close to the recent high. That makes $78,600 the level he appears to treat as the first serious test for any rebound.
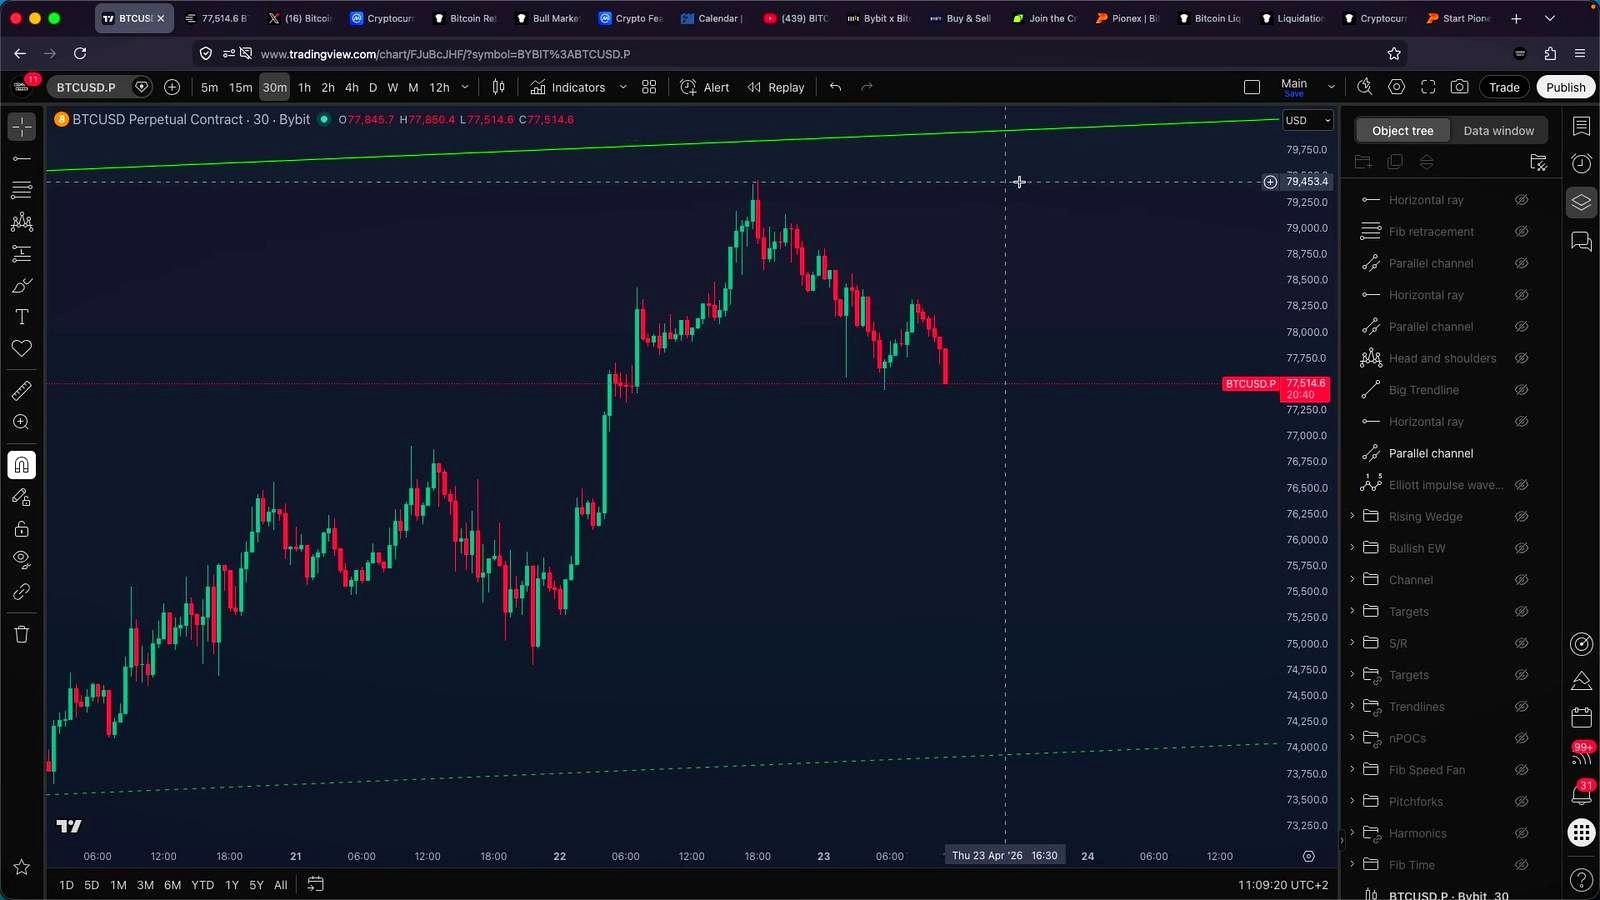
Beyond that, BitcoinHyper says the bigger upside magnet remains the top of a major channel around $80,000. He also points to liquidation data showing roughly $200 million in short positions sitting above the recent high, suggesting that a move back upward could accelerate if BTC starts squeezing bearish bets. That tension is important: the analyst is short-term cautious, but he is not dismissing the possibility that any dip could become a higher low before another push higher.
What could go wrong with this bearish setup
The most obvious failure case for the bearish thesis is simple: Bitcoin does not break down far enough to confirm it. The analyst himself acknowledges this risk. He says he does not like chasing shorts after the initial rejection and would not open a new short if Bitcoin starts invalidating the head-and-shoulders pattern by pushing back upward. That is a notable admission, because it implies the current setup is highly tactical and dependent on immediate follow-through.
There are also broader risks the video touches only lightly. In strong bull phases, classic reversal patterns on lower timeframes often fail. A 15-minute head-and-shoulders can be overwhelmed by spot-led demand, ETF-related inflows, or simple short-covering. The liquidation map the analyst cites cuts both ways: if price gets back above the recent high, those $200 million in shorts could fuel a fast squeeze rather than a drop.
Another challenge is that reclaimed support and broken support are not the same on every timeframe. Traders can overreact to a local loss on the daily chart if weekly trend structure remains healthy. If the market still views dips toward $77,300 or even $76,000 as buy-the-dip territory, the downside may be brief and choppy rather than directional.
Finally, the trade setup assumes clean reactions at technical levels. Real markets often front-run those zones, wick through them, or reverse before they are tagged. That matters for anyone treating these numbers as precise entry or exit points instead of rough areas of interest.
What to watch next
The immediate trigger is whether Bitcoin can hold or reclaim the area around $77,300. If that zone fails decisively, BitcoinHyper’s roadmap points to $76,000 to $76,100 as the next major test. If BTC instead bounces there and starts forming a range, traders will likely watch $78,600 as the first important resistance on a rebound.
Above that, the recent high becomes critical. A break through it would weaken the local bearish case and reopen the path toward the top of the channel near $80,000. In practice, the market is deciding between two near-term outcomes: a flush into lower support, or a higher-low setup that squeezes shorts and resumes the broader uptrend.
FAQ
What is CVD in Bitcoin trading?
CVD stands for cumulative volume delta. It tracks the net difference between aggressive buying and aggressive selling over time. Traders use it to spot divergences, such as price rising while buying aggression weakens, which can hint at fading momentum.
What does a head-and-shoulders pattern usually signal?
A head-and-shoulders pattern is a classic technical formation that can signal a reversal from uptrend to downtrend. It consists of three peaks, with the middle one higher than the other two. Traders typically measure the distance from the head to the neckline to estimate a downside target after a breakdown.
Why do traders care about liquidity above recent highs?
Recent highs often contain clusters of stop orders and short liquidations. When Bitcoin moves above those levels, it can trigger forced buying from short sellers and breakout traders entering late. That is why markets frequently probe above obvious highs before deciding on direction.
What is a value area high in volume profile analysis?
Value area high is the upper boundary of the price range where most trading volume occurred during a selected period. It can act as resistance because it marks an area where the market previously accepted price as fair value. Traders often pair it with the value area low and point of control.
How is this setup different from a full bearish trend reversal?
A local bearish setup usually refers to short-term weakness inside a broader trend that may still be up. A full bearish reversal would require higher-timeframe structure to break more decisively, often including lower highs and lower lows across daily or weekly charts rather than just intraday weakness.
Reference Video

An Indian crypto journalist covering the developments in the Bitcoin and blockchain industries. Her work helps readers understand key changes in the world of digital assets.


