Is Bitcoin simply pausing after Friday’s selloff, or setting up for another leg lower? A new BTC chart read from More Crypto Online says the answer may hinge on whether bulls can reclaim a tightly defined resistance zone.
According to More Crypto Online, Bitcoin’s recent bounce has already reached the kind of resistance area typically expected in a wave-four recovery, but the market still has not delivered the bearish confirmation needed to prove the next move down has started. That leaves traders watching a narrow battle zone below $68,543, with the analyst arguing that as long as BTC cannot break above that level, one more low still seems likely.
The key Bitcoin level is $68,543
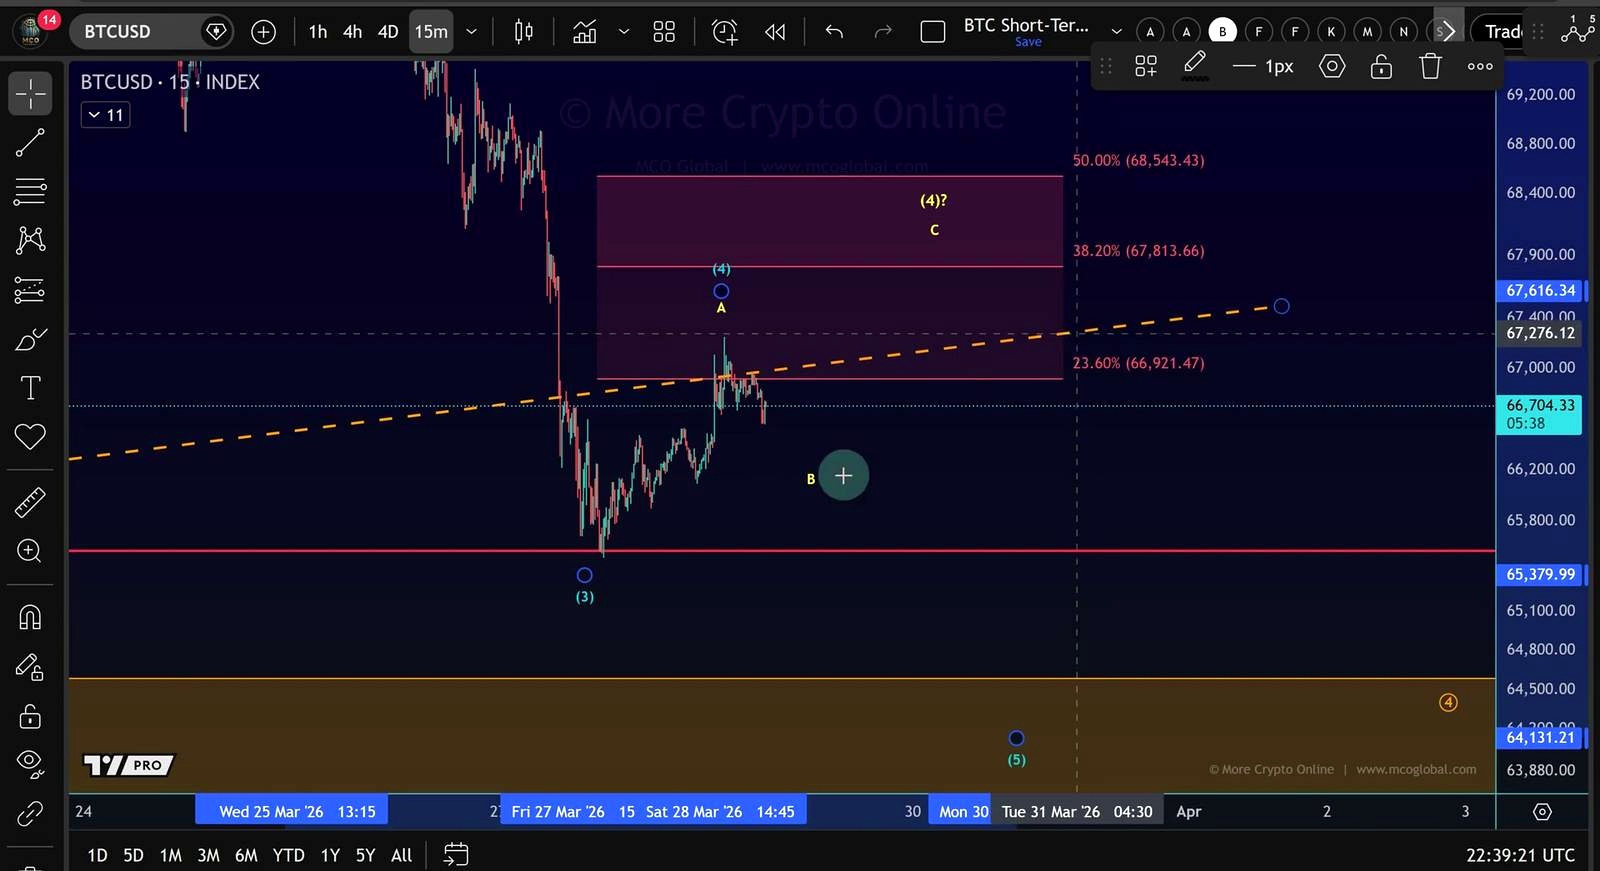
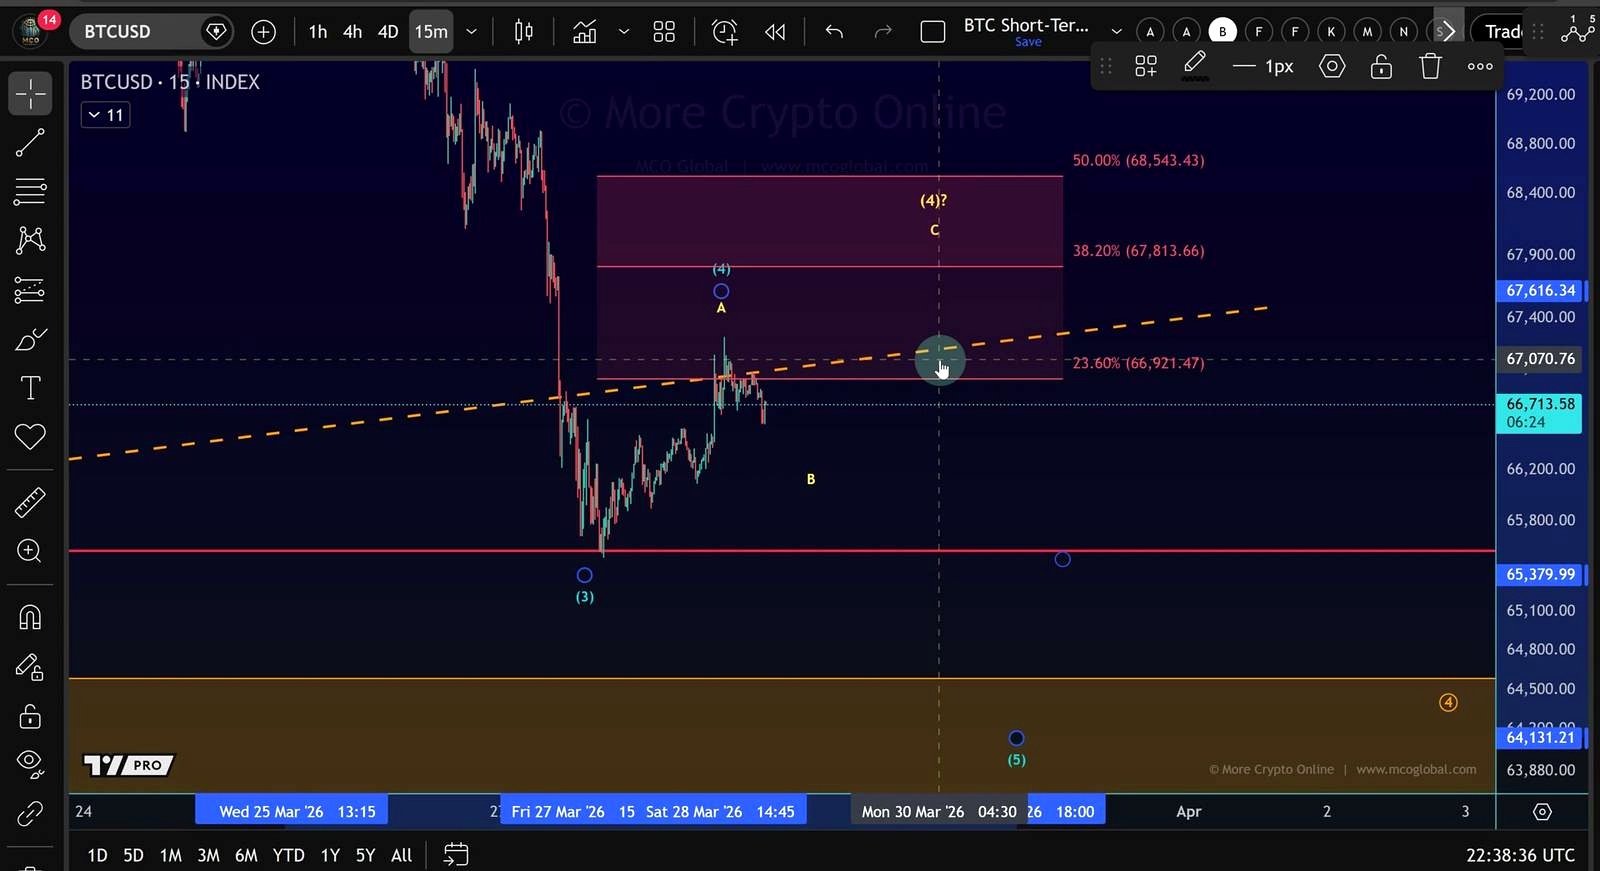
The central takeaway is straightforward: the recent rebound does not invalidate the bearish short-term setup unless Bitcoin can push through the top of the current resistance area. The host identifies that resistance zone between $66,920 and $68,543, calling it a standard wave-four target after the prior decline.
Within that range, the analyst highlights $67,813 as the “ideal” target because it marks the 38.2% retracement. He also frames the broader wave-four resistance band using the 23.6% and 50% retracement levels of the prior third wave.
That matters because Bitcoin has already bounced into this area, which is where the market would normally be expected to struggle. The host also notes that the lower trend line of his channel sits in the same region, adding technical weight to the zone.
For now, though, he stops short of declaring the top is in. The reason is structural: he wants to see clear evidence that a fifth wave lower has actually begun.
Why the bearish case is not confirmed yet
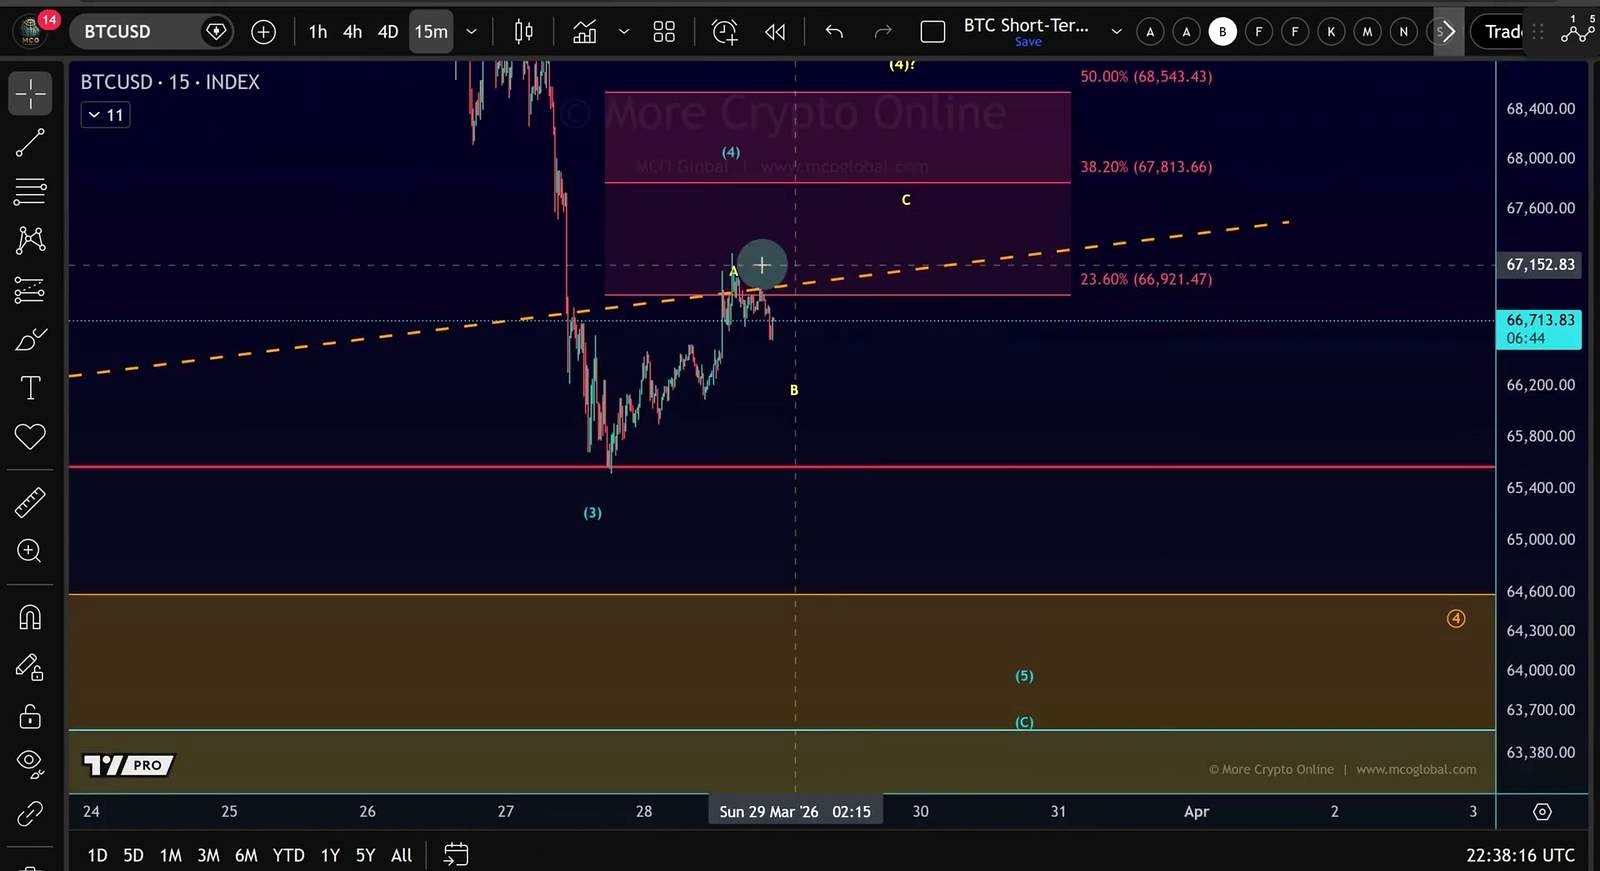
More Crypto Online argues that a proper fifth wave down should begin with a small five-wave decline on the micro timeframe. In Elliott Wave terms, that means the market should first print an initial drop, then a corrective bounce, before rolling over into a stronger third wave lower.
That sequence has not appeared yet. Instead, the decline from the local high currently looks more like a three-wave move. The analyst says that opens the door to an alternative scenario: rather than the downtrend immediately resuming, Bitcoin could still be in a larger wave-four consolidation.
In practical terms, that would mean the current pullback is just a B-wave within a broader sideways structure, followed by another short push higher before the larger bearish move resumes.
This is why the call is conditional rather than absolute. The bearish setup remains the preferred path below resistance, but the market has not yet printed the internal pattern that would lock it in.
The support zone that could keep the bounce alive
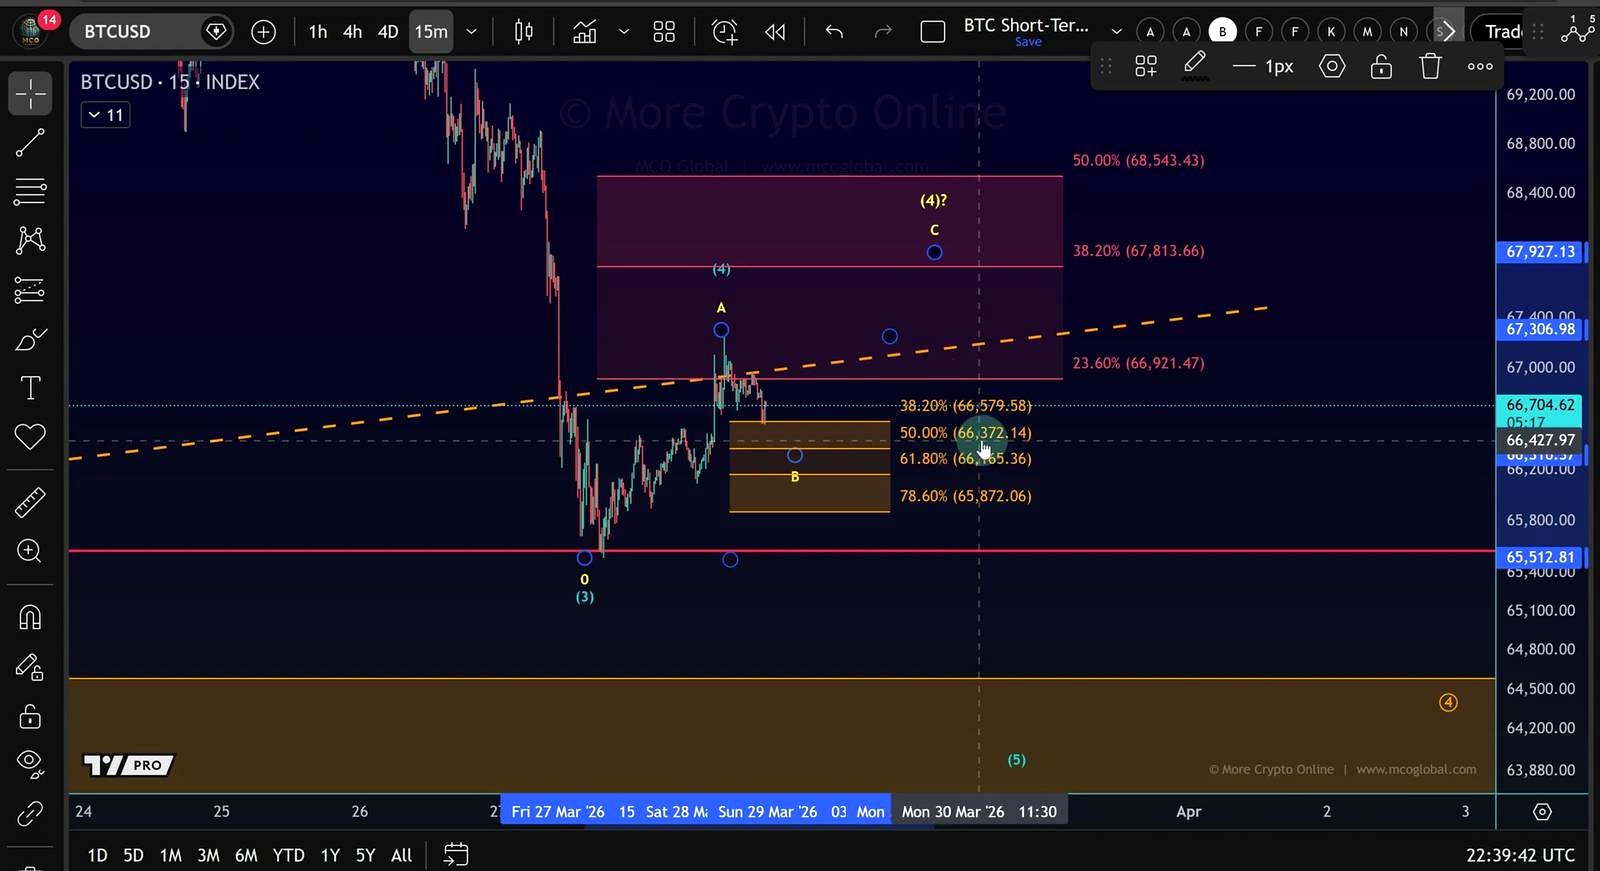
If Bitcoin is building a larger wave-four pattern rather than starting its next clean leg down, the analyst points to a short-term support area between $65,872 and $66,579. He describes this as a micro support zone that could catch an ABC pullback and allow another upward leg.
Inside that area, he lists four Fibonacci levels to monitor:
- $66,579
- $66,372
- $66,165
- $65,872
If Bitcoin pulls back in a corrective three-wave structure and finds support there, the host says the yellow-count scenario for a larger wave four remains viable. That would keep open the possibility of another attempt higher inside the broader resistance band before sellers regain control.
Put differently, a dip into that support region would not automatically be a fresh breakdown signal. It could instead be part of a more drawn-out consolidation.
The downside target if BTC stays capped
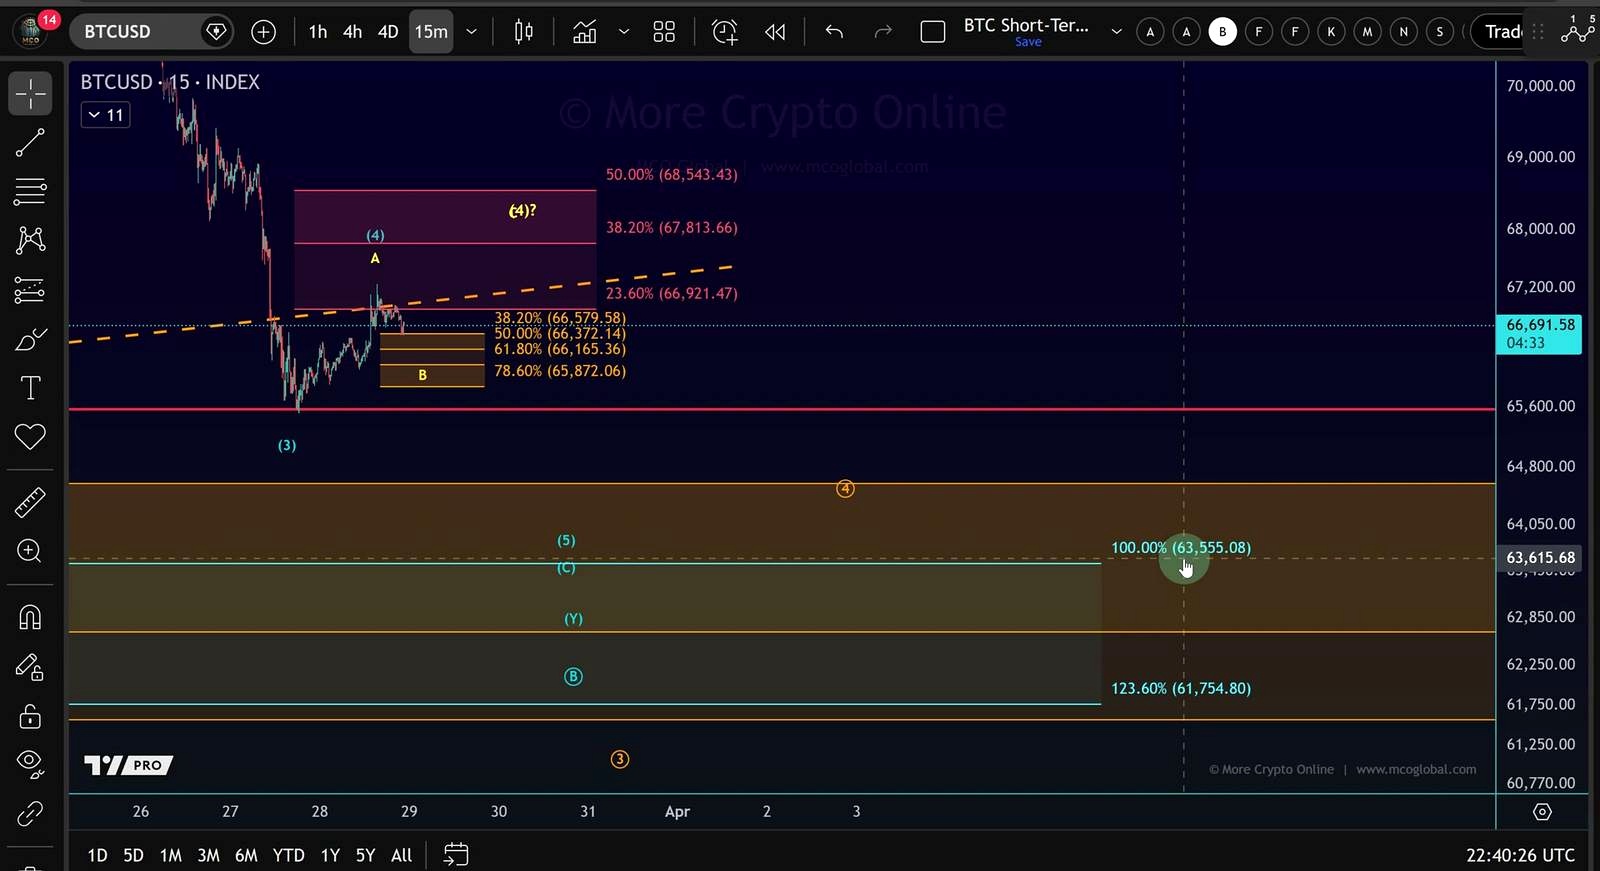
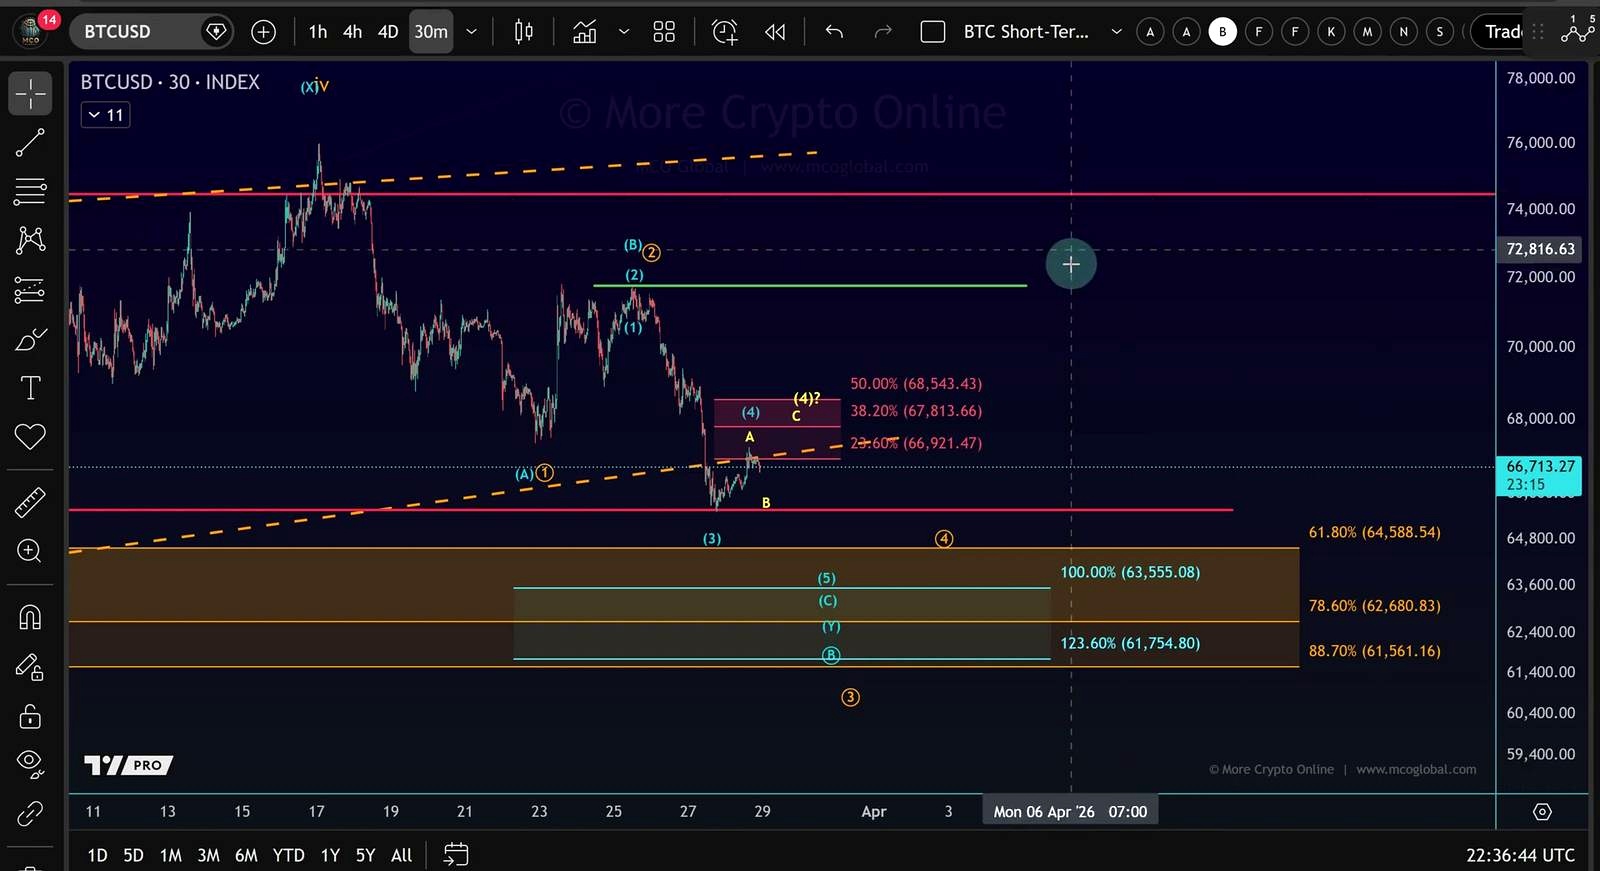
Despite the uncertainty around the exact micro structure, the analyst still sees lower prices as the more likely near-term outcome if Bitcoin remains below resistance. He gives a defined next downside target at $63,555, describing it as the 100% extension target and the next low target on the chart.
That makes the near-term framework relatively clean:
- Resistance remains $66,920 to $68,543
- The ideal wave-four retracement is $67,813
- Micro support sits at $65,872 to $66,579
- If resistance holds, the next downside target is $63,555
The host’s message is not that Bitcoin must fall immediately. It is that the market remains vulnerable to another low unless buyers can do something they have not yet done: break above $68,543.
Why timing may matter: weekend chop versus a real decision
More Crypto Online also places the current action in a timing context. The host describes the session as typical weekend chop after a strong Friday selloff, adding that Saturdays are usually quiet and tend to produce consolidation rather than a decisive move.
That is why he says the real decision will probably come the next day rather than during the slow Saturday session. In other words, the current price action may be less meaningful on its own than the structure that follows once the market becomes more active again.
This timing point helps explain why the analyst is avoiding a hard call on whether wave four has already topped. Bitcoin has tagged the expected resistance zone, but the market has not yet shown a decisive impulsive move lower from it.
What to watch next for Bitcoin
The immediate watchlist is compact. First, traders will want to see whether Bitcoin can break above $68,543. A move through that level would weaken the case for an imminent fresh low and suggest the corrective structure is extending.
Second, if BTC slips lower, the shape of the decline matters. A clean five-wave drop would support the analyst’s view that wave five down is underway. A choppier three-wave move into $65,872 to $66,579 would keep the larger wave-four scenario alive.
Third, the downside target of $63,555 remains in focus as long as resistance contains the bounce. That level is the analyst’s next clear objective if sellers regain control.
For now, the chart is balanced between two short-term paths: one more brief recovery inside a corrective structure, or the start of the next leg lower. The dividing line is clear, and it sits just under $68.5K.
FAQ
What is More Crypto Online’s main Bitcoin call?
The analyst’s main call is that another lower low is still likely unless Bitcoin can break above $68,543. The recent bounce reached expected resistance, but the bearish continuation has not been fully confirmed yet.
What would confirm that BTC has started a new leg down?
The host wants to see a micro five-wave decline from the recent high. That would signal the market is beginning a fifth wave lower rather than just chopping sideways in a correction.
What if Bitcoin drops but holds above the local support area?
If BTC falls in a three-wave ABC structure and finds support between $65,872 and $66,579, the analyst says that could still fit a larger wave-four consolidation. In that case, another short-term move up could happen before the broader decline resumes.
What specific price levels did the analyst highlight?
The key numbers were:
- Resistance: $66,920 to $68,543
- Ideal retracement: $67,813
- Micro support: $65,872 to $66,579
- Support levels inside that zone: $66,579, $66,372, $66,165, $65,872
- Downside target: $63,555
Did the analyst expect a major move during the session covered in the video?
No. He described the market as quiet weekend trading after Friday’s selloff and said Saturdays usually bring consolidation. His expectation was that the more meaningful directional decision would likely come later.
Video Reference

An Indian crypto journalist covering the developments in the Bitcoin and blockchain industries. Her work helps readers understand key changes in the world of digital assets.


