Bitcoin is pressing into a resistance zone that has already rejected price more than once, leaving traders with a familiar question: is this another local top, or the start of a broader trend reversal? According to Thomas Boleto, Bitcoin Insights, the latest daily and weekly signals suggest bulls are still in control, but the market has to clear a stubborn barrier before higher targets around $80,000, $85,000 and even $87,000 come into play.
Bitcoin’s core thesis: a resistance wall first, then a push higher
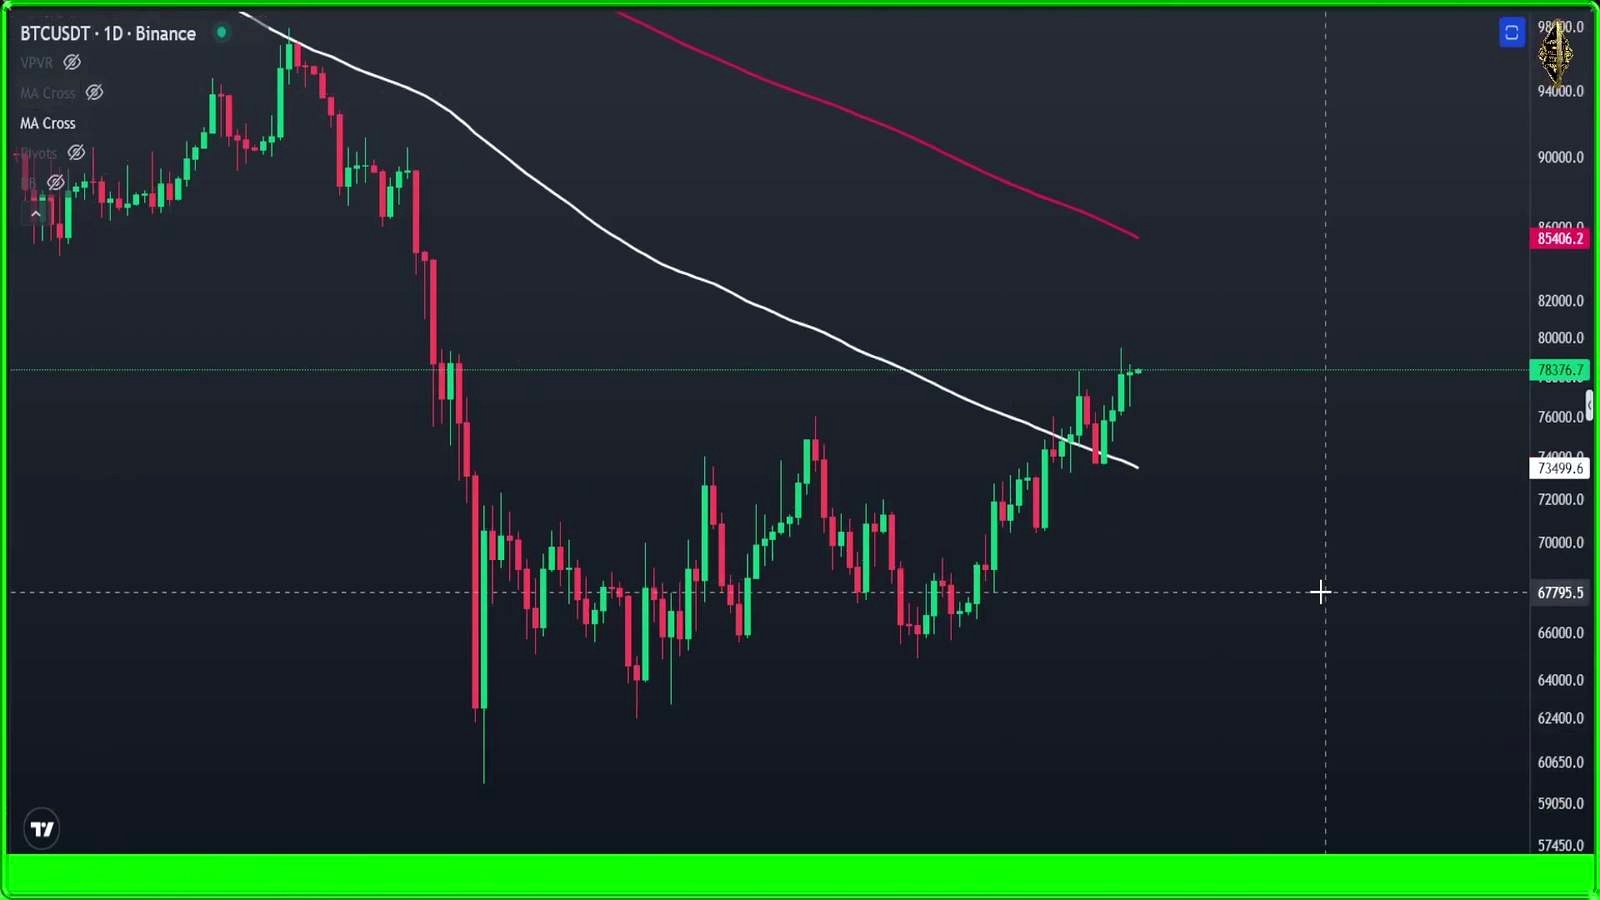
According to Thomas Boleto, Bitcoin Insights, Bitcoin is showing a meaningful shift in structure even as price continues to stall beneath a major resistance zone. The host points to a daily candle that closed as an inverted hammer, which he interprets as evidence of strong bullish pressure in the current area. He argues that bulls are trying to break a zone that has already capped price on at least two prior attempts.
His main argument rests on a multi-timeframe setup. On the weekly chart, he says Bitcoin is struggling at the 20-period moving average, a level he describes as representing the prevailing downtrend. If price clears that weekly barrier, he says the next major magnet is the 100-period moving average at exactly $87,000. On the daily chart, he sees a more constructive signal: the 20-period moving average has crossed above the 100-period moving average, which he calls “a very good sign” and a reason Bitcoin could revisit $85,000.
That framing lands in the middle of current market debate. A bullish moving-average crossover on lower timeframes often helps support trend continuation, but weekly resistance tends to matter more than daily momentum when the market is trying to reverse a larger drawdown. Traders broadly watch this kind of conflict closely: strong short-term structure can drive breakout attempts, while higher-timeframe resistance can still trigger rejection.
In broader market terms, the thesis is moderately bullish rather than fully euphoric. It assumes Bitcoin can convert near-term momentum into a clean breakout. That is plausible when leverage is leaning too heavily short, or when dollar strength softens. But if macro pressure returns, breakout signals on the daily chart can fade quickly beneath weekly overhead supply.
Why the analyst thinks $80K comes first
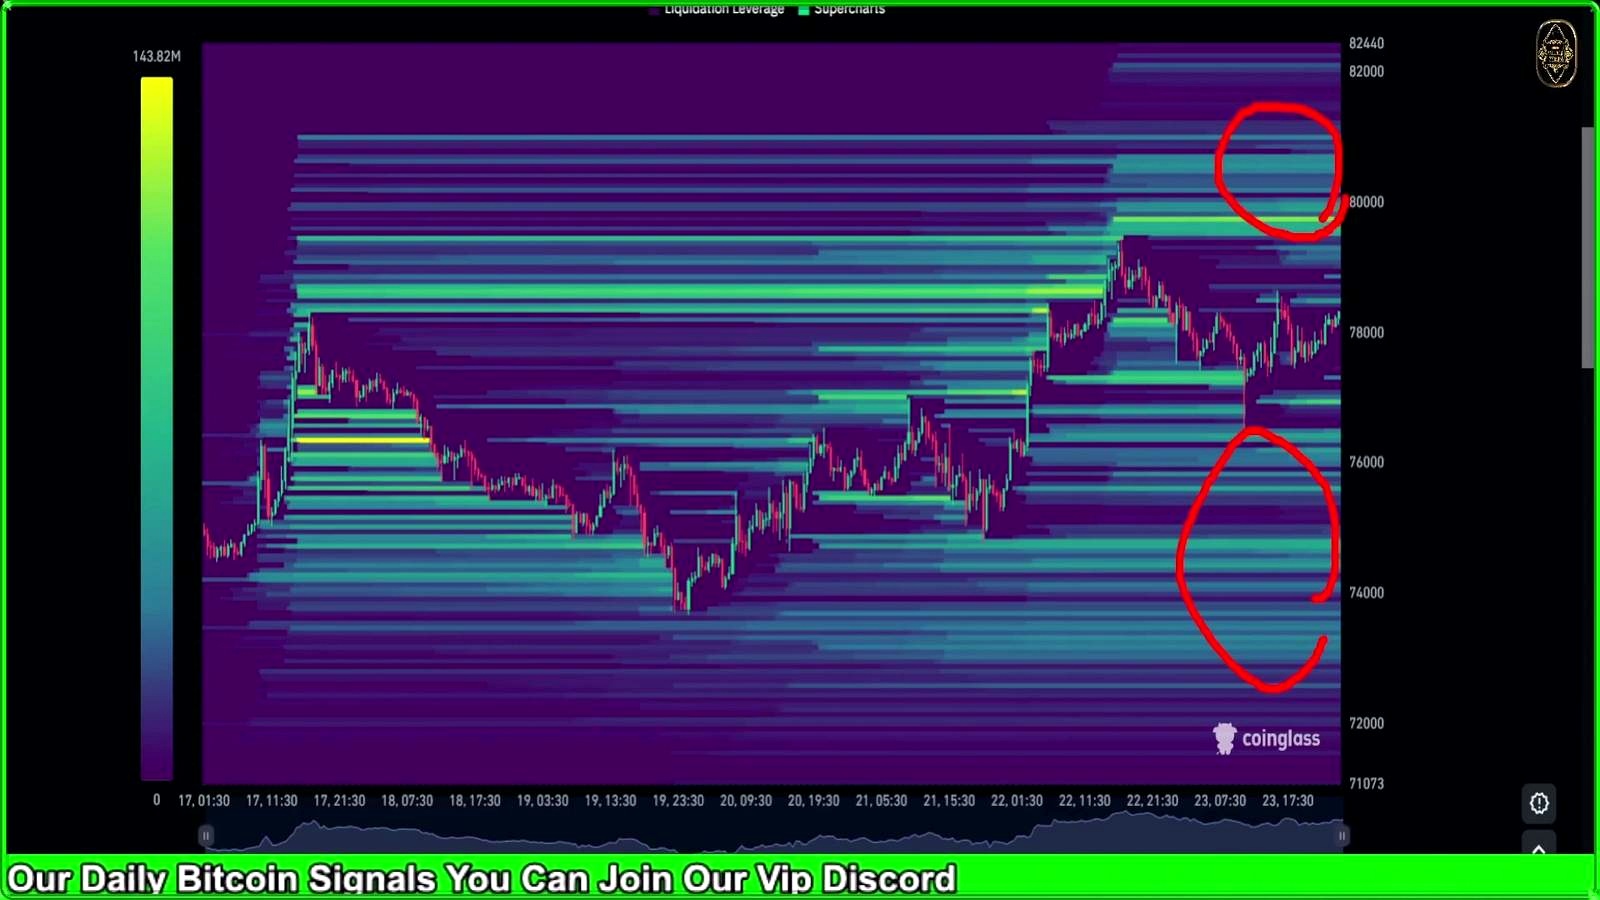
According to Thomas Boleto, Bitcoin Insights, one of the clearest reasons to expect an upside move is the liquidation map. He says the majority of stop losses are sitting above price at $80,000 and states that Bitcoin will go there “100%.” In his view, that concentration of liquidity makes $80,000 the obvious next destination before the market decides what comes next.
That logic is common in crypto trading circles. When a large cluster of short stops sits overhead, price can be drawn upward as market makers and momentum traders chase liquidity. It does not guarantee a lasting breakout, but it can produce a fast squeeze. That distinction matters. A stop-run to $80,000 is not the same thing as establishing support above it.
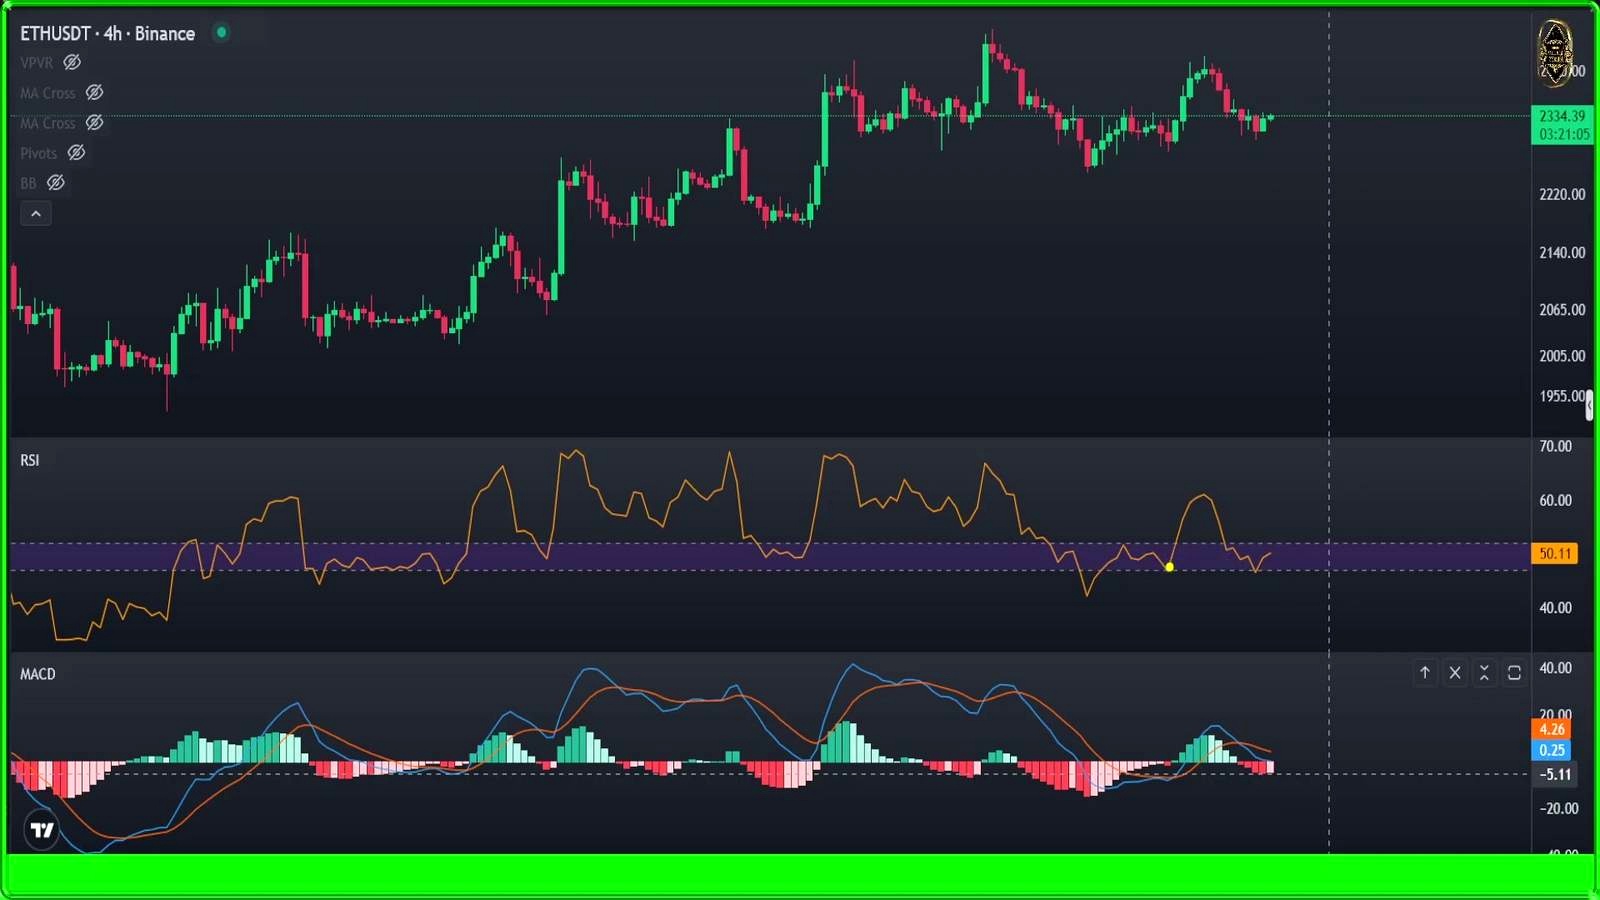
The host also argues that momentum indicators have not materially deteriorated. He says the daily MACD shows that “nothing changed, ” while emphasizing that Bitcoin still needs to break the last high so RSI can push higher. He also references a previously identified bearish divergence, suggesting the market is not free of warning signs even as he leans bullish.
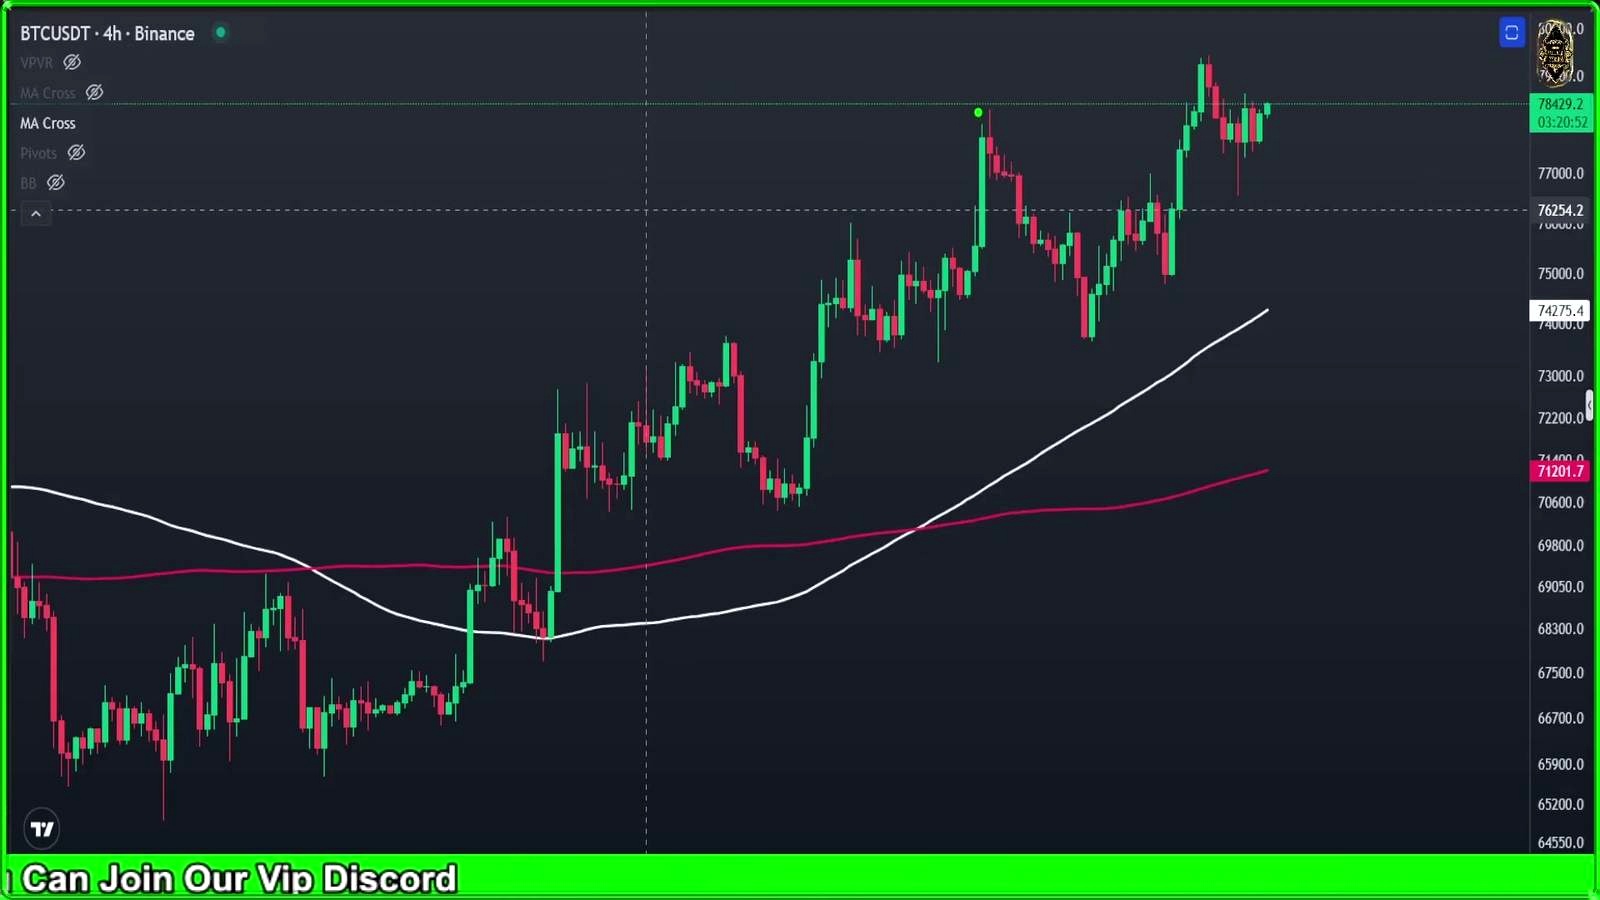
On the 4-hour chart, he says Bitcoin appears ready to move higher because it is breaking the last high and invalidating part of the short-term bearish setup. He then shifts to execution rather than prediction: if a wedge breaks downward, he says traders can short it; if it breaks upward, they can long it. On the 30-minute chart, he describes a choppy, low-volume market where his group first entered a short yesterday and then moved into a long today. He is explicit that conditions are difficult for day traders and says there is “no volume, ” which is an important qualifier for anyone treating a breakout as confirmed.
Outside Bitcoin, he sees supportive cross-asset context. He says U.S. dollar dominance is sitting at strong resistance and forming a symmetrical triangle. If that breaks lower, he expects a retest of the channel low, which he says would be good for crypto and support a bounce. That aligns with a well-known market relationship: a softer dollar often helps risk assets, including Bitcoin, though the inverse correlation is far from perfect on short timeframes.
What could go wrong
The most obvious threat to this bullish thesis is simple: Bitcoin fails again at the weekly 20-period moving average and gets rejected before it can trigger the squeeze toward $80,000. The analyst acknowledges repeated struggle at this zone, and that matters because repeated tests can end in either breakout or exhaustion. If buyers keep pressing but cannot reclaim the level decisively, the market may begin to look less like accumulation and more like distribution.
There is also tension inside the thesis itself. The host cites bullish daily moving-average structure, but also mentions bearish divergence and the need to break the last high to let RSI run further. That means momentum is not cleanly bullish yet. A market that rises into resistance while momentum lags can still produce a false breakout.
Another risk the video touches only lightly is volume. He says day trading is difficult because there is little volume. Thin markets can overshoot both ways, making liquidity hunts unreliable as directional signals. A push into $80,000 could end as a stop sweep rather than the start of a sustained move to $85,000 or $87,000.
And then there is the macro side. If dollar strength resumes instead of breaking lower, or if broader risk markets weaken, Bitcoin may struggle to convert technical setups into continuation. In that scenario, the “other side of the trade” is a rejection from resistance followed by a move back into the recent range, especially if the market loses the short-term uptrend lines the host is watching on lower timeframes.
What to watch next
The immediate trigger is whether Bitcoin can clear the resistance zone that has blocked it on multiple recent attempts and decisively take out the last local high. Above that, traders will be watching for a squeeze into $80,000, the level the analyst identifies as the main stop cluster. If price can reclaim and hold that area, the next upside checkpoints become $85,000 and then the weekly 100-period moving average near $87,000.
On the downside, failure to hold the short-term uptrend or a breakdown from the wedge structure on lower timeframes would weaken the bullish case quickly. Beyond Bitcoin itself, dollar dominance is a key cross-market tell. A downside break there would support the analyst’s view; renewed dollar strength would challenge it.
FAQ
What is an inverted hammer candle in Bitcoin trading?
An inverted hammer is a candlestick with a small real body and a long upper wick. After a decline or at resistance, it can signal that buyers are attempting to take control, though it usually needs confirmation from the next candles. On its own, it is not a guaranteed reversal signal.
Why do traders care about the 20 and 100 moving averages?
These moving averages help traders judge trend direction across different timeframes. A price rejection at the 20-period average on a weekly chart can show that the broader downtrend is still active, while a 20-over-100 crossover on a daily chart can suggest improving short-term momentum.
What does a liquidity map show around levels like $80,000?
A liquidity map estimates where stop losses and leveraged liquidations may be clustered. If many short stops sit above market price, Bitcoin can be pulled upward into that zone as those positions are forced to close. Traders use these maps to identify where fast, volatility-driven moves may occur.
How is this setup different from a confirmed Bitcoin breakout?
A setup is the condition that could lead to a breakout. A confirmed breakout usually means price closes above a key resistance level, holds it on a retest, and ideally does so with stronger volume and improving momentum. Without those signs, the move can still fail.
Why does U.S. dollar dominance matter for BTC?
Dollar dominance is often used as a proxy for broad dollar strength. When the dollar is strong, liquidity conditions can tighten and risk assets may struggle. When dollar strength softens, crypto and equities often get some relief, though the relationship is not always immediate or one-to-one.
Original Video

An Indian crypto journalist covering the developments in the Bitcoin and blockchain industries. Her work helps readers understand key changes in the world of digital assets.


