With Bitcoin holding the market’s attention, risk appetite is still spilling into smaller AI-linked tokens where traders are hunting for outsized upside. The real question is whether these fresh listings are setting up for another speculative leg higher or simply replaying the usual post-launch boom-and-bust cycle.
Core thesis: a breakout setup on a very new AI token
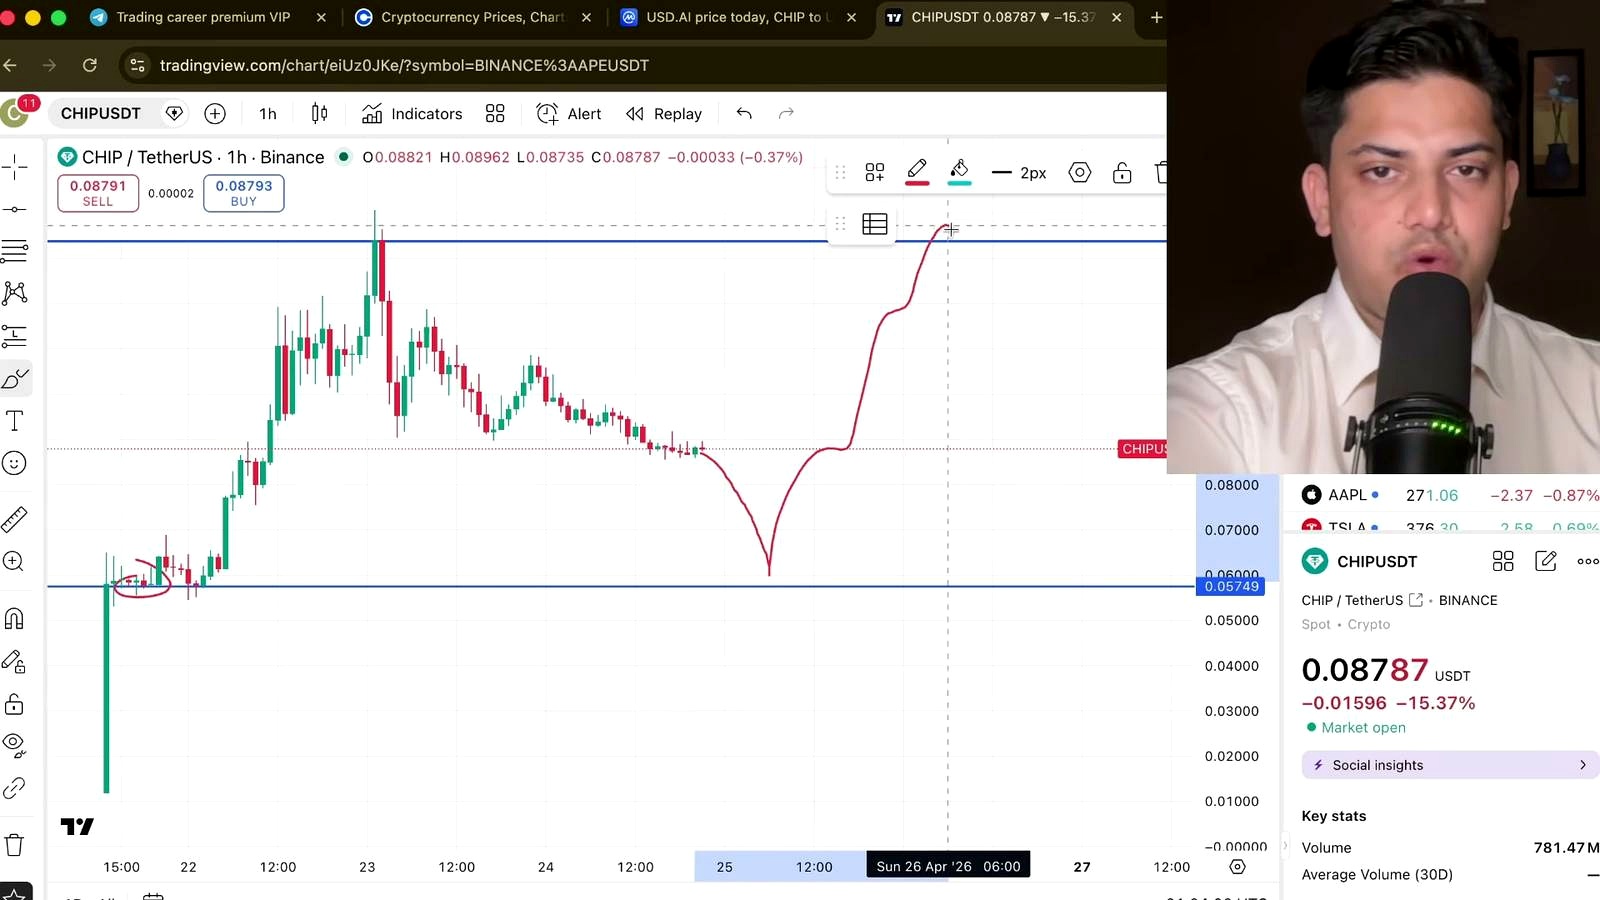
According to Crypto Aarav, the token CHIP, also referred to in the transcript as USD.ai CHIP, is a high-risk AI play that could move sharply higher if it clears a key resistance zone after a period of consolidation. His basic argument is straightforward: the token is only around 4 days old, it already rallied roughly 2.5x from an early support area, and because the chart history is so limited, traders should focus on a small number of key levels rather than assume mature market structure exists.
The analyst says CHIP formed a double top, then a bearish flag, followed by a major sell-off marked by two large marubozu-style red candles. In his view, the important signal is not blind dip-buying but a confirmed reclaim of the level where the token “lost the whole momentum.” If that breakout arrives with a close above resistance, he argues the token could target $2 in the shorter term, while floating a much more speculative long-range possibility of $10 by 2026.
That sits on the aggressive end of current market sentiment. The broader crypto market has repeatedly rewarded AI-related narratives over the last two cycles, but newly launched tokens are also where hype, thin liquidity, and reflexive leverage can create false breakouts. In general market terms, traders tend to demand much stronger confirmation on a 4-day-old chart than on established majors because price discovery is still unstable. The AI theme is undeniably strong, but that alone rarely protects a token from sharp retracements after an initial listing frenzy.
Why the AI comparison matters, and where it may not
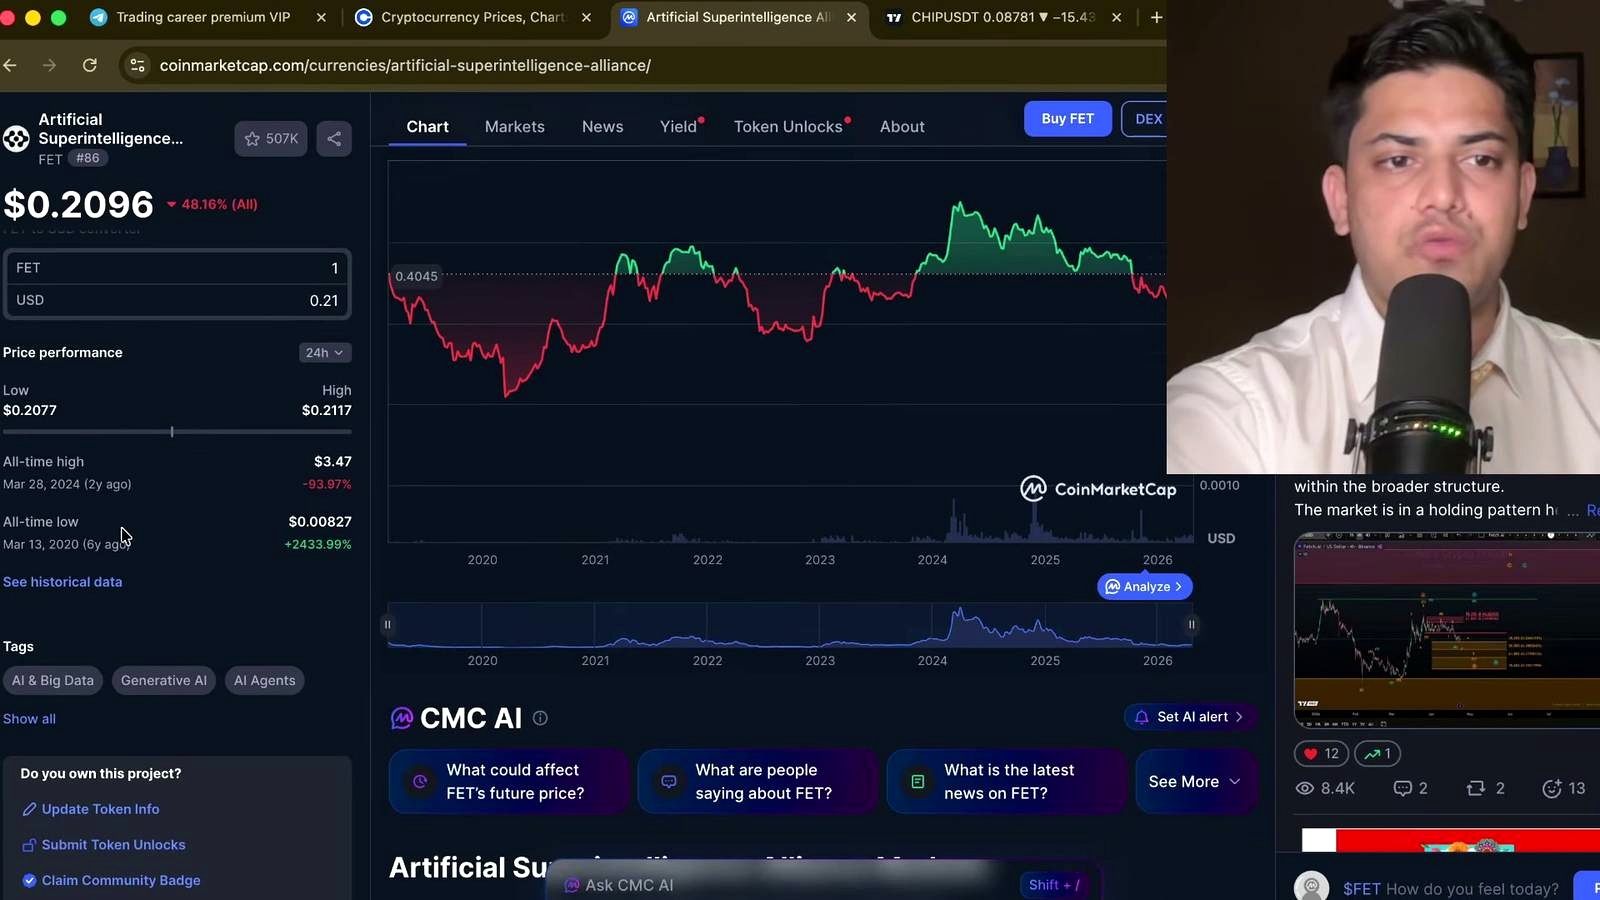
Crypto Aarav tries to frame CHIP within the larger history of AI-token winners. He points to earlier names including AGIX, FET, Ocean Protocol, and Injective, arguing that major upside in the sector has happened before and can happen again. He says one AI-related grouping “went over 100 times, ” and cites Injective from around 1.7 in 2023 as another example of a project that later delivered outsized returns.
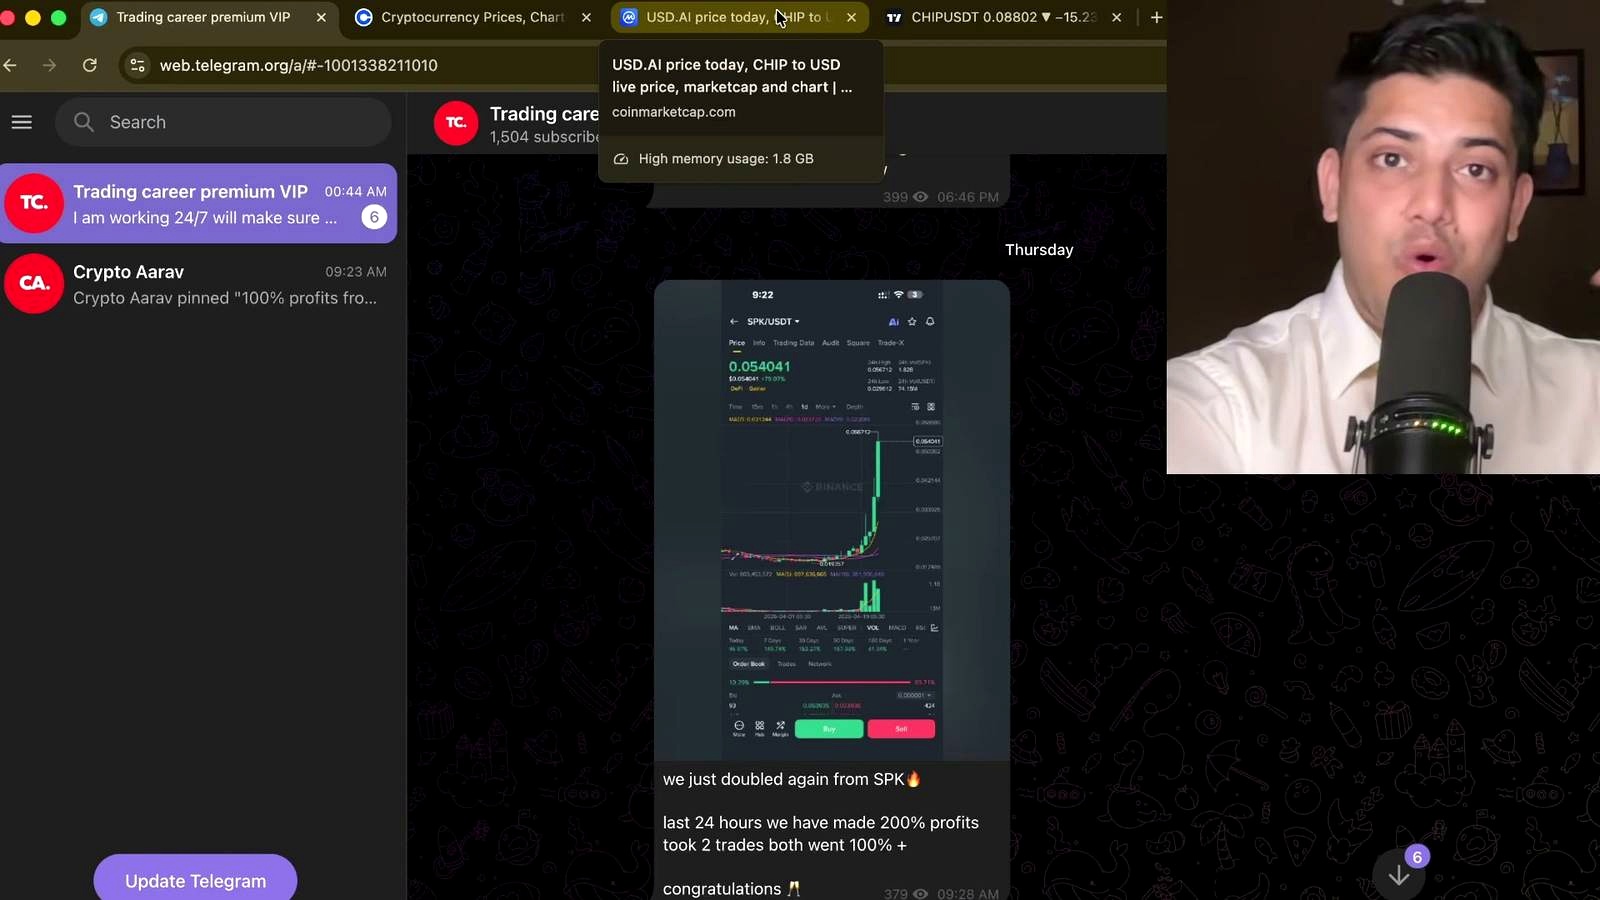
The host’s broader point is that crypto markets have already shown a willingness to aggressively reprice AI narratives when the sector catches momentum. He also says CHIP’s fundamentals look attractive because of a stated market capitalization of around $175 million, a supply of 2 billion coins, and roughly $550 million in 24-hour trading volume across platforms with perpetual trading access.
That kind of framing will resonate with momentum traders, especially while Bitcoin-led risk-on periods keep rotating capital into higher-beta themes. But the comparison has limits. Established AI tokens that achieved durable reratings typically had deeper exchange penetration, longer operating history, or clearer institutional narratives behind them. A fresh token can borrow the AI label without inheriting those same advantages. High volume in the first week can reflect real demand, but it can also reflect launch speculation, market-maker activity, and leverage-heavy churn rather than conviction buying.
Still, one technical point from the transcript does matter: Crypto Aarav repeatedly emphasizes accumulation. He argues that many tokens that later produced huge gains spent time building a base before the next leg up. In that sense, he is not calling for immediate vertical upside at any price. He is calling for either accumulation or a closing confirmation above resistance before he would become more aggressive.
Supporting analysis: support, confirmation, and the level around 0.057
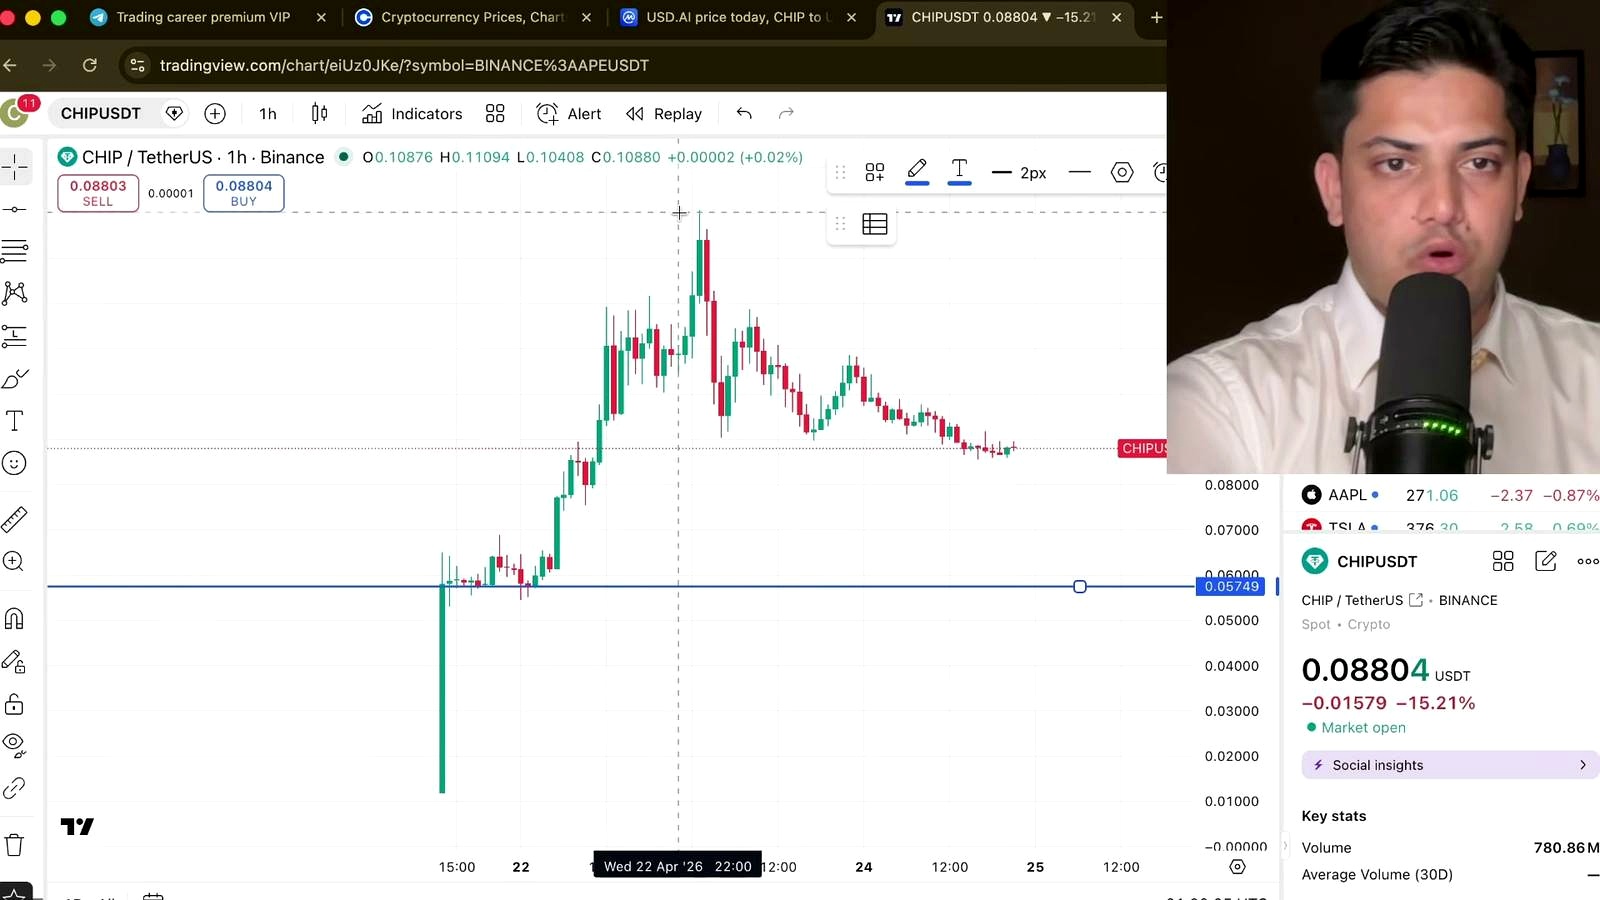
The practical setup in the video hinges on two levels. First, the analyst says there is an area where the “most number of people were interested, ” which he treats as the main support zone and a possible bounce area if price revisits it. He argues that heavy prior buying interest there raises the odds of a hard reaction if the token sells off into that level again.
Second, he identifies the zone where momentum broke down after the double top and bearish continuation structure. That is the resistance area he wants to see reclaimed on a closing basis. Late in the transcript, he references research “over here at 0.057” with closing confirmation, suggesting that level is central to his near-term trigger.
Crypto Aarav’s process is more conditional than his headline targets imply. He explicitly says he would do more work only after a breakout and closing confirmation, and even says he might consider deploying as much as $500,000 or even $1 million, though he adds he is not certain about the amount. That matters because it shows the setup is thesis-driven but not yet fully active in his view.
For traders, the interesting part is the asymmetry between the chart’s age and the volume profile. A token with a market cap of $175 million and claimed daily volume of $550 million can move violently in both directions. If a break above 0.057 holds, speculative momentum can accelerate quickly. If it fails, the same leverage and liquidity dynamics can drag price back into the original support pocket just as fast.
What could go wrong
The clearest way this thesis fails is simple: resistance never turns into support. If CHIP cannot close above the breakdown zone the analyst is focused on, the bullish case becomes much weaker. In that scenario, the double top and bearish-flag structure stop being a temporary shakeout and start looking like the defining pattern of the token’s early price discovery.
There are also risks the video touches only lightly. One is that very new tokens often lack enough chart history to make pattern analysis reliable. Another is that launch-week volume can be deceptive. A print of $550 million in trading activity sounds substantial, but early turnover can be dominated by short-term speculators rather than long-duration holders. If that crowd exits, support can disappear quickly.
There is also the valuation problem. A move to $2 from sub-0.057 levels would imply a dramatic repricing in a short time. A move to $10 by 2026 would require not just AI-sector enthusiasm, but sustained execution, exchange support, liquidity retention, and a market environment willing to reward speculative growth stories. Bitcoin itself is the other side of this trade: if BTC loses momentum and the market turns defensive, newly launched altcoins are usually hit first and hardest.
What to watch next
The first trigger is whether CHIP can produce a convincing close above the resistance zone Crypto Aarav highlighted, especially around 0.057. Without that, the bullish setup remains incomplete. The second is whether price revisits the original heavy-interest support area and actually bounces, rather than slicing through it.
Beyond the chart, traders should watch whether volume remains elevated after the token’s first week. A project that is roughly 4 days old needs to prove that activity can persist once the initial listing excitement fades. In a Bitcoin-led market, the macro filter is also obvious: if BTC remains firm, AI beta may keep attracting flows; if BTC weakens, this kind of breakout thesis becomes much harder to sustain.
FAQ
What is a marubozu candle in crypto trading?
A marubozu is a candlestick with little or no wick, showing strong one-way pressure during the trading period. A large red marubozu suggests sellers controlled the session from near open to close. Traders often treat consecutive marubozu candles as evidence of strong momentum, though they can also appear near exhaustion points.
Why are newly launched tokens harder to analyze technically?
They have limited price history, fewer tested support and resistance zones, and unstable liquidity. That makes classic chart patterns less reliable because there is not enough historical behavior to confirm how market participants tend to react at key levels.
How does AI-token speculation usually compare with Bitcoin moves?
AI tokens generally behave like higher-beta trades. When Bitcoin is stable or trending up, money often rotates into narrative-driven sectors such as AI. When Bitcoin turns lower or volatility spikes, those same tokens usually underperform because traders cut risk and move back toward larger, more liquid assets.
What does “closing confirmation” mean?
It means waiting for a candle to finish above or below an important level rather than reacting to an intraday spike. Traders use it to reduce the odds of getting trapped in a fake breakout or breakdown.
What happened in past AI-token rallies that traders look for now?
The common pattern has often been early hype, then consolidation or accumulation, followed by a stronger trend if the project keeps attracting liquidity and narrative momentum. That is why many traders focus less on the first spike and more on whether price can build a base and then reclaim resistance with volume.
Original Video

Omar Al-Sharif lives and works in the UAE and is involved in the blockchain technology industry. He writes articles on Bitcoin and digital assets as a personal passion, explaining complex topics in simple and understandable language.


