Fear has returned to the Bitcoin market just as macro signals are turning less straightforward. The immediate question for traders is whether the latest pullback is the start of a deeper breakdown or the setup for a squeeze higher. According to The Crypto Cowboy, institutional flows, options positioning and trader sentiment all point to a floor forming near $77,000, at least for now.
Core thesis: a floor near $77K, with $82.6K as the upside target

According to The Crypto Cowboy, “smart money” accumulated roughly $360 million to $390 million worth of Bitcoin during a fear-driven selloff while retail traders leaned short. The host’s central argument is that institutions used the dip to build a floor in the $77,500 to $78,400 area, creating the conditions for a rebound toward $82,599.
He ties that case to a cluster of market signals. In his telling, roughly $245 million in USDT moved into institutional custody before the session opened, another $200 million was staged on Binance, and about 5,029 BTC flowed into Coinbase Institutional during the day. He also claims institutions used Kraken to stage approximately 14,000 BTC to push price lower before later removing 5,000 BTC, which he interprets as engineered weakness followed by accumulation.
The broader thesis is tactically bullish but not structurally euphoric. The analyst describes the move as a wave-four corrective bounce rather than the start of a clean new bull impulse. His stated primary target is $82,599, with an extended wave-four zone at $86,100 to $87,270. At the same time, he argues this remains a bounce inside a larger corrective structure, not an all-clear signal.
That framing sits somewhere between consensus and contrarian. The near-term bullish part fits a market that often rallies when positioning becomes too one-sided, especially after long liquidations clear leverage from the downside. But the caution about a larger corrective structure also reflects a more skeptical read than the outright bullish narratives that tend to dominate after strong rebounds. In general market terms, crypto traders have spent much of this cycle watching ETF and institutional demand absorb dips, but that demand has not eliminated macro sensitivity. If rates stay higher for longer, liquidity remains constrained, and risk assets can still struggle even with healthy spot demand underneath.
Why the analyst thinks the setup favors upside
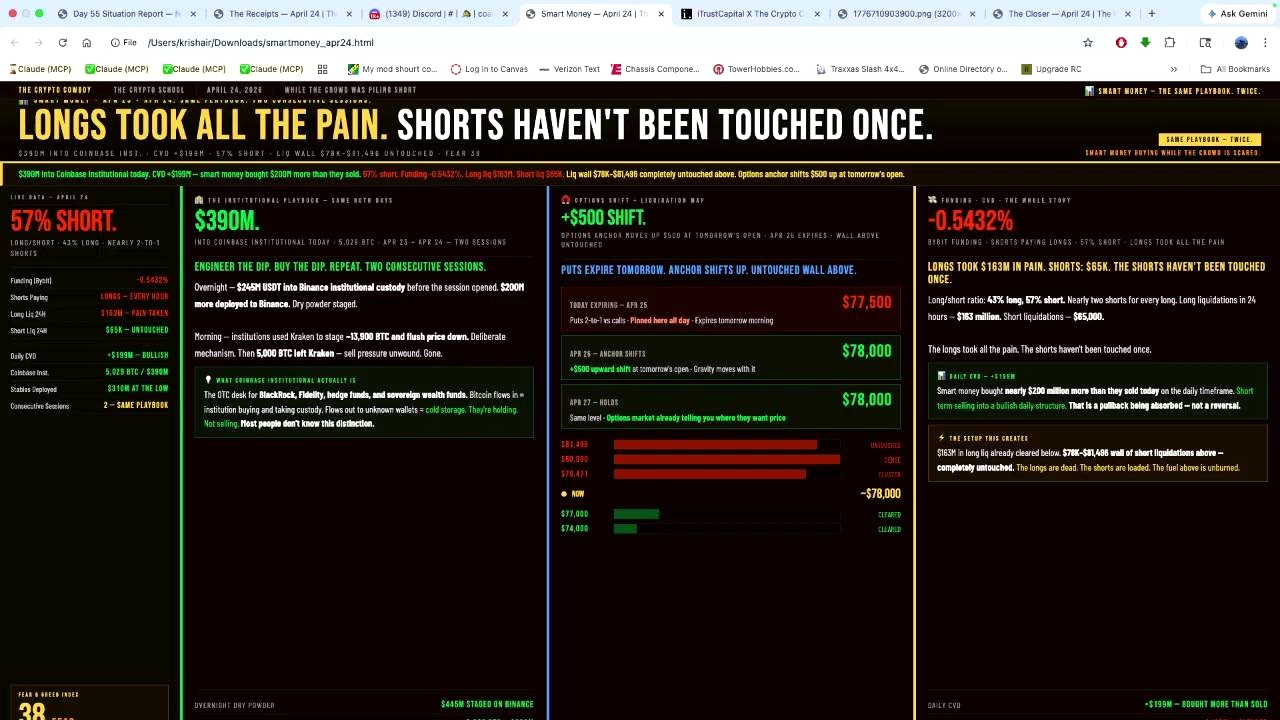
According to The Crypto Cowboy, the strongest part of the setup is not just whale flow but the combination of options positioning, liquidation clusters and sentiment. He says the April 25 options expiry was pinned around $77,500, where puts outnumbered calls by more than 2-to-1. After that expiry, he sees the “price magnet” shifting higher, with max pain at $78,000 on both April 26 and April 27.
He also points to a liquidation zone stretching from $78,000 to $81,496, with dense short liquidations around $79,471 and $80,000. His reading is simple: downside long liquidation fuel from $77,000 to $74,000 has already been spent, while the fuel above remains untouched. In other words, if Bitcoin starts moving higher, it could force shorts to cover into a thin overhead zone.
The sentiment indicators he cites reinforce that argument. He says the funding rate on Bybit was negative 0.5432%, long-short positioning sat at 43% long versus 57% short, and fear and greed was at 38. He also says daily CVD was positive $199 million, which he interprets as smart money buying into panic selling.
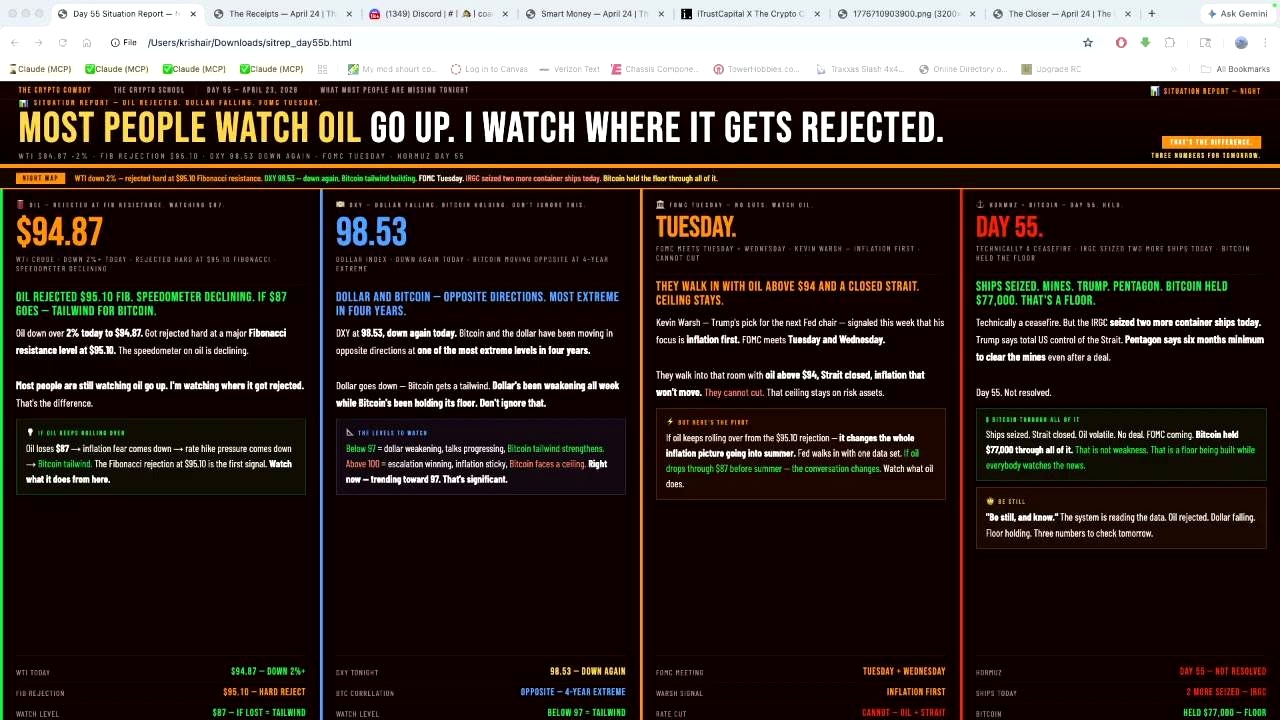
On the macro side, the analyst argues falling pressure from oil and a weaker dollar could support Bitcoin. He notes West Texas Intermediate dropped more than 2% to $94.87 after rejecting a Fibonacci resistance around $95.10, and says a break below $87 would materially ease inflation fears. He also points to the DXY at 98.53, arguing that Bitcoin and the dollar have been moving in opposite directions at one of the most extreme levels in four years. The practical takeaway is that if energy cools and the dollar weakens further, risk assets including BTC may get breathing room.
Technically, his near-term trigger is very specific: the 4-hour RSI needs to hold above 50. He says it was at 50.55, making that line the key inflection point. On the daily chart, he highlights support from the 50-day SMA at $75,399 and resistance from the 200-day EMA at $82,522 and the 200-day SMA at $85,222. Daily RSI, he says, stood at 62.97, suggesting room to run without obvious divergence.
What could go wrong
The biggest problem with this thesis is that exchange-flow interpretation is far from definitive. Large transfers between venues, custody providers and OTC desks can signal accumulation, but they can also reflect internal reshuffling, hedging or liquidity management rather than outright directional buying. That means the claim that institutions deliberately “engineered the dip” is a strong interpretation, not a settled fact.
There is also a macro risk the analyst only partly addresses. He flags the Tuesday and Wednesday FOMC meeting and says “there’s no cuts coming, ” but a hawkish Fed, sticky inflation, or renewed energy shocks could overpower any short-term technical setup. He also mentions geopolitical strain around Hormuz and says the Pentagon sees 6 months as a minimum to clear mines even after a deal. If oil turns back up instead of breaking down, the inflation-relief narrative weakens quickly.
On the chart, the invalidation is clearer than the upside. The analyst says a 4-hour RSI close below 50 would force a reassessment. He also points to $77,000 as institutional support and $75,399 as the next major floor. Lose those levels decisively, and the idea of a contained wave-four bounce starts to break down. His own longer-term caution matters here: he still describes the move as part of a correction, and he references a head-and-shoulders measured move with targets around $35,000 and $41,892. Those are not imminent calls in his framework, but they underline the risk that this rally thesis is tactical, not secular.
What to watch next
The immediate trigger is whether BTC can reclaim the short-liquidation cluster near $79,471 and then clear $80,000. If that happens while the 4-hour RSI stays above 50, the analyst’s path toward $82,599 remains live.
On the downside, traders will be watching whether price revisits $77,000 and whether the daily 50-day SMA at $75,399 holds. On the macro side, the next major catalyst is the Tuesday-Wednesday FOMC meeting, along with whether oil extends lower from $94.87 toward the analyst’s $87 threshold. A weaker DXY below the current 98.53 area would also help the bullish case.
FAQ
What is “max pain” in Bitcoin options trading?
Max pain is the price level where the largest number of options contracts expire worthless, causing the greatest losses for options buyers. Traders watch it because price sometimes gravitates toward that level into expiry, especially in heavily traded short-dated options markets.
What does a negative funding rate mean for BTC?
A negative funding rate usually means short sellers are paying long holders in perpetual futures markets. That often signals bearish positioning is crowded. If price starts rising anyway, those shorts can be forced to cover, adding fuel to a squeeze.
Why does the U.S. dollar index matter for Bitcoin?
Bitcoin often trades inversely to the dollar, especially during liquidity-driven phases. A falling DXY can make risk assets more attractive by easing financial conditions, while a strong dollar can pressure global liquidity and weigh on BTC.
How is this setup different from a full bull-market breakout?
In the analyst’s framework, this is a corrective rebound inside a larger structure, not a confirmed new impulse leg. A true breakout case would usually require stronger trend confirmation, sustained closes above major moving averages, and less reliance on short-covering as the primary catalyst.
What happened the last time Bitcoin traded near the mid-$70,000s?
The mid-$70,000s have recently acted as an important battleground between dip buyers and short sellers. In this transcript, The Crypto Cowboy cites prior support clusters in the upper $60,000s and says the market has repeatedly respected defined technical levels before reversing, which is why he treats the current $75,000 to $77,000 zone as critical.
Source

An Indian crypto journalist covering the developments in the Bitcoin and blockchain industries. Her work helps readers understand key changes in the world of digital assets.


