Traders keep getting the same frustrating signal from Bitcoin: breakouts fade, breakdowns stall, and momentum disappears just when conviction should build. That leaves the market with a simple question, range continuation or the start of a real directional move? According to AB krypto, the answer now hinges on whether BTC can hold a short-term demand zone above 77,465 or finally lose it on a confirmed hourly close.
Bitcoin’s near-term thesis is less about conviction than confirmation
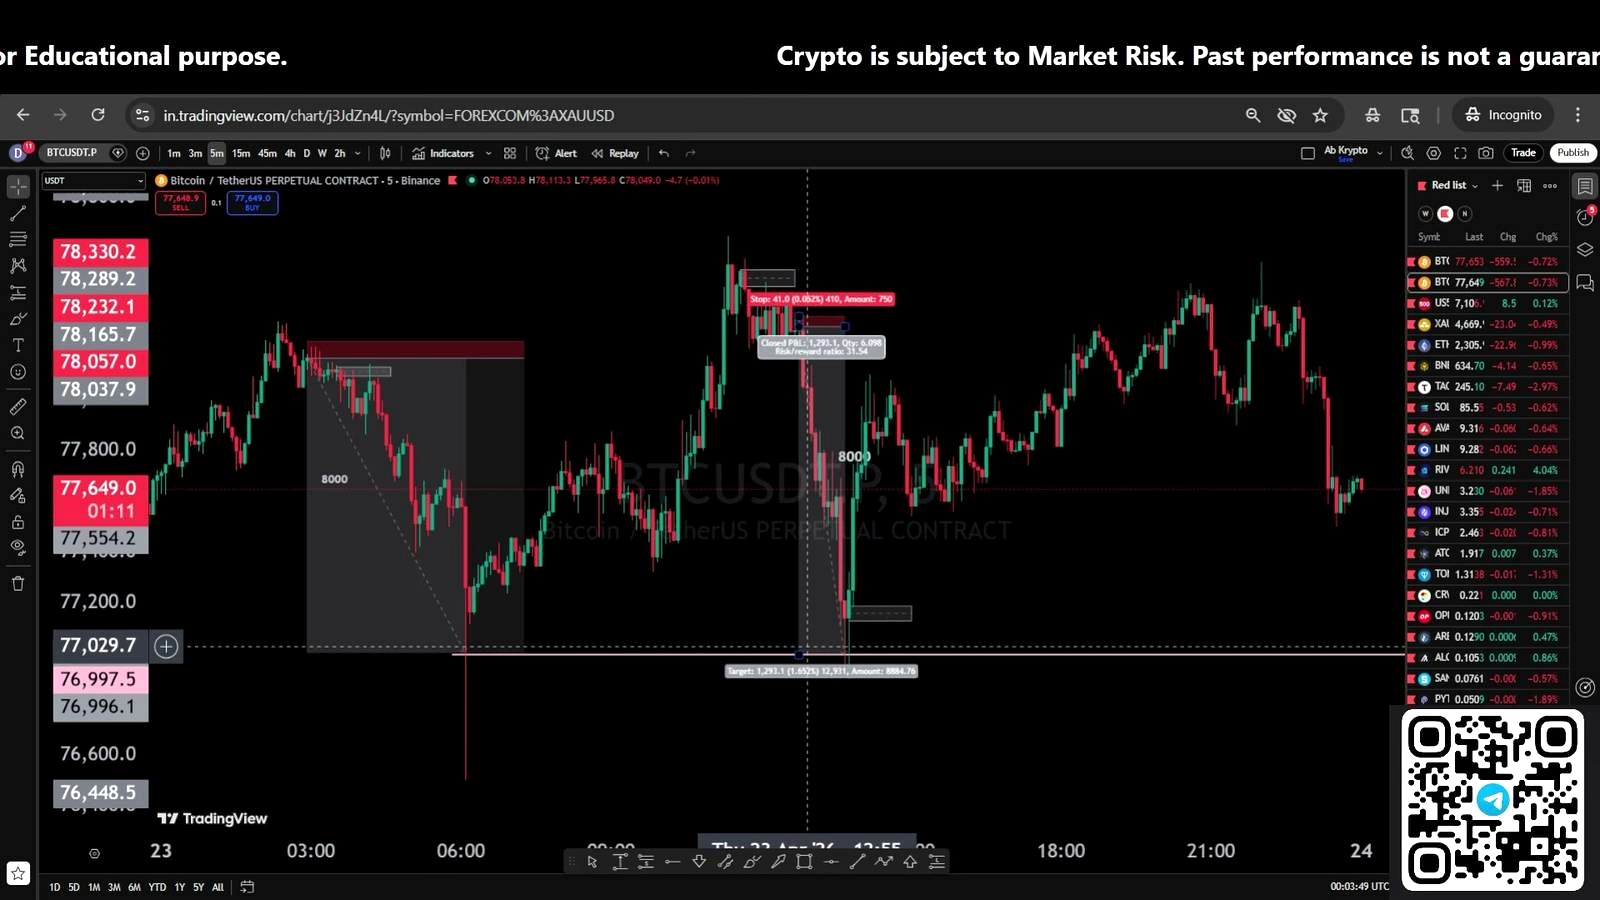
According to AB krypto, Bitcoin is stuck in a consolidation where neither bulls nor bears have been able to generate follow-through. The host says the daily chart is printing what looks like a hammer candle, suggesting rejection from lower levels, while the 4-hour chart still shows a range with failed attempts to break either side. His key structural floor on that higher timeframe is 77,621, with the more actionable trigger on the 1-hour chart sitting at 77,465.
The practical setup is straightforward. If a 1-hour candle closes below 77,465, AB krypto argues traders should look to short the retracement rather than chase the first breakdown candle. If that close does not happen, he says traders should wait for a higher-high structure to form and then consider a long. In other words, he is not calling for a blind directional bet; he is calling for a reactive trade based on confirmation.
That framing fits the broader market mood. Bitcoin often enters these low-conviction stretches after a sharp move, when liquidity sits on both sides of the range and leverage gets punished. In those conditions, traders usually want one of two things: a reclaim with expanding volume, or a clean support loss followed by failed recovery. The challenge for the bullish side is that repeated rejection from supply can signal seller control even if price has not yet broken down. The challenge for bears is that hammer-style candles near support often mark local exhaustion, especially when downside momentum fails to expand after a flush.
So AB krypto’s thesis is neither fully bullish nor outright bearish. It is conditional, short-term, and highly dependent on market structure holding or failing around a narrow zone in the high-77,000s.
Why the demand-and-supply framework matters here
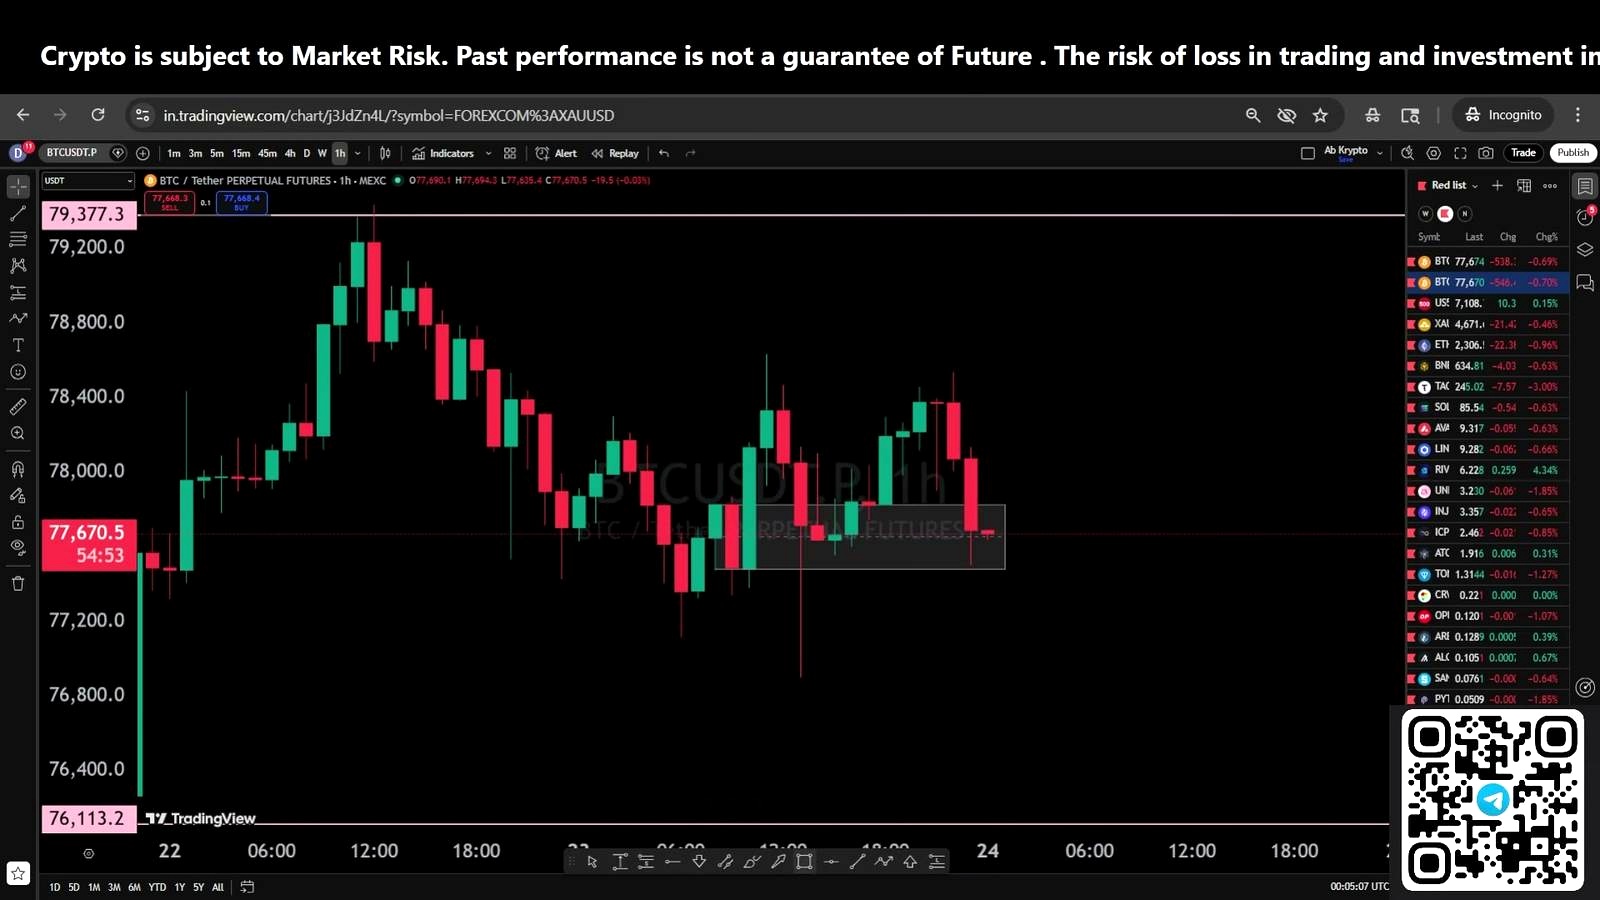
AB krypto’s explanation for the chop is built around a familiar market-structure idea: Bitcoin is bouncing from demand and getting rejected at supply. On the 1-hour chart, he says the market has returned to a support area that previously triggered a pump. At the same time, the earlier rally failed because it ran into a supply range, which he says explains why buyers were rejected after stepping in on the retracement.
That matters because it clarifies the trade logic. When price keeps respecting demand below and supply above, the market is not trending; it is auctioning between zones. In that environment, entries become less about predicting direction and more about waiting for one side to lose control. That is why the analyst emphasizes either a break of the hourly bottom or a higher-high formation. A breakdown without continuation is a trap. A bounce without a structure shift is just another range rotation.
He also notes that a short taken earlier delivered roughly 1,300 points before the market reversed, reinforcing his broader point that quick tactical trades are working better than trend-chasing. That is often true in compressed ranges where directional conviction is low and liquidity hunts are frequent.
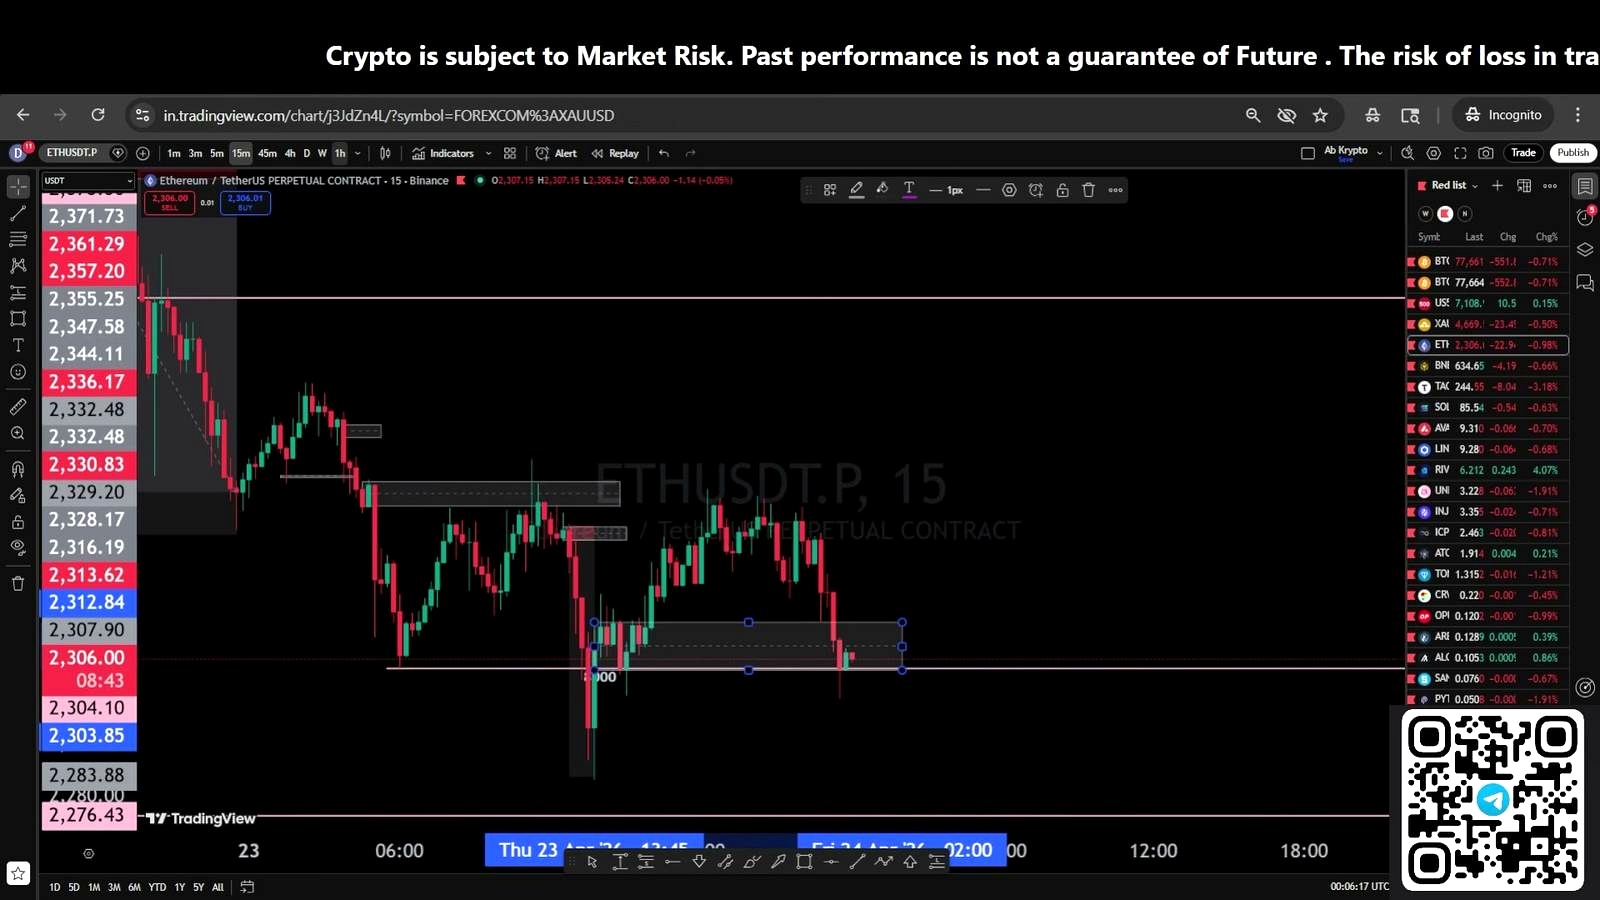
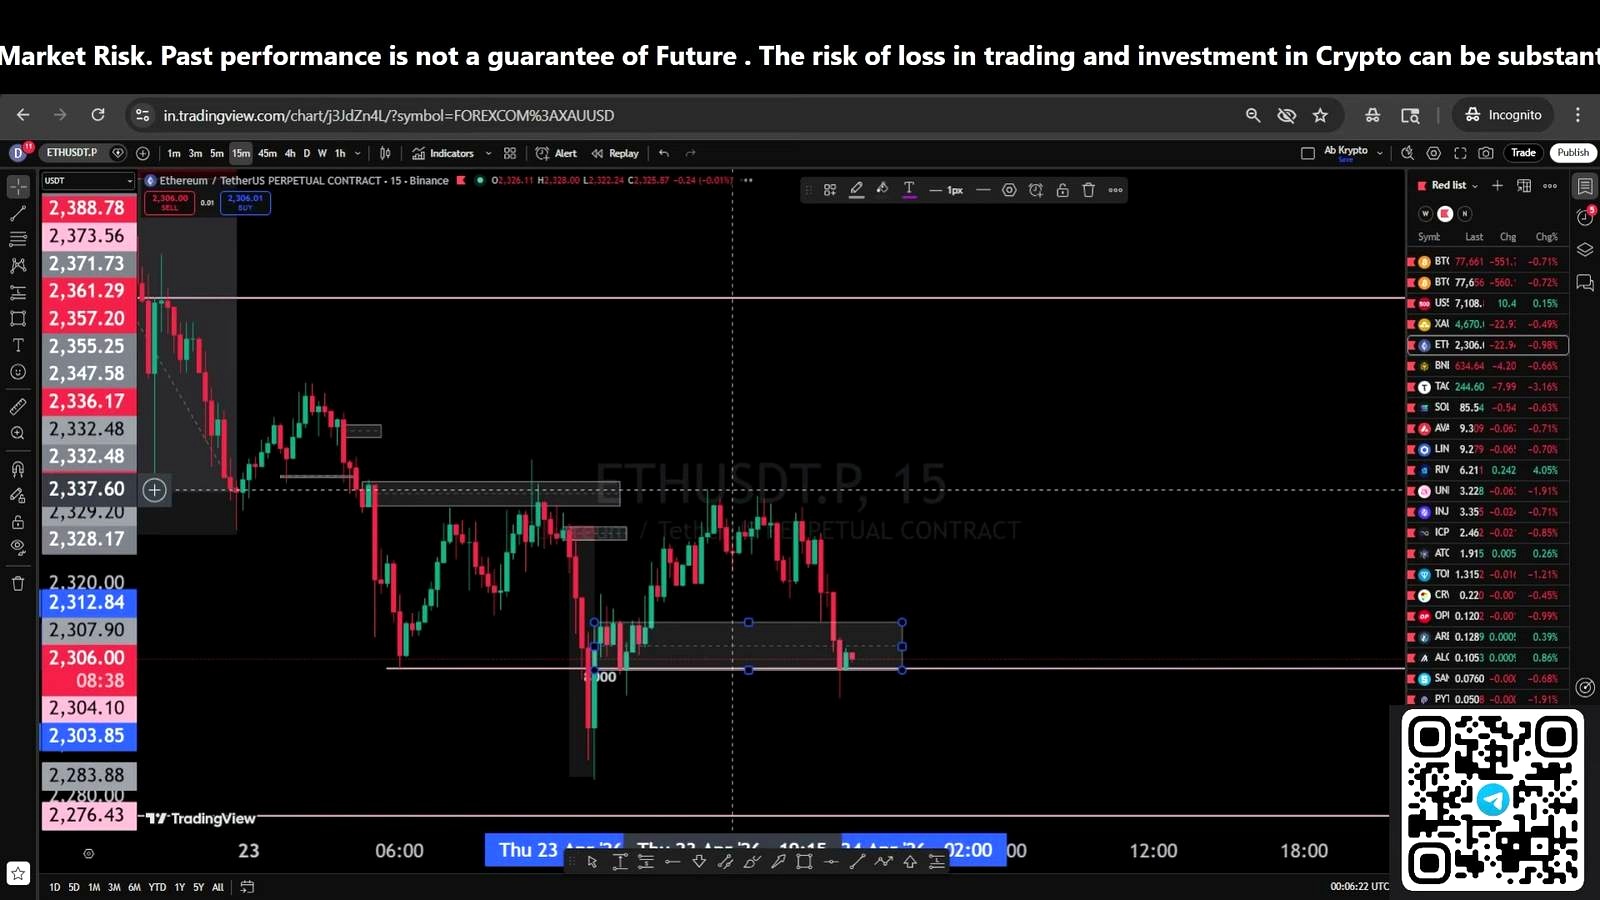
AB krypto extends the same logic to Ethereum, saying ETH has a similar support structure on the 1-hour and 15-minute charts but looks weaker than Bitcoin on the hourly timeframe. If that support survives, he says a long opportunity could emerge. If it breaks, he favors the same breakdown-and-retracement short setup used for BTC.
The cross-asset read is useful even for Bitcoin traders. When Ethereum underperforms during a fragile crypto tape, that can be read as a sign of weaker risk appetite overall. If ETH starts losing support decisively while BTC is still hovering over 77,465, some traders would interpret that as a warning that Bitcoin’s floor is also vulnerable.
What could go wrong with this setup
The most obvious risk to AB krypto’s framework is that the market keeps doing exactly what it has been doing: producing false breaks in both directions. An hourly close below 77,465 might not be enough if the move comes on thin liquidity or gets quickly reclaimed. In that case, traders who short the retracement could be stepping into a bear trap rather than a real trend shift.
The bullish version has similar risks. A higher-high formation on the lower timeframe can still fail if Bitcoin runs back into the same supply zone that rejected buyers previously. Without stronger momentum or broader market participation, a local structure break can amount to little more than another short-lived squeeze.
There are also risks the transcript does not explore in detail. Macro headlines can overwhelm chart structure, especially around rate expectations, dollar strength, or sudden moves in equities. Derivatives positioning matters too: if open interest is elevated and funding is one-sided, price can move sharply through technical levels only to reverse once leveraged traders are cleared out.
The other side of the trade is simple. Bears need a clean break and failed recovery below 77,465. Bulls need support to hold and a visible higher-high sequence that proves buyers are regaining control. Without one of those conditions, the highest-probability outcome may simply be more churn.
What to watch next
The first trigger is the hourly close around 77,465. If Bitcoin closes below it and then retraces weakly, that would align with AB krypto’s short setup. The second trigger is the 4-hour floor near 77,621; if BTC keeps defending that broader range support, bears still lack confirmation.
On the upside, traders should watch for a genuine higher-high formation on the 1-hour chart rather than just a reflex bounce from demand. If Ethereum starts stabilizing alongside Bitcoin instead of underperforming, that would strengthen the case for a broader relief move. If ETH breaks down first, it could be an early warning that Bitcoin’s support is next.
FAQ
What is a hammer candle in Bitcoin trading?
A hammer candle is a candlestick with a small body and a long lower wick. It usually appears after a sell-off and suggests buyers stepped in aggressively after price traded lower. Traders often treat it as a potential reversal signal, but it is stronger when confirmed by follow-through in the next candles.
What does “short the retracement” mean?
It means waiting for price to break support first, then rebound into that former support area, now acting as resistance, before entering a short position. Many traders prefer that approach because it can offer a cleaner invalidation point than chasing the initial breakdown candle.
Why does a higher-high formation matter on the 1-hour chart?
A higher high suggests buyers are doing something they were not doing before: pushing price above a prior swing high. In a choppy market, that can be an early sign that momentum is shifting. On its own it is not enough, but combined with higher lows it can mark the start of a short-term trend reversal.
How is this different from a normal range-bound Bitcoin market?
It is not especially different. What stands out here is the repeated lack of momentum after both breakouts and breakdowns. That usually signals indecision, heavy two-way liquidity, or an overleveraged market where directional moves keep getting faded.
Why do traders compare Bitcoin and Ethereum strength?
Ethereum often behaves like a higher-beta version of Bitcoin. When ETH is weaker than BTC during a fragile market, traders sometimes see that as a sign that risk appetite is deteriorating. When ETH starts outperforming, it can indicate improving confidence across crypto more broadly.
Video Reference

An Indian crypto journalist covering the developments in the Bitcoin and blockchain industries. Her work helps readers understand key changes in the world of digital assets.


