Bitcoin traders are stuck between two competing realities: price has kept grinding higher, but bearish calls for a deeper unwind have not fully gone away. The real question is whether this rally is the start of a larger breakout or just a final push before a broader reversal. According to 100XClub, the answer is a short-term bullish extension first, followed by a much larger move lower that could send BTC back below $60,000.
The Core Thesis: Short-Term Upside, Then a Bigger Breakdown
According to 100XClub, the mistake in the earlier bearish setup was focusing too heavily on Bitcoin’s chart while missing a key signal from the total crypto market cap. The host said he had expected a rejection after Bitcoin’s move toward $80,000, but now argues that the broader market has not yet completed the kind of retrace structure that would normally support a high-conviction short.
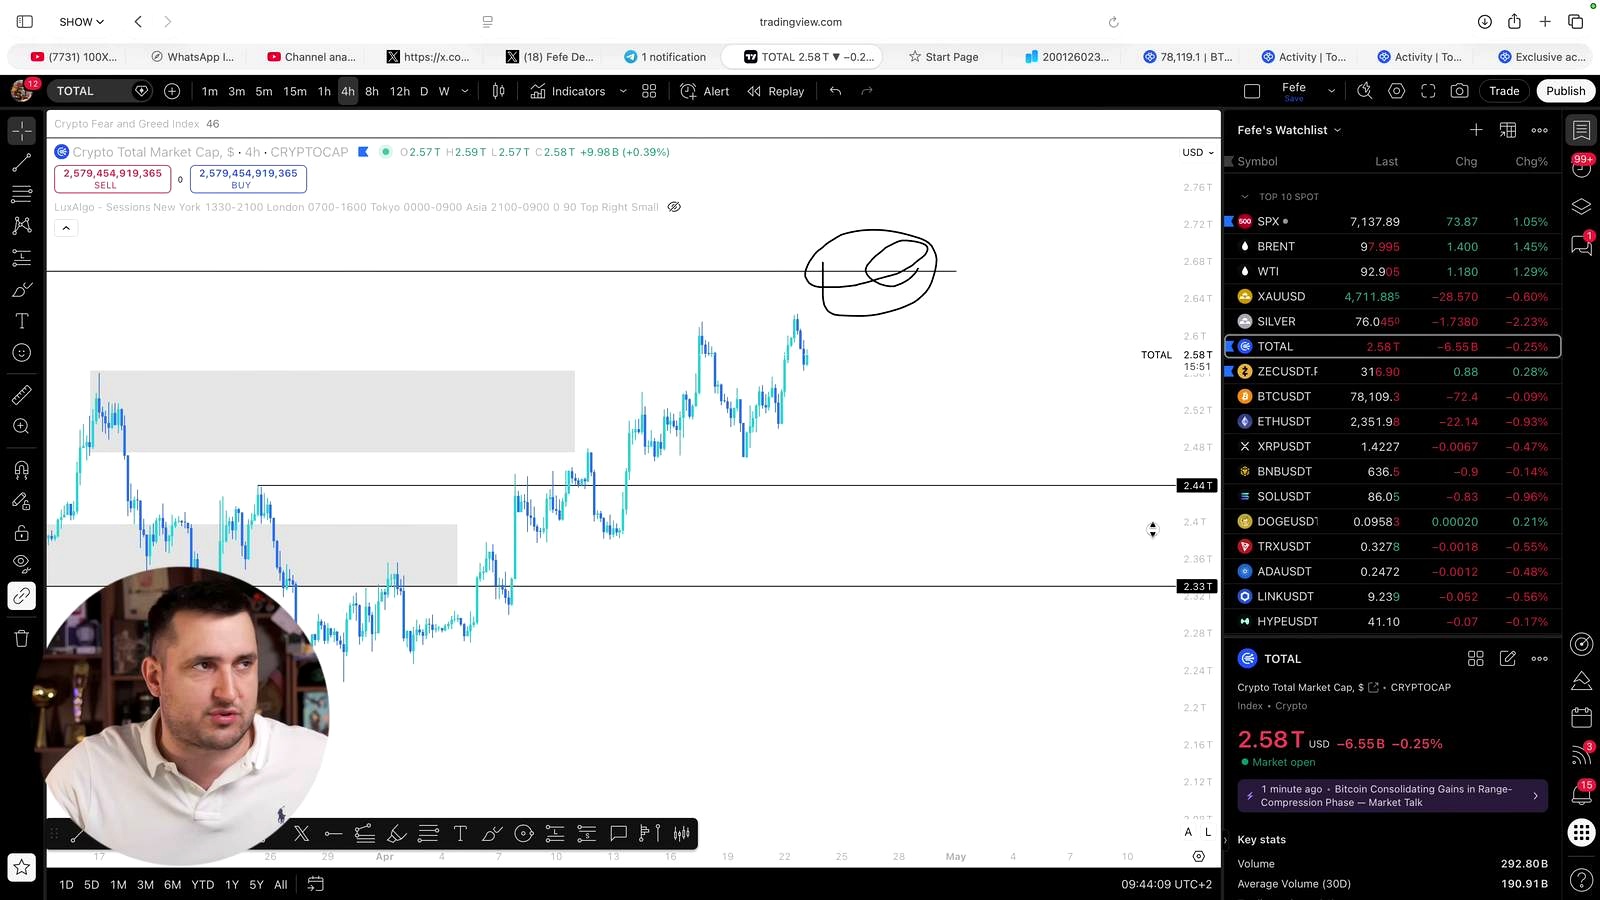
His revised framework centers on total crypto market capitalization reaching roughly $2.67 trillion, which he treats as the key area where a real rejection could begin. Until that level is hit, he says the market is “most likely bullish, ” at least on lower time frames. In practical terms, that means he is no longer trying to force a macro short immediately. Instead, he is looking to trade longs on the 4-hour, 1-hour, and even 15-minute chart until the total market cap reaches that zone and prints a higher-time-frame market structure shift to the downside.
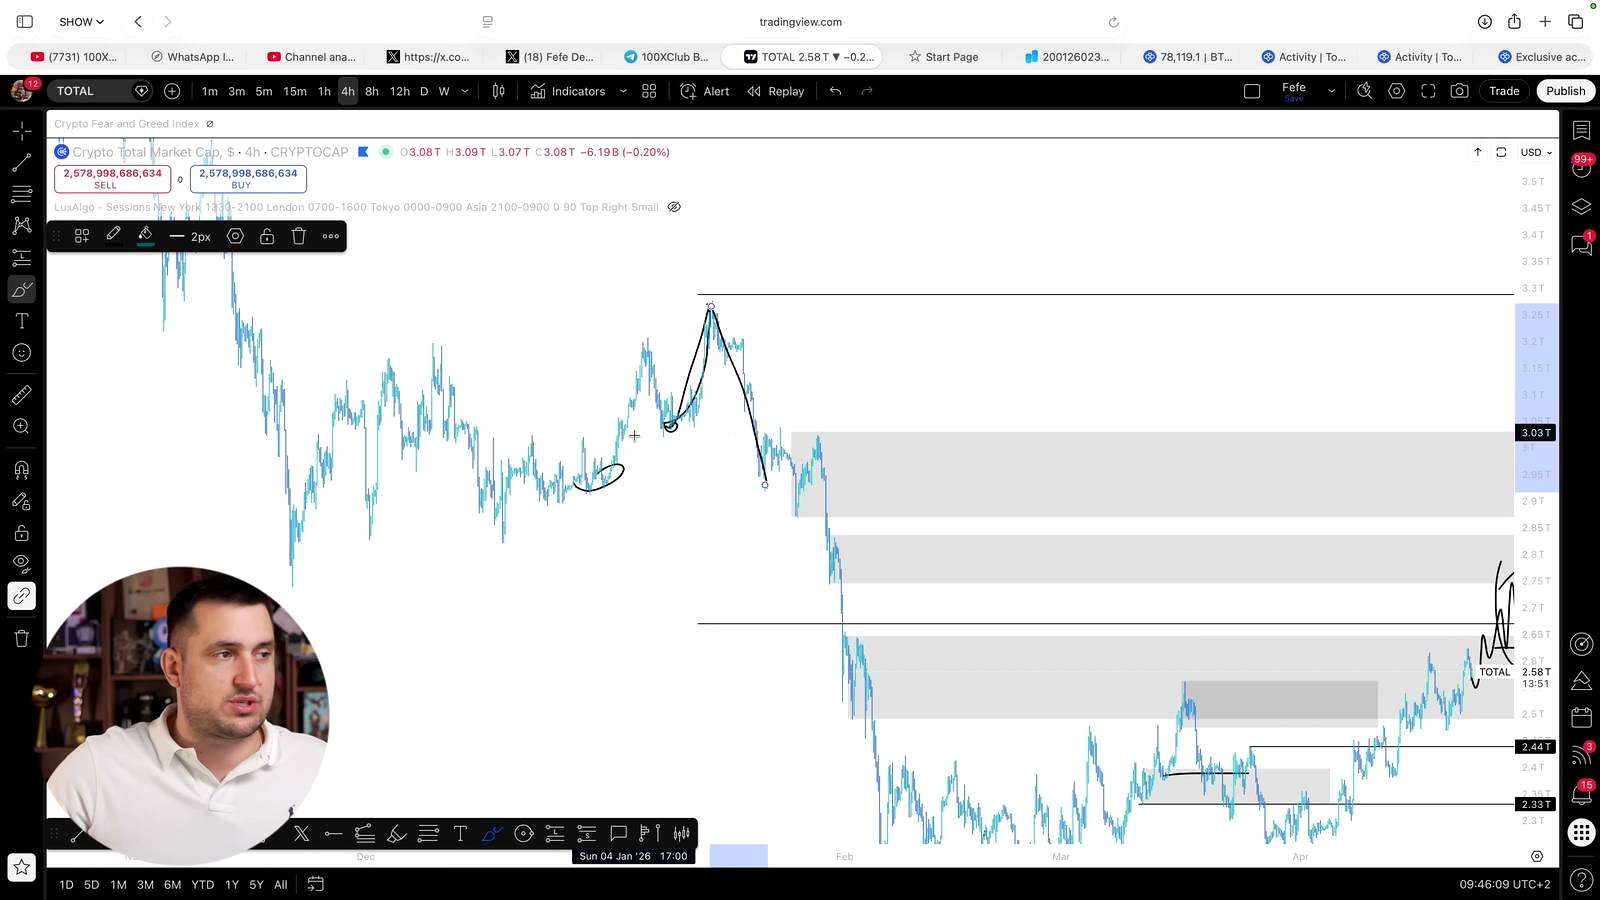
He still maintains the larger bearish thesis. The host said he expects Bitcoin to go “sub 60,000, ” and not just briefly but potentially by a meaningful margin. He also suggested total market cap could stretch as high as around $2.9 trillion to $2.91 trillion before rejecting, though he does not expect a sustained move that closes above $3.29 trillion.
That view is somewhat contrarian in a market that often turns optimistic quickly when Bitcoin reclaims momentum. Broader market sentiment tends to become bullish on headline strength alone, especially when BTC pushes toward prior highs. But traders watching market structure often distinguish between trend continuation and a late-stage rally into resistance. That is the lane 100XClub is operating in: tactical bullishness, strategic bearishness.
How the Trade Setup Works
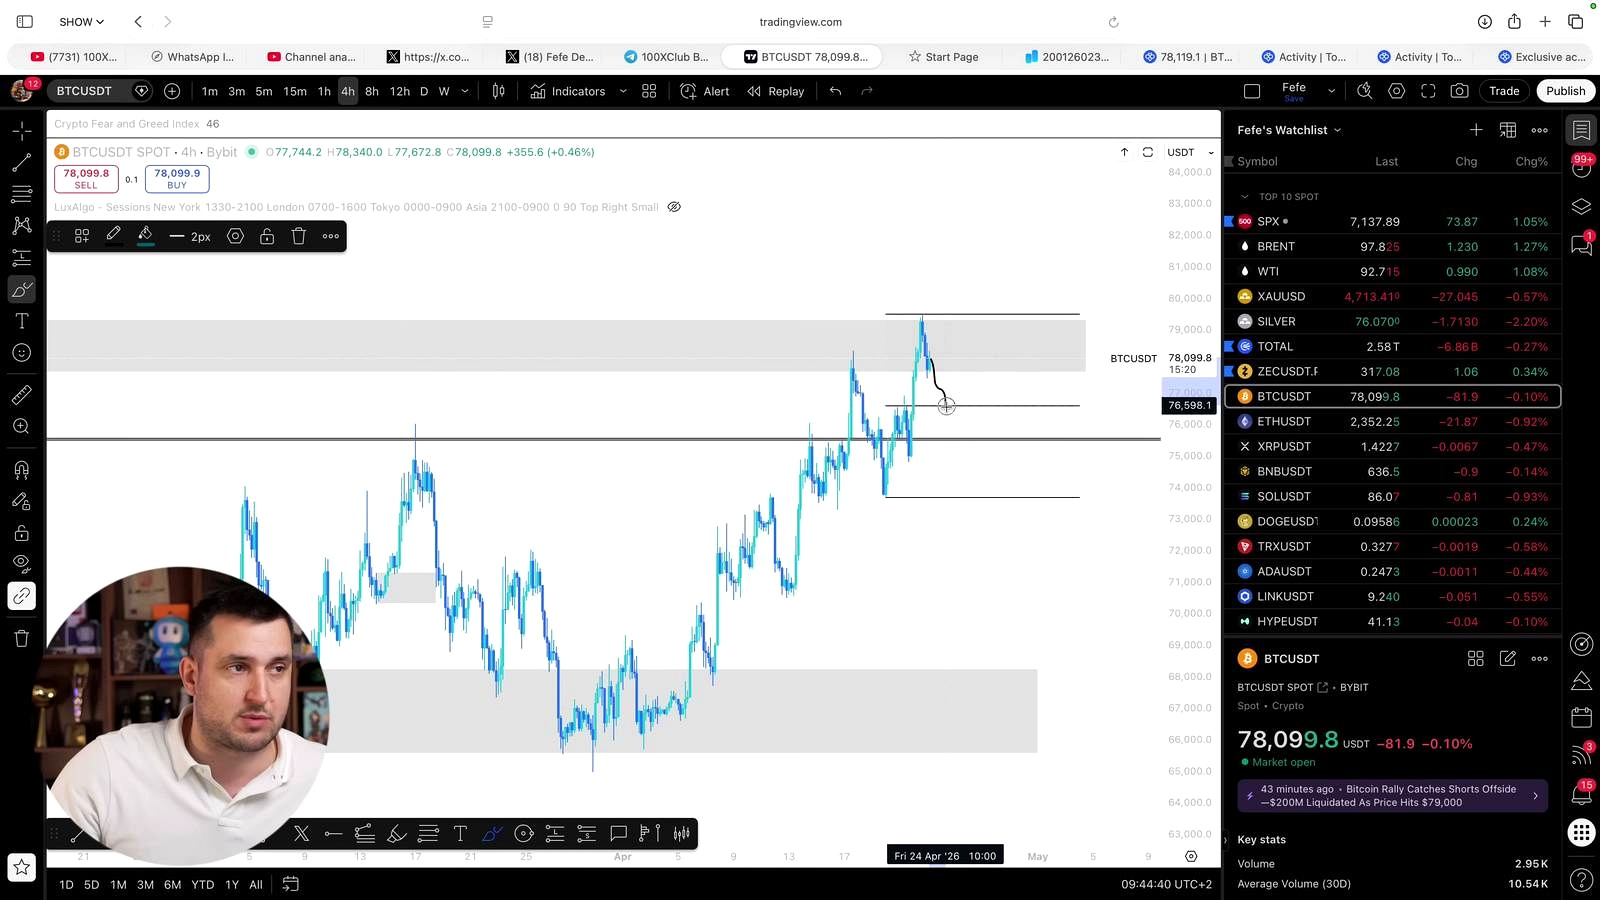
According to 100XClub, the cleaner trade right now is to stop fighting price and trade with the short-term trend until the broader market reaches the key resistance area. He pointed to a possible Bitcoin long near $76,600, provided price returns there and confirms with a 5-minute market structure shift. His first upside target in that setup is at least $79,500.
The logic is straightforward. If the higher-time-frame rejection has not yet arrived on total market cap, then trying to short every intraday weakness is likely to get run over by continuation. The host explicitly said that had been his mistake. He now wants to buy 50% retraces and then wait for a cleaner bearish signal later.
That makes this less a directional all-in call than a sequencing argument. First, the market extends. Then, once total market cap reaches around $2.67 trillion or slightly above, he wants to see an hourly or 4-hour structure break lower into an order block before taking the short. In his framework, the rejection matters more than the level alone. Price can poke higher, but without that confirmation the short is premature.
The broader context matters here. Crypto has repeatedly shown that local Bitcoin weakness can be negated by broader risk appetite, ETF-related inflows, or altcoin strength lifting total market cap. That is one reason many technical traders watch aggregate market cap alongside BTC itself. A single asset can flash weakness earlier than the broader market does, and that divergence can punish traders who jump too soon.
100XClub also tied his caution to macro geopolitics and cross-market behavior. He said he had closed a Bitcoin short that lost about 58% on 10x leverage, or roughly 5.8% unlevered, while an oil long returned 8.5% on 10x leverage, or about 85% leveraged. His point was that oil rising alongside Bitcoin did not “net up, ” and he believes Bitcoin, not oil, is the asset mispricing risk. He added that he expects worsening conditions in the Middle East and said he still prefers the broader pairing of long oil, short Bitcoin.
What Could Go Wrong With This Thesis
The biggest risk to the bearish call is simple: Bitcoin and the broader crypto market may continue to absorb bad news and grind higher anyway. If total market cap pushes through $2.67 trillion without a convincing hourly or 4-hour bearish structure shift, then the setup 100XClub is waiting for has not actually arrived. A market that keeps reclaiming supply zones instead of rejecting them can turn a “final push before collapse” thesis into a costly series of early shorts.
There is also a deeper challenge. Crypto does not always trade as a clean macro-risk proxy. The host’s oil-versus-Bitcoin framing is intuitive, but Bitcoin has at times rallied during geopolitical stress when traders viewed it as a liquidity asset, a high-beta momentum trade, or even a hedge against fiat and sovereign instability. Those narratives can coexist awkwardly, but they can still support price longer than bears expect.
Another issue is that total market cap can be distorted by altcoin behavior. A move to $2.67 trillion or even $2.9 trillion does not guarantee Bitcoin itself is at the precise kind of exhaustion point bears want. If altcoins lead while BTC stays relatively firm, the aggregate signal may be less useful than it appears.
And while 100XClub emphasized structure and retracements, he did not spend much time on demand-side catalysts that could challenge the bearish case. Strong ETF inflows, improving liquidity conditions, easing rate expectations, or a squeeze on under-positioned traders could all keep the market bid. In that environment, sub-$60,000 may still happen later, but the path could be much less direct than the thesis implies.
What to Watch Next
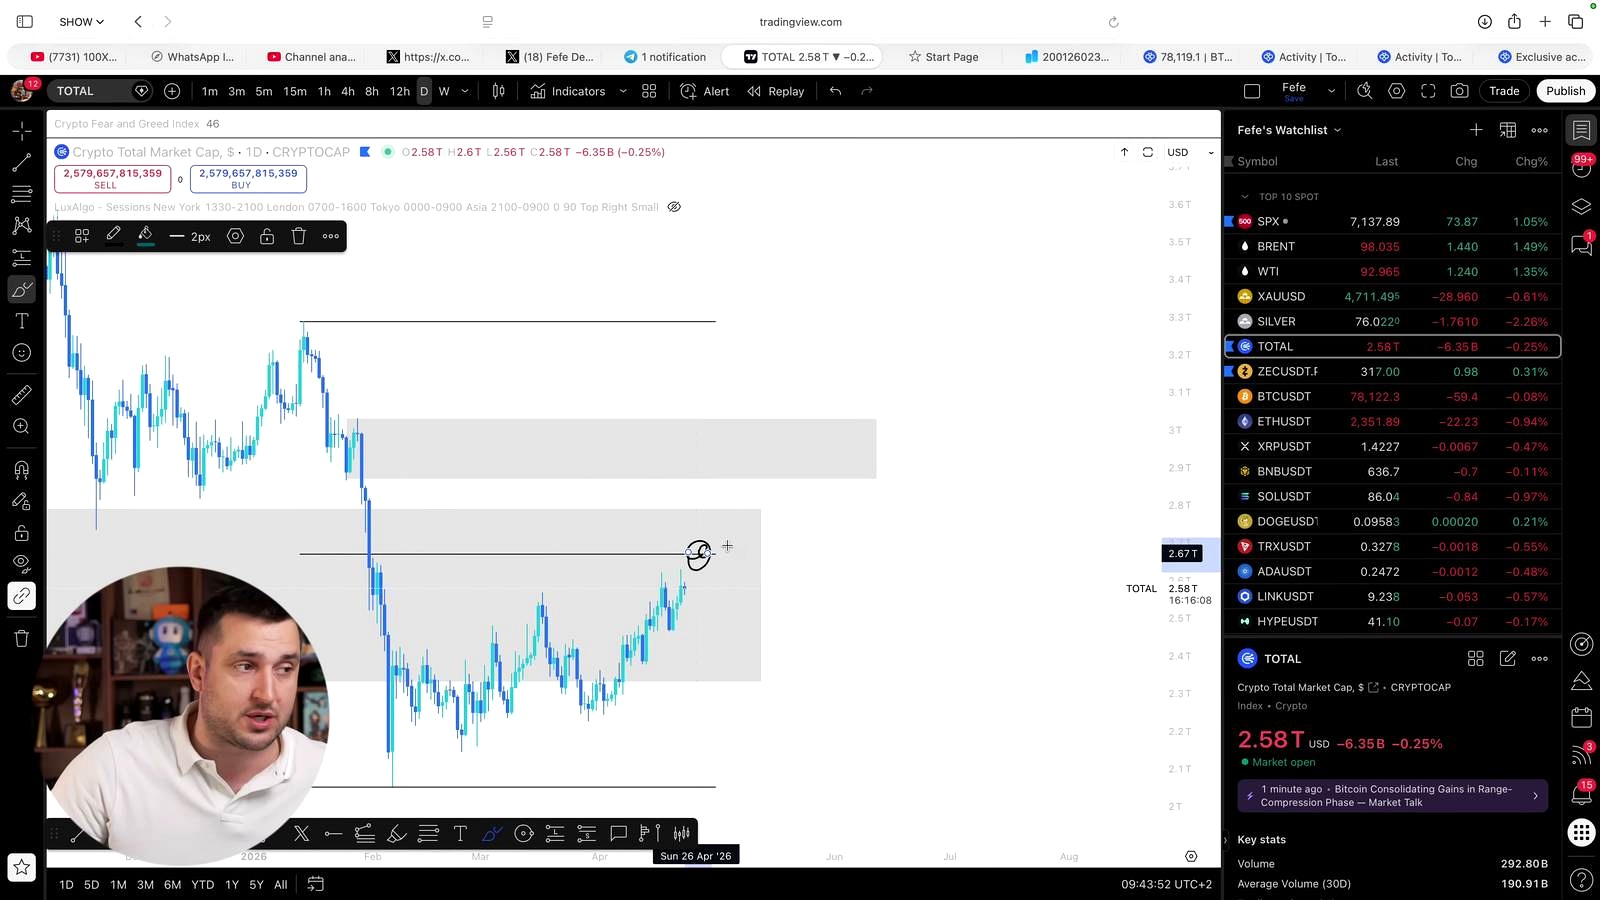
The clearest trigger is the total crypto market cap around $2.67 trillion. If the market reaches that zone and then prints an hourly or 4-hour bearish market structure shift, that would support the analyst’s case that the real short is finally setting up. If price instead keeps pushing higher, traders will likely watch the broader $2.9 trillion to $2.91 trillion area as the next possible rejection zone.
On Bitcoin itself, the near-term level to watch is around $76,600 for a possible retracement long, with $79,500 as the analyst’s stated upside target. Beyond charts, geopolitical developments and energy prices matter here too. If oil continues to rise while Bitcoin also rallies, the cross-market tension the host flagged will remain in focus.
FAQ
What is a market structure shift in crypto trading?
A market structure shift is a technical signal that trend behavior may be changing. In simple terms, traders look for price to stop making higher highs and higher lows in an uptrend, or lower highs and lower lows in a downtrend. On lower time frames, these shifts are often used for entries; on higher time frames, they can suggest a more important reversal.
Why do traders watch total crypto market cap instead of just Bitcoin?
Total market cap gives a broader picture of risk appetite across digital assets. Sometimes Bitcoin looks weak or strong on its own, but the wider market tells a different story. Traders use the aggregate chart to judge whether a move is isolated or part of a larger trend across crypto.
What does a 50% retrace mean?
A 50% retrace refers to price pulling back halfway through a prior move. It is not a formal Fibonacci level with magical properties, but many traders use it as a practical area to look for continuation entries or to assess whether a trend remains intact.
How does a long-oil, short-Bitcoin trade express a macro view?
That pairing assumes geopolitical stress and inflationary pressure will support energy prices while hurting risk assets. If oil climbs because of conflict risk and tighter supply expectations, a trader using this pair is betting that Bitcoin eventually trades more like a speculative asset than a safe haven.
What happened the last time Bitcoin traded near these levels?
When Bitcoin approaches the upper end of a range near prior local highs, price action often becomes more volatile and sensitive to liquidation cascades. Historically, these zones can produce either sharp breakouts driven by momentum and short squeezes or abrupt rejections when buyers fail to push through resistance cleanly.
Content Source

John Burnell focuses on Bitcoin infrastructure, wallet security and blockchain technology. He writes educational articles explaining how Bitcoin works and how the technology evolves.


