Relief rallies can be the hardest moves to read, especially when Bitcoin jumps on geopolitical headlines while other macro markets barely react. The immediate question for traders is whether this push is the start of a broader recovery or the kind of squeeze that sets up the next reversal.
According to Crypto Rover, the latest BTC move higher looks more like a tradable rally into resistance than the start of a durable bottom. His central call is that Bitcoin is building liquidity around $79,000 to $80,000, with a possible extension toward $81,000 to $82,000, before turning lower again. That matters because it frames the current advance not as confirmation of a new bull leg, but as a zone where short sellers may try to fade momentum into overhead supply.
Crypto Rover’s core thesis: relief rally first, real bottom later
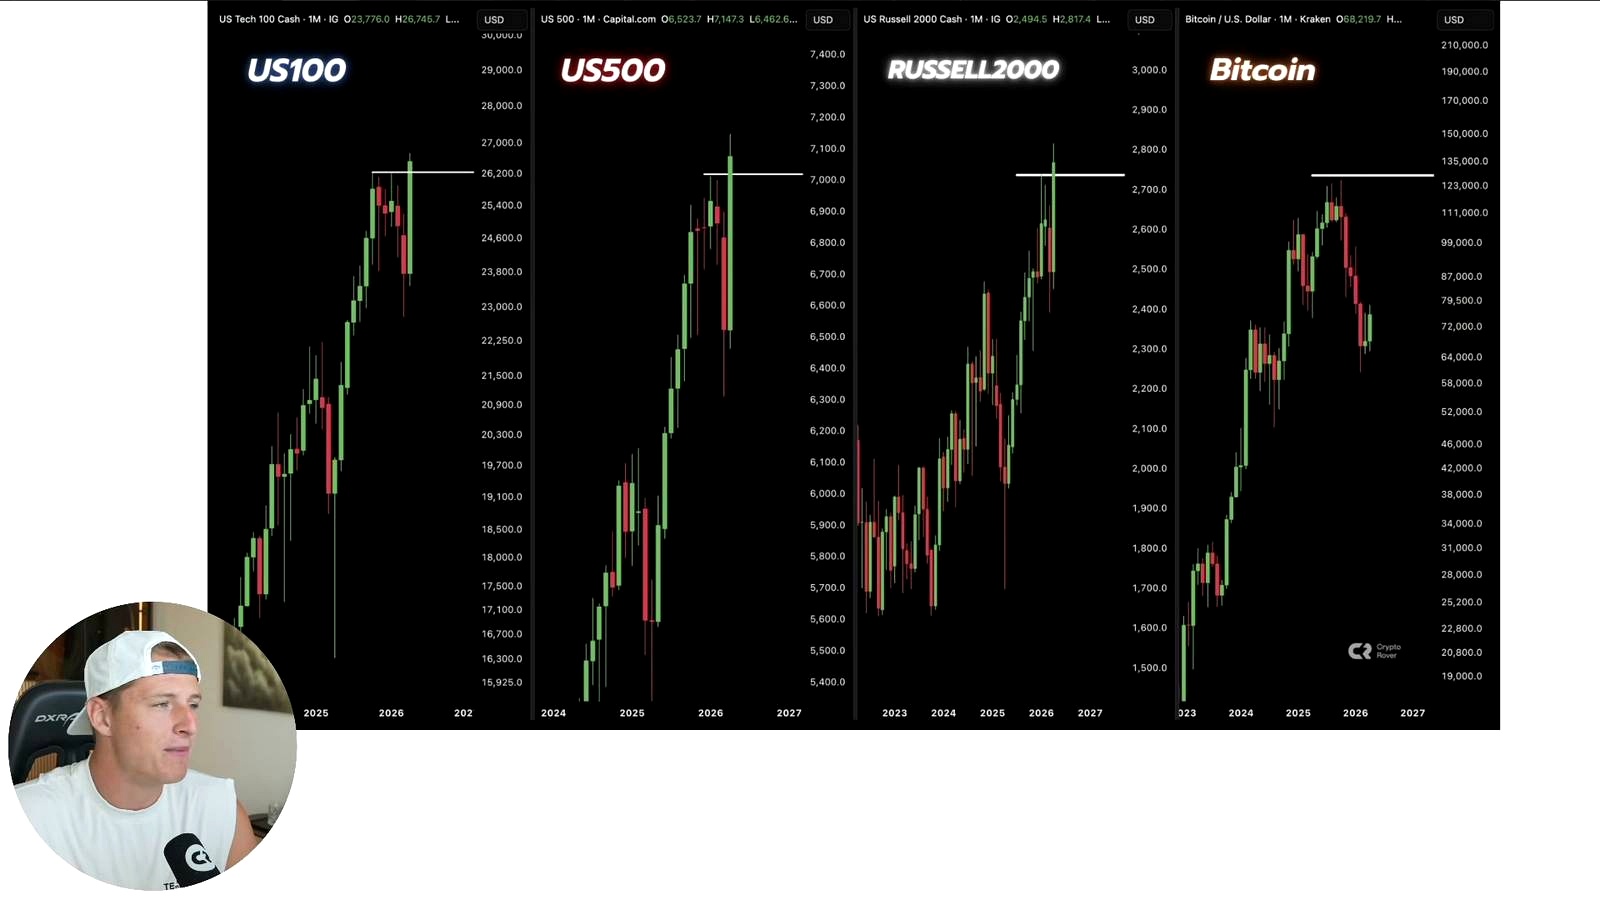
According to Crypto Rover, Bitcoin’s latest pump was catalyzed by a U.S. announcement extending a ceasefire while awaiting an Iranian proposal, a headline he says triggered a bullish reaction in crypto even as the S&P 500 showed little response and oil only saw a modest drop. In his reading, that divergence is important: Bitcoin reacted positively, but it is still lagging traditional risk assets that have already pushed to fresh all-time highs.
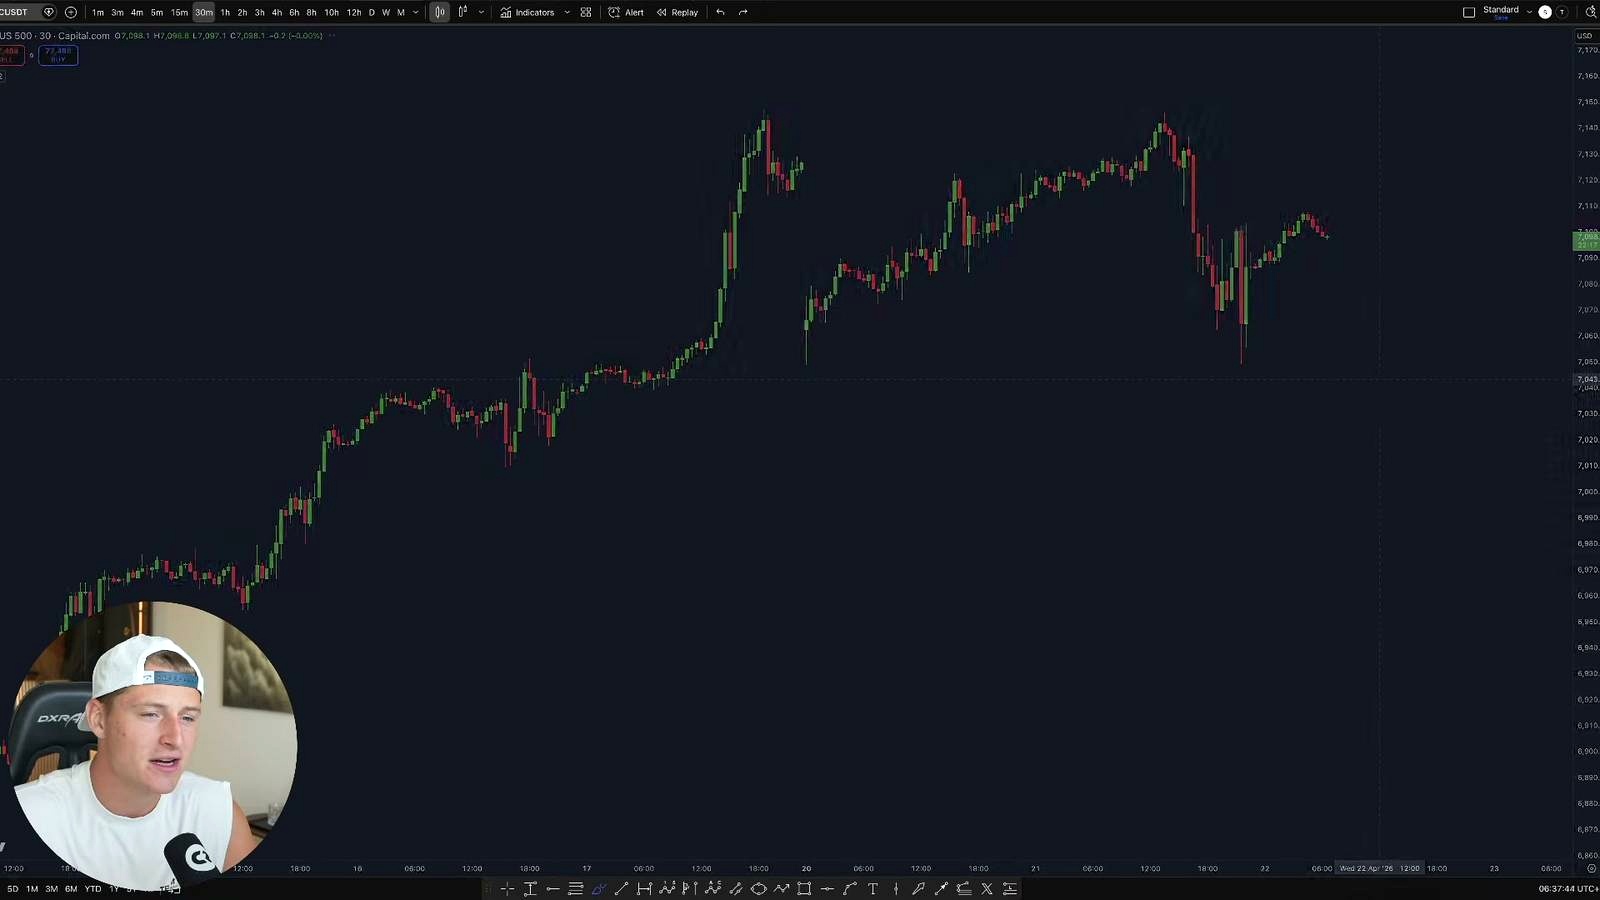
The analyst argues that BTC has broken out of a symmetrical triangle and is now moving toward the liquidity above price, with an initial target around $80,000. More specifically, he highlighted a liquidity cluster from roughly $79,000 to $79,400, and said he is interested in building short exposure from $77,000 up to about $81,000. He also said the upper end of the move could stretch to around $83,000, though he sees $81,000 to $82,000 as the more likely maximum range.
His tactical reasoning leans heavily on derivatives positioning. Earlier in the rally, he said negative funding rates supported the case for upside via a short squeeze. Now that funding has turned positive again, he sees that as a warning sign that traders are becoming too eager on the long side. In that setup, the market can still rise briefly as liquidity above is swept, but the odds of a cleaner continuation become less attractive.
In broader market terms, this sits somewhere between a contrarian and a cyclical-bearish view. A large share of crypto traders tend to treat breakouts and geopolitical de-escalation as reasons to chase strength. By contrast, Rover is arguing that the move may be strongest precisely near the point where it becomes vulnerable. That framework is familiar in Bitcoin: sharp rebounds inside corrective phases often coincide with improving sentiment, rising funding, and a push into visible resistance.
Why the short zone matters around $79K to $82K
According to Crypto Rover, the trade is not simply about fading strength at random. He ties the short thesis to three overlapping factors: visible overhead liquidity, the approach to the EMA ribbon, and a prior support zone that he expects to flip into resistance. In his view, that confluence makes the current area more attractive for tactical shorts than for fresh longs.
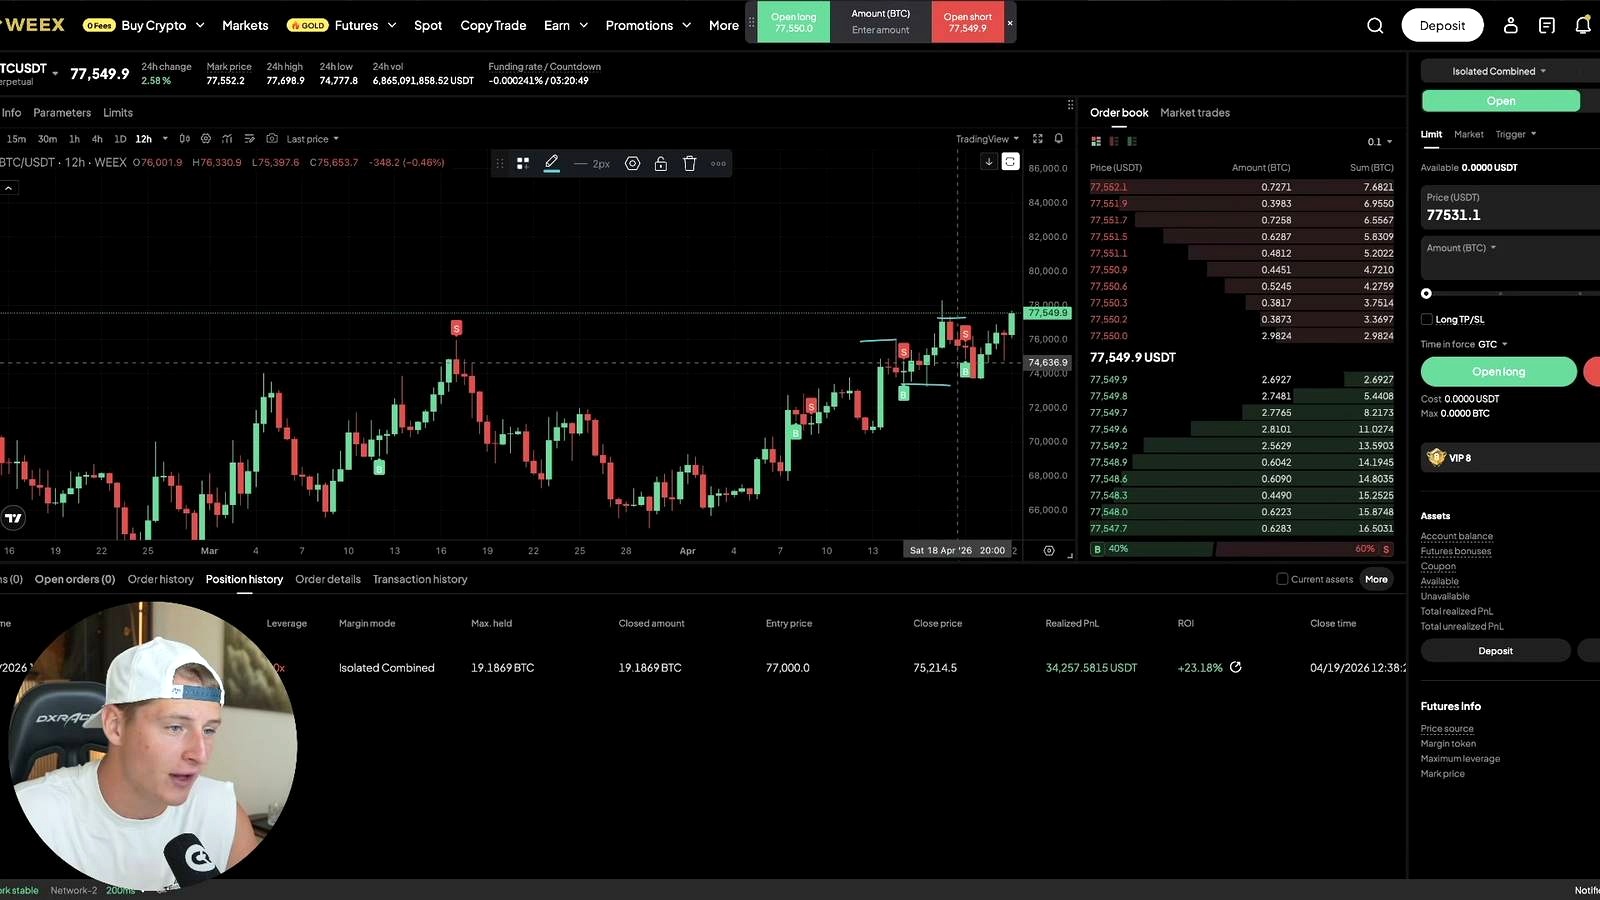
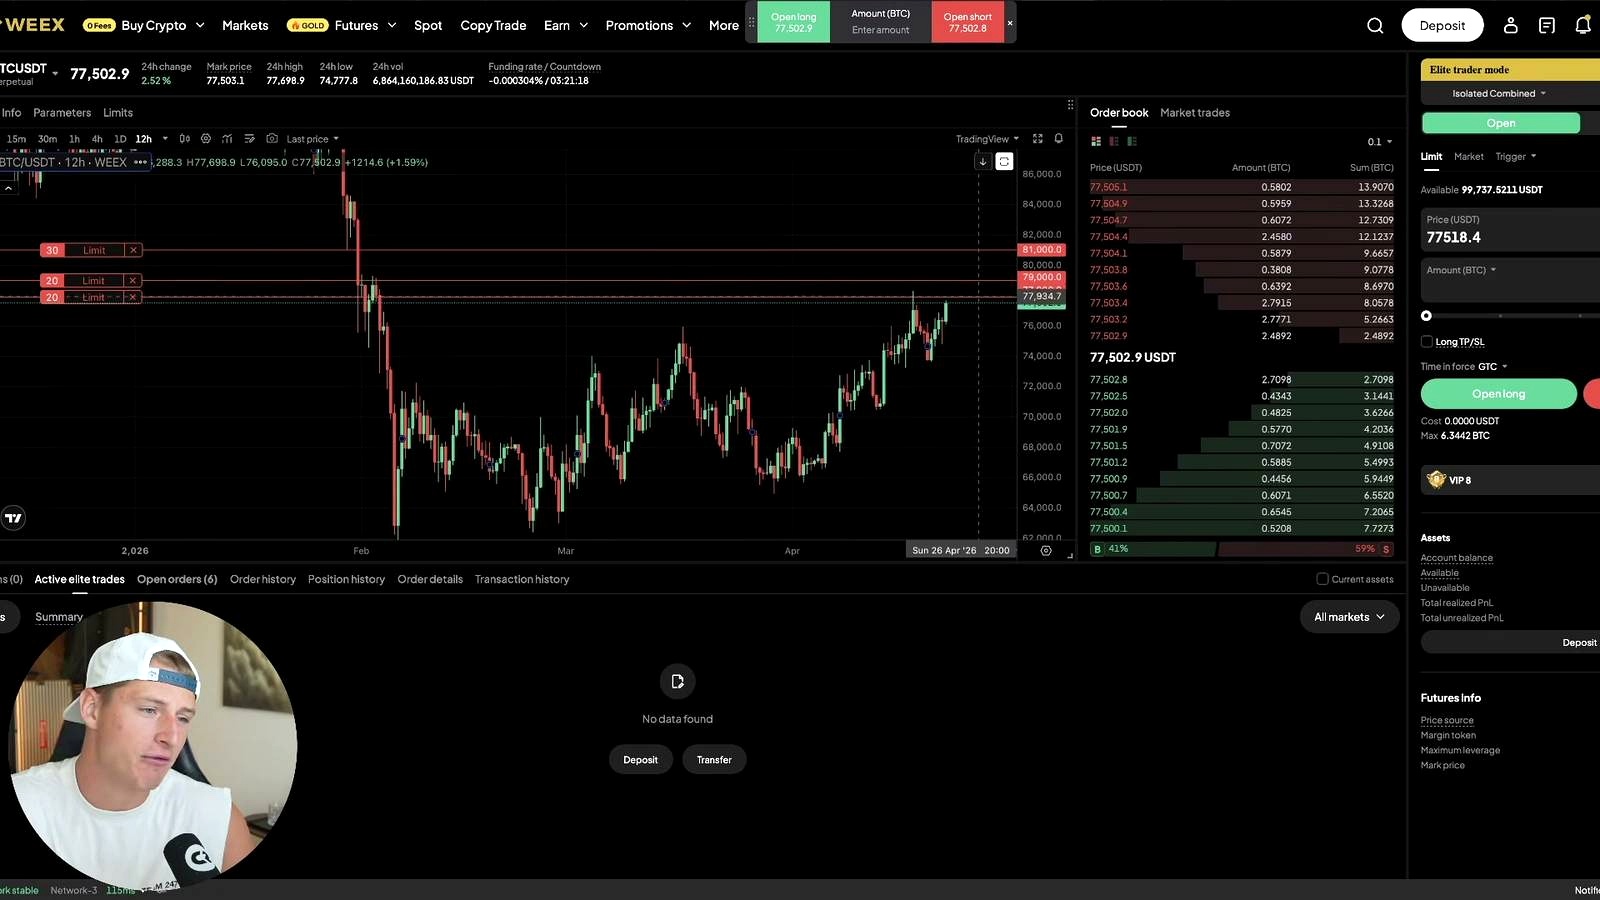
He said he has already traded this region twice, claiming about $60,000 in profit over the last nine days. The first trade, he said, was a short opened at $76,000 and closed near the bottom. The second was a short opened at $77,000 and closed at about $74.8K. He now says he is preparing a new major Bitcoin short position of roughly $8 million, after referencing a title figure of $6 million elsewhere in the video packaging.
The host’s broader roadmap is also unusually specific. He does not think this price structure resembles a classic bear-market bottom. Instead, he expects Bitcoin to rally into resistance, roll over, form a later low, and only then begin the move toward new all-time highs. He said he has been accumulating spot in lower zones already, but would reserve larger leveraged longs for what he sees as the lower side of a likely bottoming range.
He also leans on seasonality. Crypto Rover argues that in prior Bitcoin bear markets, April has often brought relief while May has delivered the larger correction. He explicitly invokes the old market phrase “sell in May and go away, ” saying he expects May to be a bearish month. He adds another historical filter: his claim that at least 50% of supply has typically been in loss before a true bear-market bottom forms, implying he does not yet believe capitulation is deep enough.
That final point is directionally aligned with how many on-chain analysts think about bottoms: major cycle lows tend to involve broad underwater supply, forced selling, and a more obvious stress event. The challenge, however, is that Bitcoin’s market structure has changed over time. ETF demand, institutional balance-sheet activity, and a maturing derivatives market can alter how cleanly older cycle templates map onto current conditions.
What could go wrong with this bearish setup
The biggest risk to Crypto Rover’s thesis is simple: Bitcoin may not reject the $79,000 to $82,000 area at all. Markets often look most fragile just before they break higher. If BTC clears that region cleanly, holds it as support, and funding stays elevated without a violent flush, then the move starts to look less like a local liquidity grab and more like trend continuation.
There is also a macro risk to the short side. If geopolitical tensions continue easing, real yields soften, or equities remain firm, crypto can benefit from a broad risk-on backdrop even if the initial catalyst looked idiosyncratic. Rover notes that Bitcoin is still lagging stock indexes; a bull would argue that lag is actually fuel for catch-up rather than proof of weakness.
Another weakness in the bearish case is the reliance on historical seasonality and prior bear-market analogs. “Sell in May” is memorable, but calendar effects are rarely enough on their own. The market can also front-run expected corrections. If too many traders crowd into the same seasonal short, the trade can become vulnerable to squeeze dynamics, especially in Bitcoin where positioning can flip violently.
Finally, the transcript does not spell out invalidation levels or risk controls for the proposed $8 million short build. That omission matters. A short thesis built around a resistance zone is far stronger when paired with a clear line in the sand above it.
What to watch next
The first trigger is whether Bitcoin decisively sweeps and reacts from the liquidity cluster between $79,000 and $79.4K. After that, traders will be watching the broader resistance band around $81,000 to $82,000, with $83,000 as the outer edge Crypto Rover flagged.
Equally important is derivatives data. If funding rates continue turning more positive while open interest rises into resistance, that would support his fade-the-rally setup. If, instead, price consolidates above those levels and funding normalizes, the bearish thesis weakens. On the calendar, Rover’s framework puts extra emphasis on May as the month where a larger correction would be expected to show up.
FAQ
What are Bitcoin funding rates, and why do traders care?
Funding rates are periodic payments between long and short traders in perpetual futures markets. When funding is positive, longs usually pay shorts, which can signal crowded bullish positioning. When it turns negative, shorts are paying longs, often a sign of bearish crowding that can fuel short squeezes.
What is a liquidity cluster in Bitcoin trading?
A liquidity cluster is an area on the chart where many stop orders, liquidation levels, or resting orders are concentrated. Price often moves toward those zones because they provide enough volume for larger traders to enter or exit positions.
What does it mean when former support flips into resistance?
It means a price zone that previously attracted buyers later becomes an area where sellers step in. This often happens after a breakdown, when traders who bought the old support use a rebound to exit at breakeven.
How is a short trade different from spot accumulation?
A short trade is a directional bet that price will fall, usually using derivatives. Spot accumulation means buying the underlying asset outright and holding it, often with a longer-term horizon and no liquidation risk from leverage.
Has Bitcoin historically corrected in May?
Bitcoin has seen several notable spring pullbacks in past cycles, but seasonality is not a rule. Traders use it as one input alongside trend structure, macro conditions, funding, and on-chain data rather than as a standalone signal.
Video Reference

An Indian crypto journalist covering the developments in the Bitcoin and blockchain industries. Her work helps readers understand key changes in the world of digital assets.


