Risk assets were looking for relief, then geopolitics interrupted the move. With ceasefire expectations fading, the immediate question for crypto traders is whether Bitcoin’s latest drop is the start of a deeper unwind or just another headline-driven shakeout inside a broader uptrend.
Core thesis: a short-term geopolitical dip, not a broken Bitcoin structure
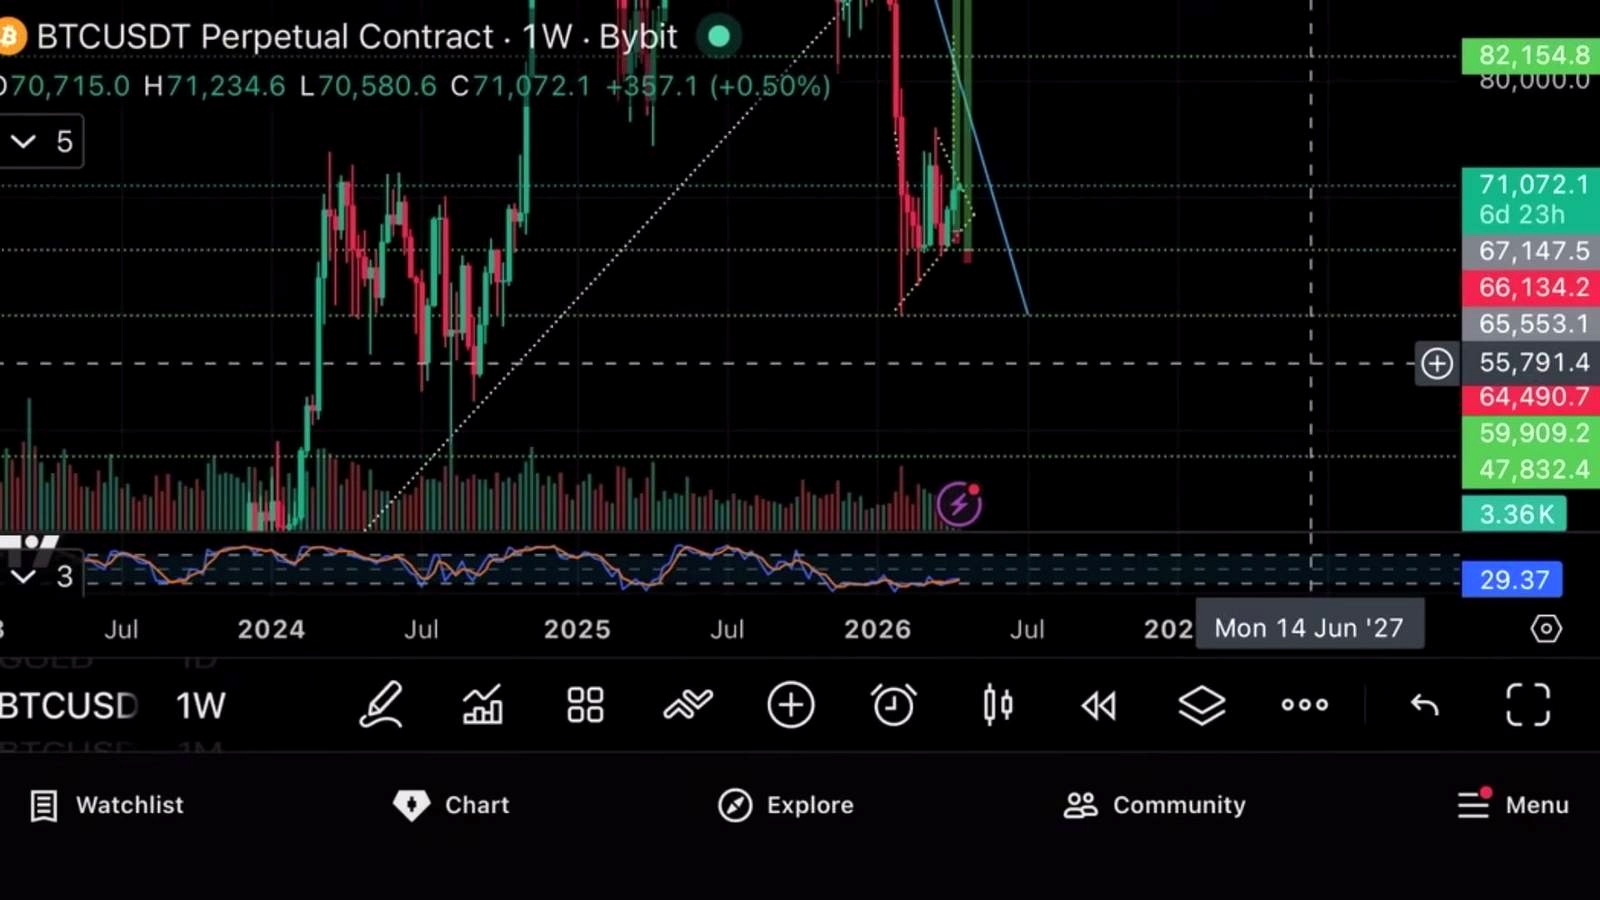
According to James Crypto Guru, Bitcoin and Ethereum sold off after news that there would be no ceasefire deal, but the weakness should remain short-term as markets gradually price in the conflict. In his telling, Bitcoin fell from roughly $73,600 to $70,000, then bounced toward $71,000, while carving out what he described as a double bottom around $70,400.
The analyst’s broader thesis is straightforward: despite the failed breakout and fresh headline pressure, he still sees the larger setup as constructive because Bitcoin is, in his view, oversold on higher time frames. He said Bitcoin is “very oversold” on the monthly and weekly charts and argued the market had broken out of a symmetrical triangle too early. In his framework, a cleaner breakout would have come around April 23 to April 25, or roughly 70% into the pattern.
That view is mildly contrarian in the current market context. Headline-driven selling tends to hit crypto first because it trades continuously and absorbs macro fear before equities reopen. But the idea that geopolitical shocks create temporary dislocations rather than durable trend reversals is not unusual. Historically, Bitcoin often reacts violently to sudden risk-off news, then refocuses on liquidity, rates, ETF flows, and broader positioning once the initial panic subsides.
Still, the “oversold” claim on higher time frames deserves context. In strong bull phases, momentum indicators can reset without price needing to revisit cycle lows. But in fragile markets, oversold readings alone are not enough. Traders usually want confirmation from reclaiming broken resistance, rising spot demand, or liquidation flushes that fully clear leverage. Without that, oversold can stay oversold.
Supporting analysis: the levels, trade setups, and why they matter
According to James Crypto Guru, his preferred Bitcoin strategy is to build into weakness rather than chase a rebound. He said his next Bitcoin buy orders are laddered at $67,000, $65,000, $63,000, $59,000, and $55,000. For Ethereum, he listed laddered orders at $2,000, $1,900, $1,800, and later also $1,700.
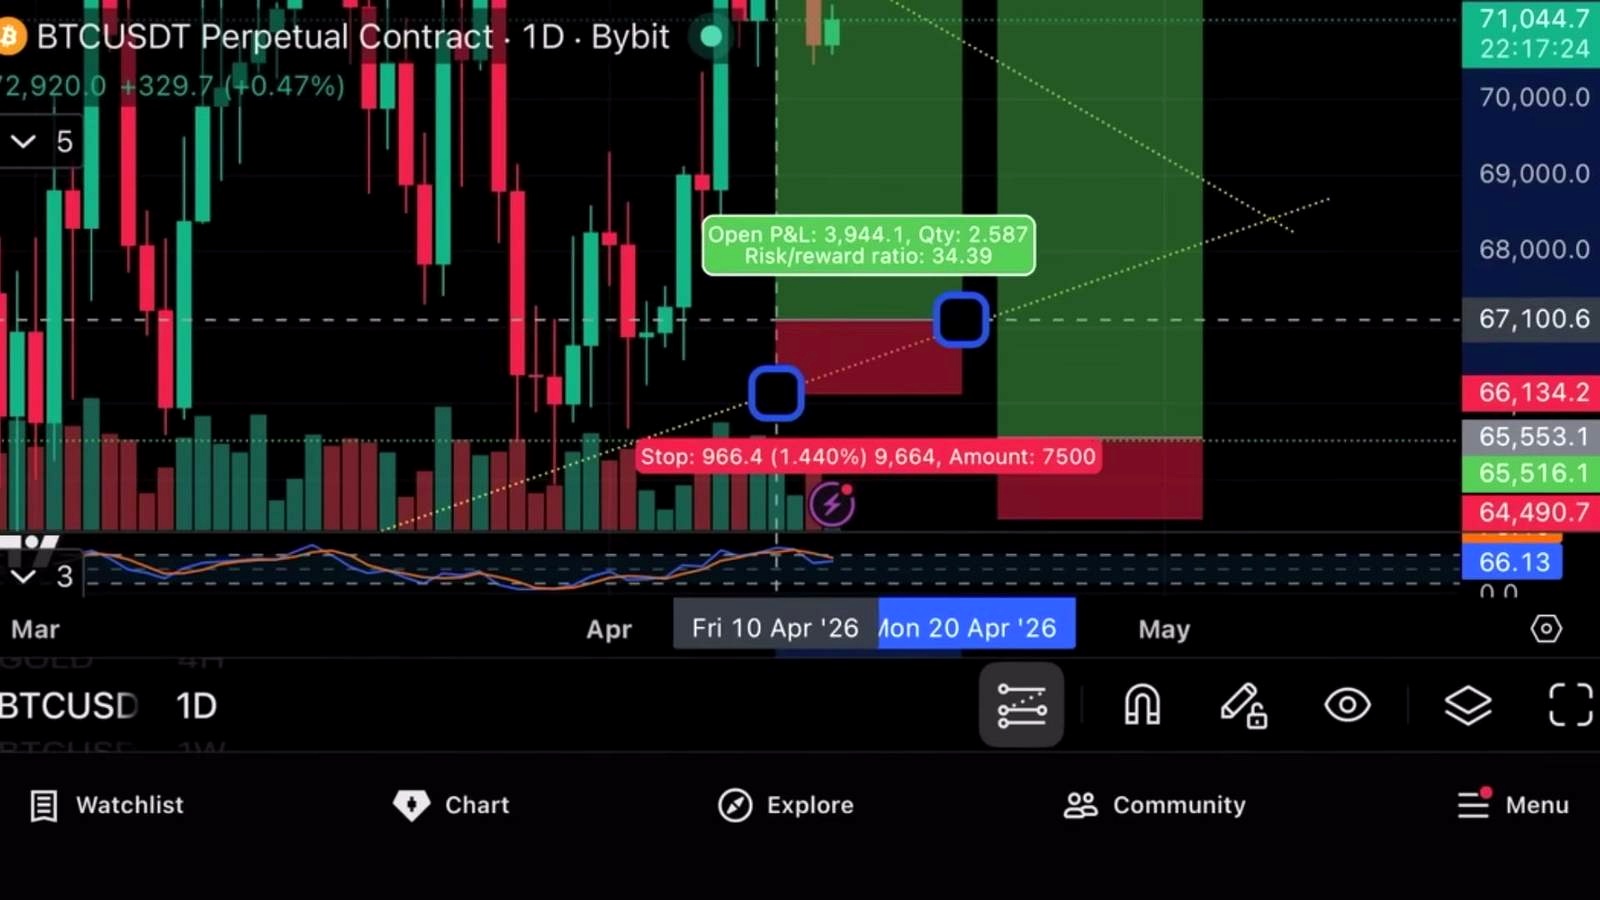
He highlighted two Bitcoin trade setups. The “safer” one, he said, starts around $65,500 with a stop at $64,900 and a target back at $100,000. He framed that as roughly a 32-to-1 risk-reward setup: risking $1,000 to make about $34,000, or $340,000 using 10x leverage. His second, more aggressive setup was around $68,000, later adjusted toward $67,000, again targeting $100,000 with a claimed risk-reward ratio near 31 to 32.
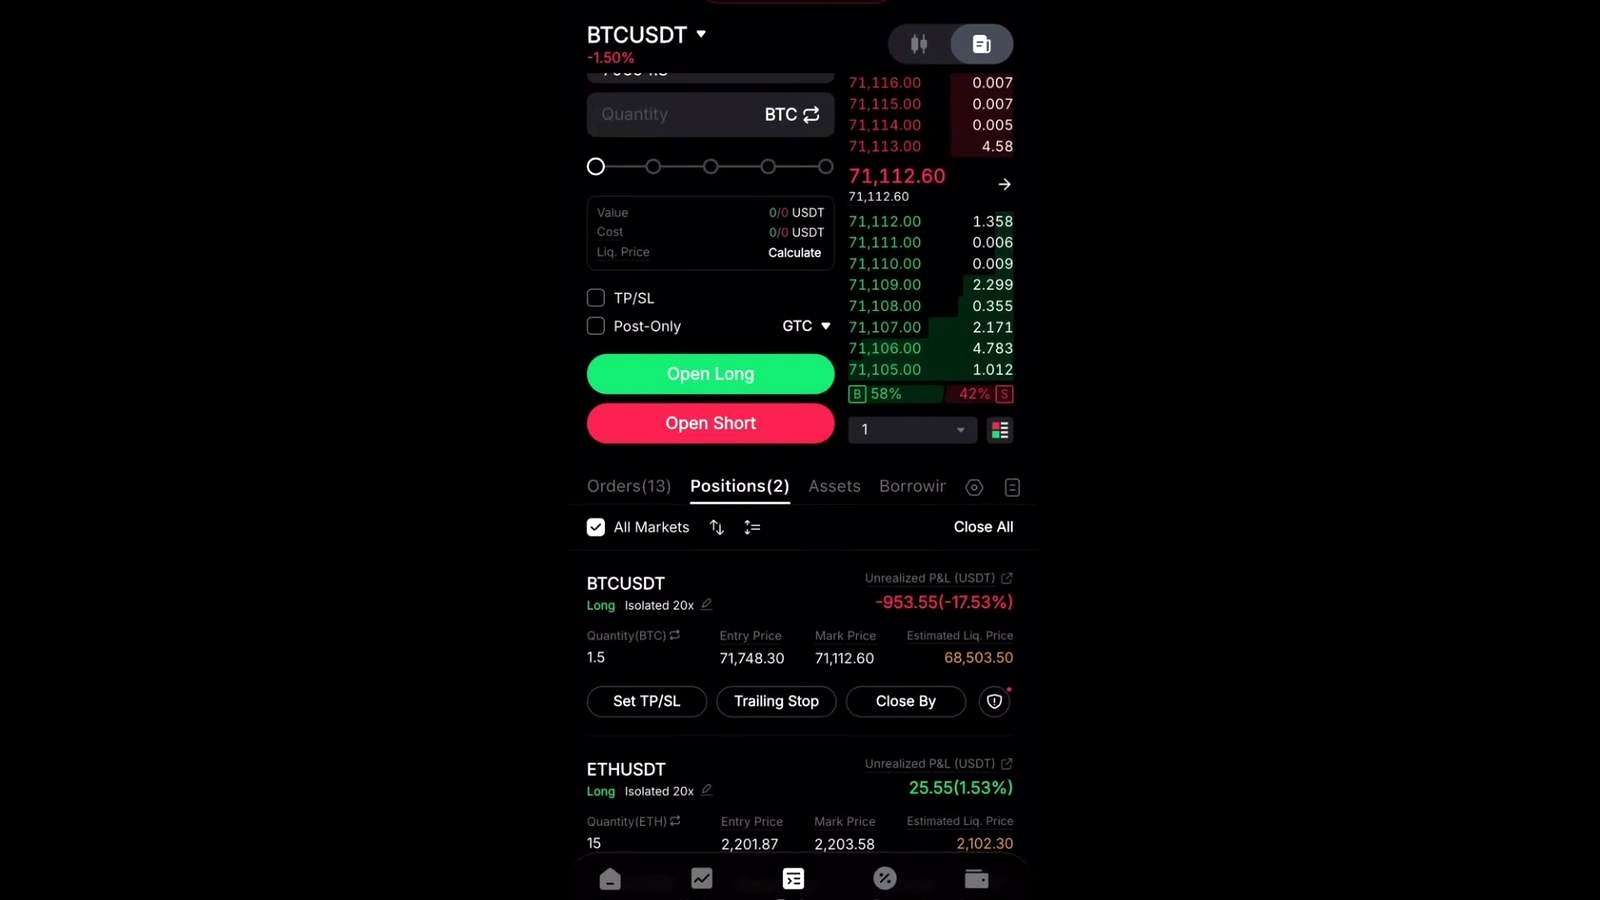
For Ethereum, the host said a trade had already activated at $2,200 with a stop loss at $2,150 and a take-profit at $2,914. He also said a longer-term Ethereum entry around $1,900 looked attractive, while warning that an escalation in the conflict could drag ETH toward $1,700.
The more interesting technical point is his emphasis on Bitcoin moving back inside its symmetrical triangle after a failed breakout. Failed breakouts matter because they often trap late longs and can trigger another leg lower before a real reversal forms. That makes his $59,000 zone especially important. He described it as a weekly support area and a possible bottoming region, though he also acknowledged that the market has not yet completed a double-bottom retest there.
He extended the same risk-off logic to equities, arguing the Nasdaq could give back some of its ceasefire-driven rebound. He cited the index near 22,900, with first support around 18,700, after what he described as a 13% drop from all-time highs followed by a 10% bounce.
What could go wrong
The biggest risk to this thesis is simple: the market may not treat the latest selloff as a temporary geopolitical discount. If macro fear broadens into a sustained risk-off move, crypto’s round-the-clock liquidity can turn it into the first source of cash for deleveraging across portfolios. In that scenario, Bitcoin may not stop neatly at $67,000 or $65,000, and the $59,000 area the analyst identified as support could come under direct pressure.
There is also a technical counterargument. A failed breakout back into a triangle is often bearish until proven otherwise. It can mean the market was not ready for trend continuation and needs a deeper reset. If buyers cannot reclaim the upper portion of the range quickly, what looks like a “buy the dip” setup can become a sequence of lower highs.
The analyst also leaned heavily on oversold readings, but momentum indicators can mislead during structurally weak periods. Bitcoin can stay heavy for longer than traders expect, especially if ETF inflows cool, Treasury yields rise, or equities roll over. Those are obvious cross-market risks he did not really develop.
Then there is the leverage issue. Trade ideas framed around 10x leverage and outsized risk-reward can look compelling on paper, but in volatile headline markets, tight stops are easily swept. A market that eventually reaches $100,000 can still take out highly leveraged longs first.
What to watch next
The near-term trigger is whether Bitcoin can hold the $70,400 area the host described as a double bottom. Below that, traders are likely to focus on the analyst’s laddered zones at $67,000 and $65,000, then the more consequential weekly support near $59,000.
On the upside, the market needs to prove the failed breakout was just noise. A stronger recovery back through the recent $71,000 area and then toward the pre-drop region near $73,600 would help. For Ethereum, the immediate line in the sand is the active trade structure around $2,200 and $2,150. More broadly, traders should watch whether geopolitical headlines remain isolated or spill into a wider equity selloff at the U.S. open, as the analyst expects.
FAQ
What is a symmetrical triangle in Bitcoin trading?
A symmetrical triangle is a chart pattern formed by lower highs and higher lows, creating converging trend lines. It usually signals a market compression phase before a breakout. Traders often wait for a confirmed move outside the pattern with volume, because false breakouts are common.
Why do geopolitical headlines often hit Bitcoin immediately?
Bitcoin trades 24/7, unlike stocks. When unexpected geopolitical news breaks outside regular market hours, crypto often becomes the first liquid market to reflect risk sentiment. That can make Bitcoin look uniquely weak, even when it is simply reacting before other assets reopen.
What does “laddering orders” mean?
Laddering means placing multiple buy or sell orders at different price levels instead of entering a full position at one price. Traders use it to spread entry risk across a range, especially in volatile markets where exact bottoms are hard to call.
How does a failed breakout usually affect BTC price action?
A failed breakout can trap bullish traders who entered on the initial move higher. When price falls back into the previous range or pattern, those positions may unwind, adding selling pressure. That is why failed breakouts often lead to retests of lower support before any durable rebound.
What happened the last time Bitcoin faced a major risk-off macro shock?
In prior episodes of sharp macro stress, Bitcoin often sold off quickly alongside equities, then either stabilized once forced selling passed or continued lower if broader liquidity conditions worsened. The key difference is whether the shock stays event-specific or evolves into a larger tightening in financial conditions.
Content Source

Omar Al-Sharif lives and works in the UAE and is involved in the blockchain technology industry. He writes articles on Bitcoin and digital assets as a personal passion, explaining complex topics in simple and understandable language.


