After a bruising pullback from six figures, the key question for Bitcoin is no longer whether it has corrected, but whether it has corrected enough. According to Traders Helping Traders, BTC is now sitting in a historically important support area that could mark the cycle low, even as the analyst says he still is not long and wants proof before buying.
Bitcoin’s “smart money zone” thesis
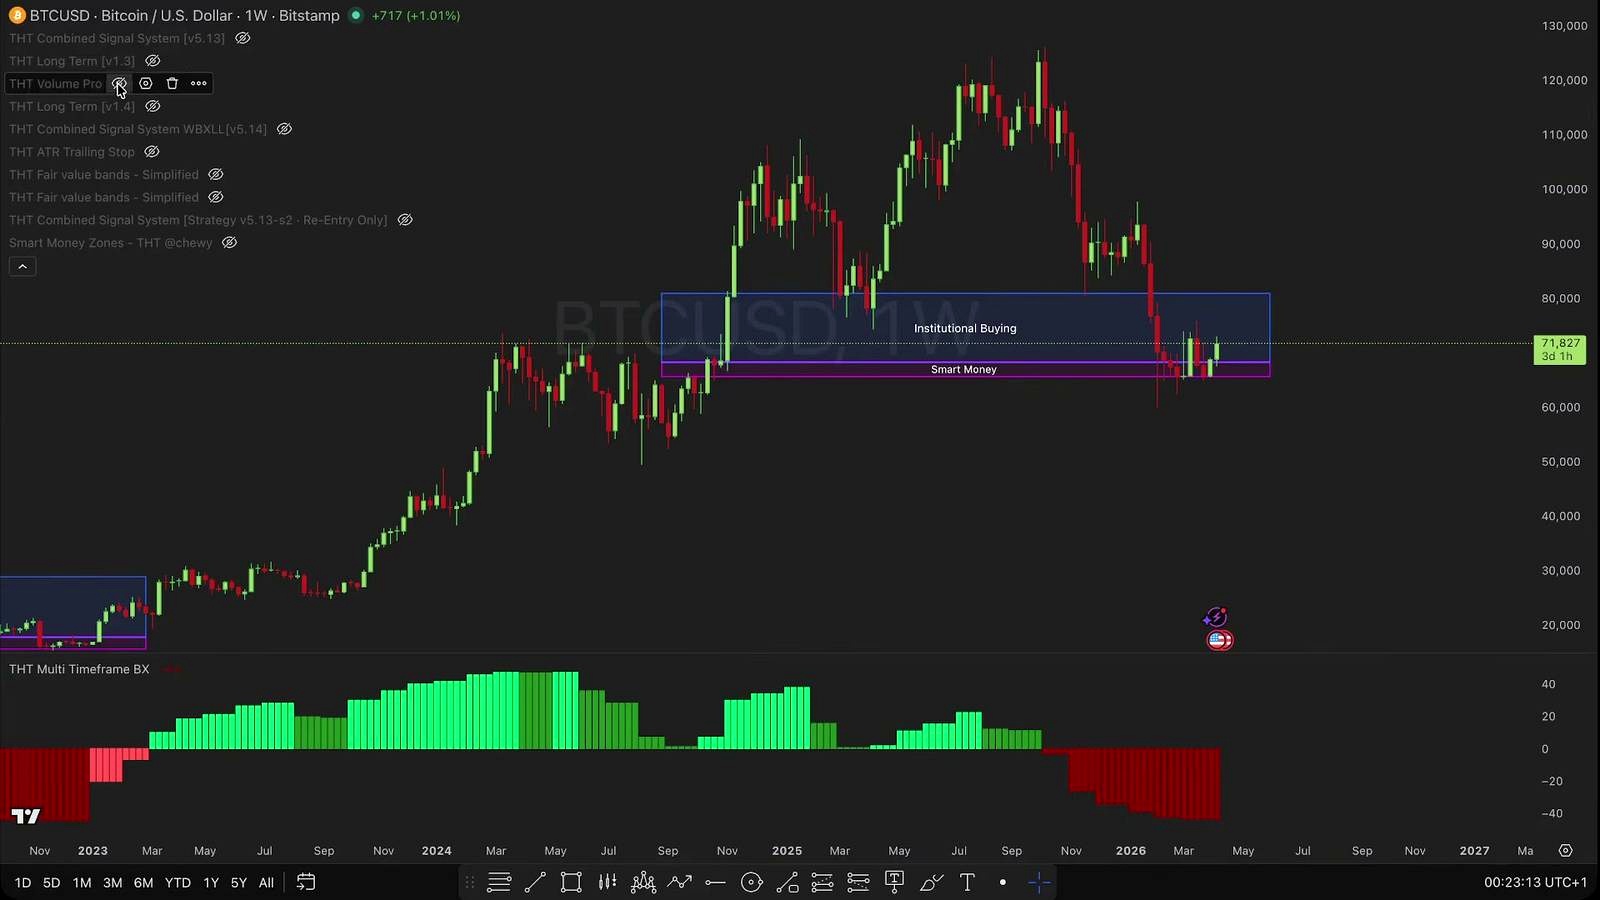
According to Traders Helping Traders, the main setup is straightforward: Bitcoin has dropped roughly 44% since the channel removed its bullish thesis back in November, and price is now trading in what the analyst calls a “smart money zone” between $65,000 and $70,000. Just above that sits what he describes as an institutional buy range from roughly $71,000 to $81,000.
The analyst’s argument is that, despite short-term weakness, Bitcoin’s broader macro structure is still bullish. He frames the current zone using a Fibonacci retracement drawn from the September 2024 swing low to the all-time high, and says similar zones acted as support in prior cycles including 2019, 2020, and 2022. His conclusion: this area has a “pretty good chance” of being the bottom, with roughly a 65% chance that the real low is in or very near.
That view lands somewhere between cautious bullishness and conditional dip-buying. It is not a full-throated call for immediate upside. In fact, the host repeatedly says he is not buying yet because his monthly model remains bearish and the “monthly BX” trend indicator is still dark red. That distinction matters. Broader market sentiment around sharp Bitcoin drawdowns often splits into two camps: traders waiting for trend confirmation, and long-term investors trying to accumulate into fear. Traders Helping Traders is effectively arguing that both camps may find this zone relevant, but only one should be acting aggressively now.
In wider market context, that is a familiar late-correction tension. Deep pullbacks inside broader uptrends are common in Bitcoin, especially after euphoric moves. Historically, support zones tied to prior volume concentration, retracements, and long-term cost basis clusters can produce powerful reflex rallies. But those same zones can fail if macro liquidity tightens, ETF demand cools, or leveraged positioning unwinds too hard. That is why “good support” and “confirmed bottom” are not the same thing.
Why the analyst thinks this area matters
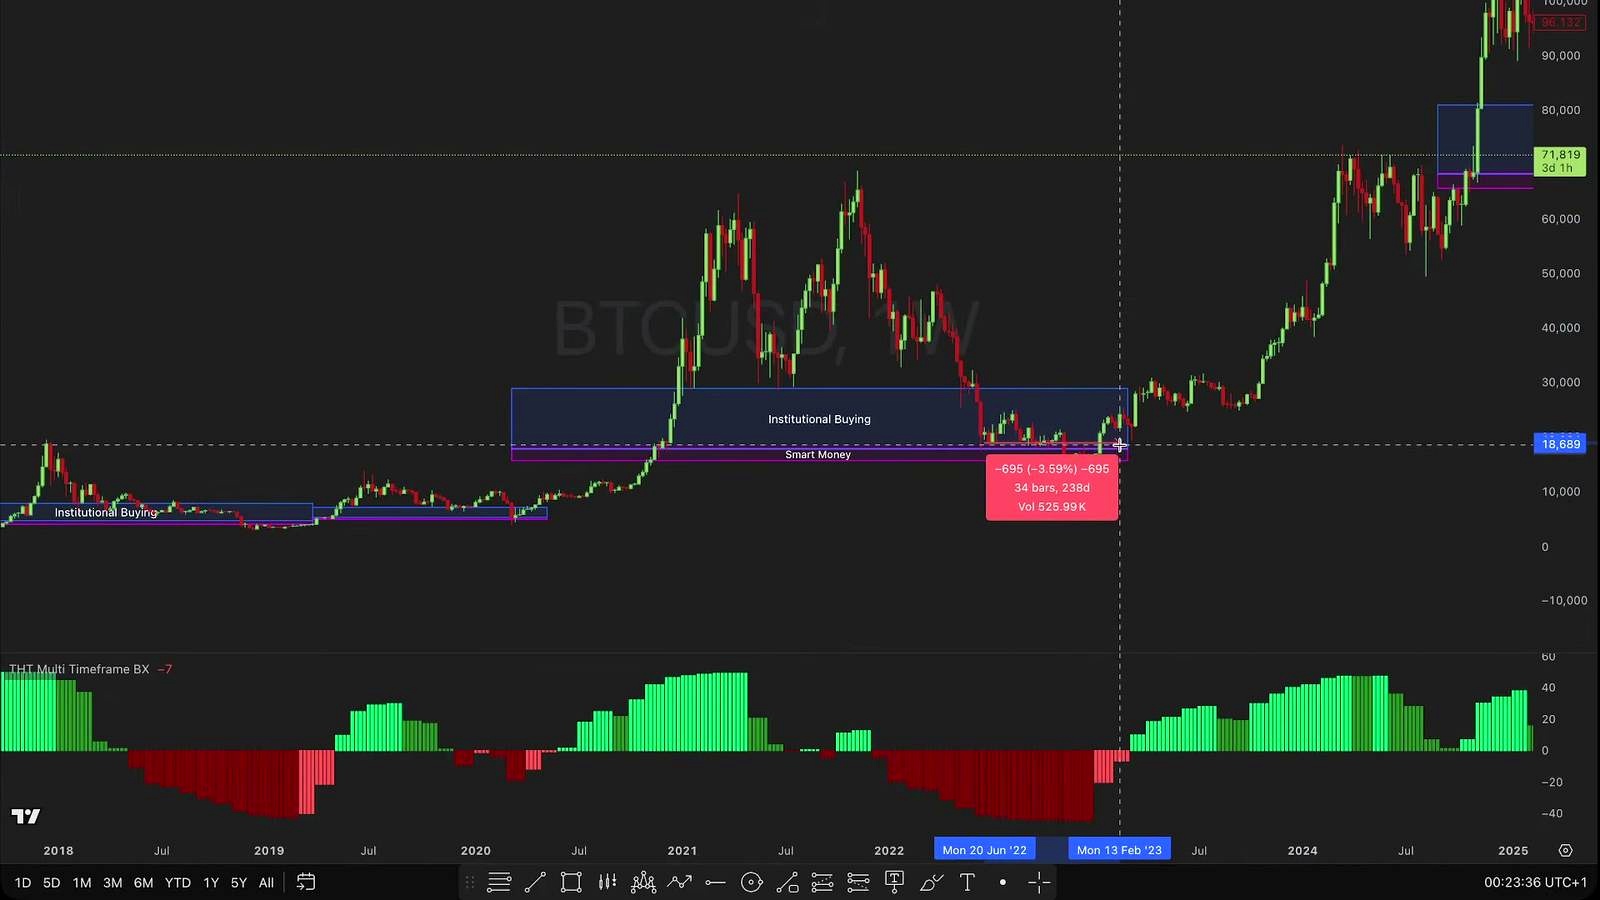
The transcript points to two main reasons the host sees the current range as critical. First is historical behavior. The analyst says Bitcoin has repeatedly found support in comparable smart money zones before entering its next major advance. In one case, he notes it took close to a year for Bitcoin to ultimately stabilize in that area during 2022. That is an important nuance: even if the zone is correct, the market does not have to reverse instantly.
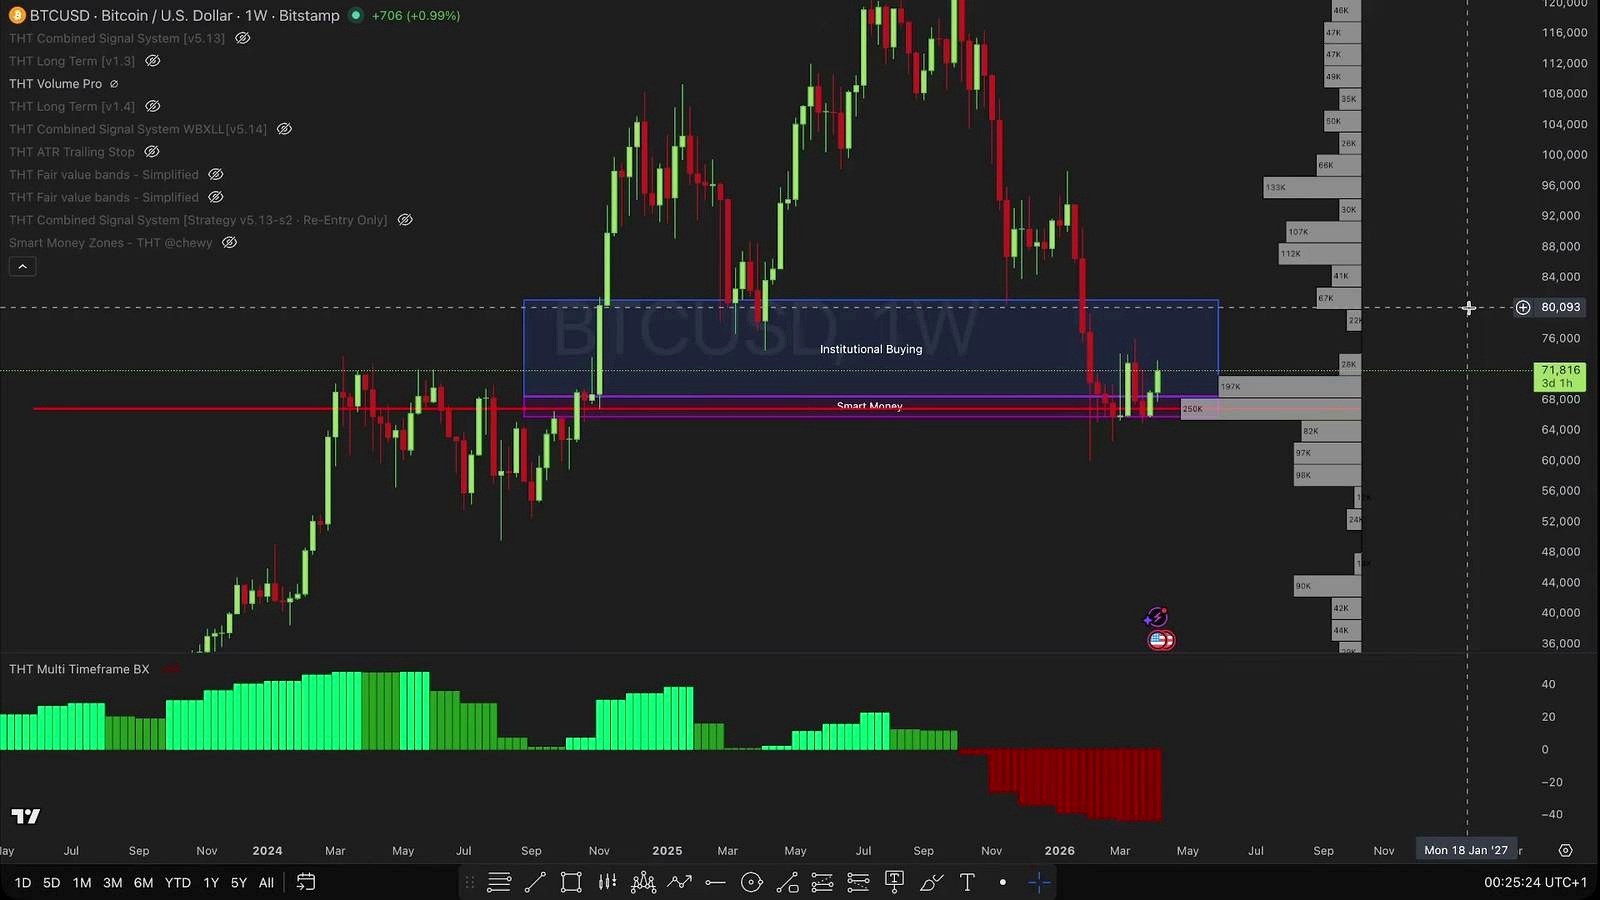
Second is volume profile. Traders Helping Traders says that, over the past 150 weeks, the heaviest concentration of buying and selling has occurred in the $65,000 to $70,000 region. In market structure terms, high-volume nodes often act as magnets during correction phases and as strong support or resistance once price returns there. The analyst also describes this area as a point of control, reinforcing the idea that BTC is not just falling into empty space but revisiting a region where substantial two-way trade previously happened.
There is also a practical trade-management angle. The host says that when Bitcoin was trading around $100,000 in November, his downside target was roughly 35%. That target broadly overlaps with the current test of the smart money zone, which he sees as validation that the drawdown has reached a technically meaningful area. Still, he is explicit that touching support is not enough. He wants long-term model confirmation and a return of buying pressure before entering, even if that means buying as high as $80,000.
That stance reflects a classic momentum trader’s logic: miss the exact bottom, but avoid getting trapped if support breaks. In crypto, where failed support often turns into waterfall selling, that discipline can matter more than precision. The tradeoff is obvious too: waiting for confirmation can leave substantial upside on the table if the market rebounds hard from here.
What could go wrong
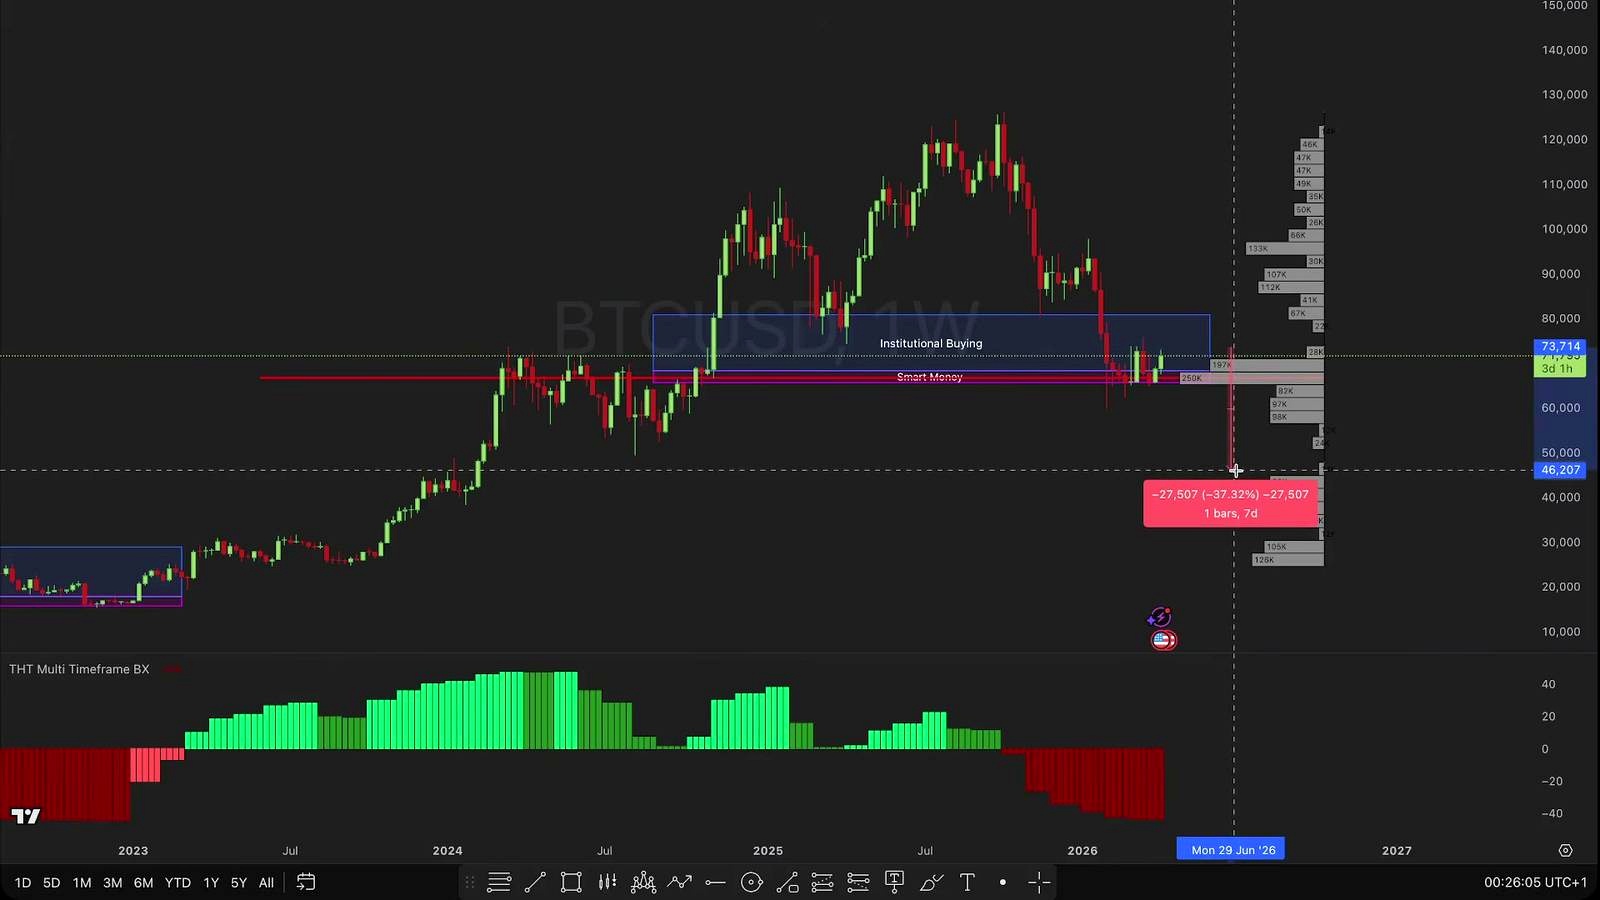
The cleanest way to break this thesis is simple: Bitcoin loses the $65,000 to $70,000 area decisively and fails to attract sustained buying pressure. According to Traders Helping Traders, a break of this support could open the door to a move toward $40,000, with the next institutional level lower at roughly $45,000 to $50,000. He also warns that another 30% to 40% move down is possible in a worst-case scenario.
That downside case is not theoretical. Bitcoin has a history of overshooting “obvious” support during deleveraging events. If macro conditions worsen, real yields rise, risk assets roll over, or crypto-specific flows weaken, technical support can fail quickly. The transcript focuses heavily on chart structure and buying pressure, but it does not discuss other risks that matter in practice: ETF inflow volatility, miner selling, regulatory shocks, and spillover from broader equity-market stress.
There is also a more subtle challenge to the thesis. Even if this zone eventually proves to be the cycle low, price could still spend weeks or months chopping violently around it. That can punish both eager dip buyers and late momentum traders. In other words, “this is the area” does not necessarily mean “the market is ready to trend up now.” The analyst hints at that by referencing the long stabilization period in 2022, but it is worth underscoring. Bottoms are often processes, not candles.
What to watch next
The most immediate trigger is whether Bitcoin can hold the $65,000 to $70,000 band on a sustained basis. If buyers defend that zone and price reclaims the analyst’s institutional range between $71,000 and $81,000, the market would start building a stronger case that this correction was a deep retracement rather than a larger trend break.
Beyond price alone, the analyst is watching for a monthly BX flip and renewed buying pressure before turning long. For the broader market, traders will likely also watch whether spot demand returns on strong volume, whether Bitcoin can reclaim momentum without immediate rejection, and whether any move back toward $80,000 comes with improving breadth across crypto. A failure to hold support shifts focus quickly to the lower $45,000 to $50,000 region.
FAQ
What is a smart money zone in Bitcoin trading?
In technical analysis, a smart money zone usually refers to a price area where larger, more sophisticated market participants are thought to accumulate or defend positions. Traders often identify these zones using retracements, prior support, and heavy volume concentration.
What is a volume profile and why does it matter?
Volume profile shows how much trading took place at specific price levels rather than over time. Areas with very high traded volume often become important support or resistance because many market participants previously bought or sold there.
Why would a trader wait for confirmation instead of buying support?
Because support can fail. Confirmation-based traders prefer to see evidence that buyers are actually stepping in before risking capital. That usually means entering at a worse price than the exact bottom, but with a lower chance of being caught in a deeper breakdown.
How is this setup different from a typical Bitcoin dip-buying call?
This is more conditional than a standard “buy the dip” argument. The analyst says the current area is historically attractive for long-term investors, but he personally is not going long until his system shows renewed buying pressure and a monthly trend shift.
What happened the last times Bitcoin revisited major support zones like this?
Historically, Bitcoin has often formed major cycle lows near high-volume support or deep retracement zones, including periods cited in 2019, 2020, and 2022. But those lows were not always immediate. Some took extended consolidation before the next sustained uptrend began.
Source Video

John Burnell focuses on Bitcoin infrastructure, wallet security and blockchain technology. He writes educational articles explaining how Bitcoin works and how the technology evolves.


