Markets are trying to price two conflicting forces at once: geopolitical risk that has pressured crypto, and a rebound in risk assets that suggests panic may be fading. The immediate question for Bitcoin traders is whether this is the start of a durable recovery or just another bounce inside a broader correction.
According to James Crypto Guru, Bitcoin may be approaching a cycle low, with his four-year framework and momentum indicators suggesting the market is in a late-stage bottoming process rather than the start of a new bear leg. That matters because his setup combines a bullish long-term thesis with a short-term expectation for more chop first.
James Crypto Guru’s core thesis: Bitcoin is in a bottoming window, not a fresh collapse
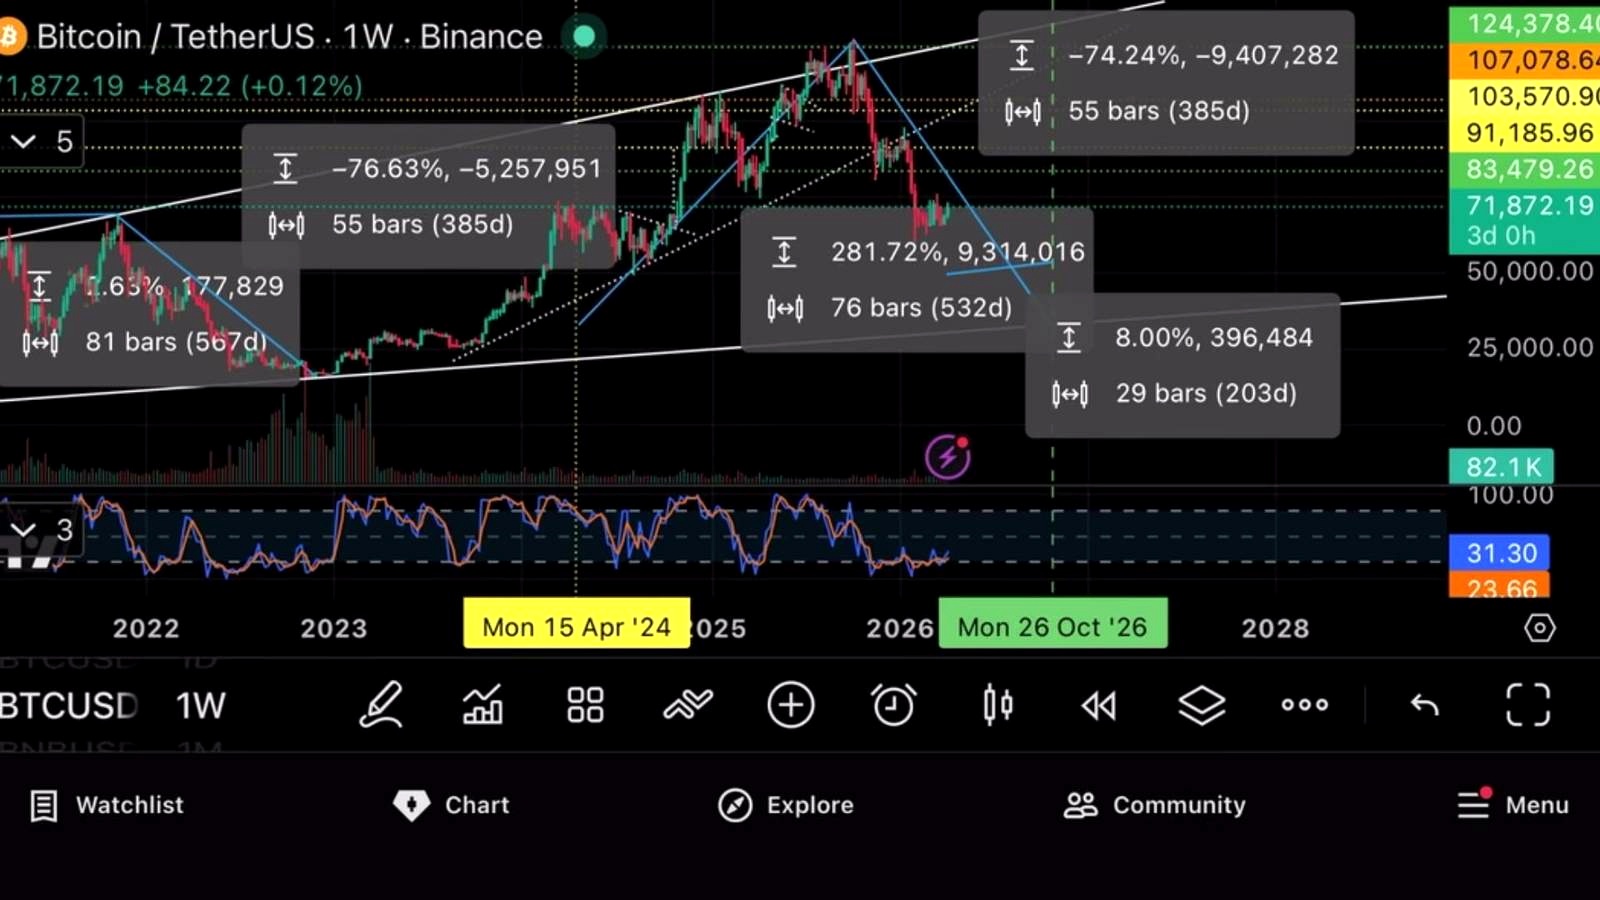
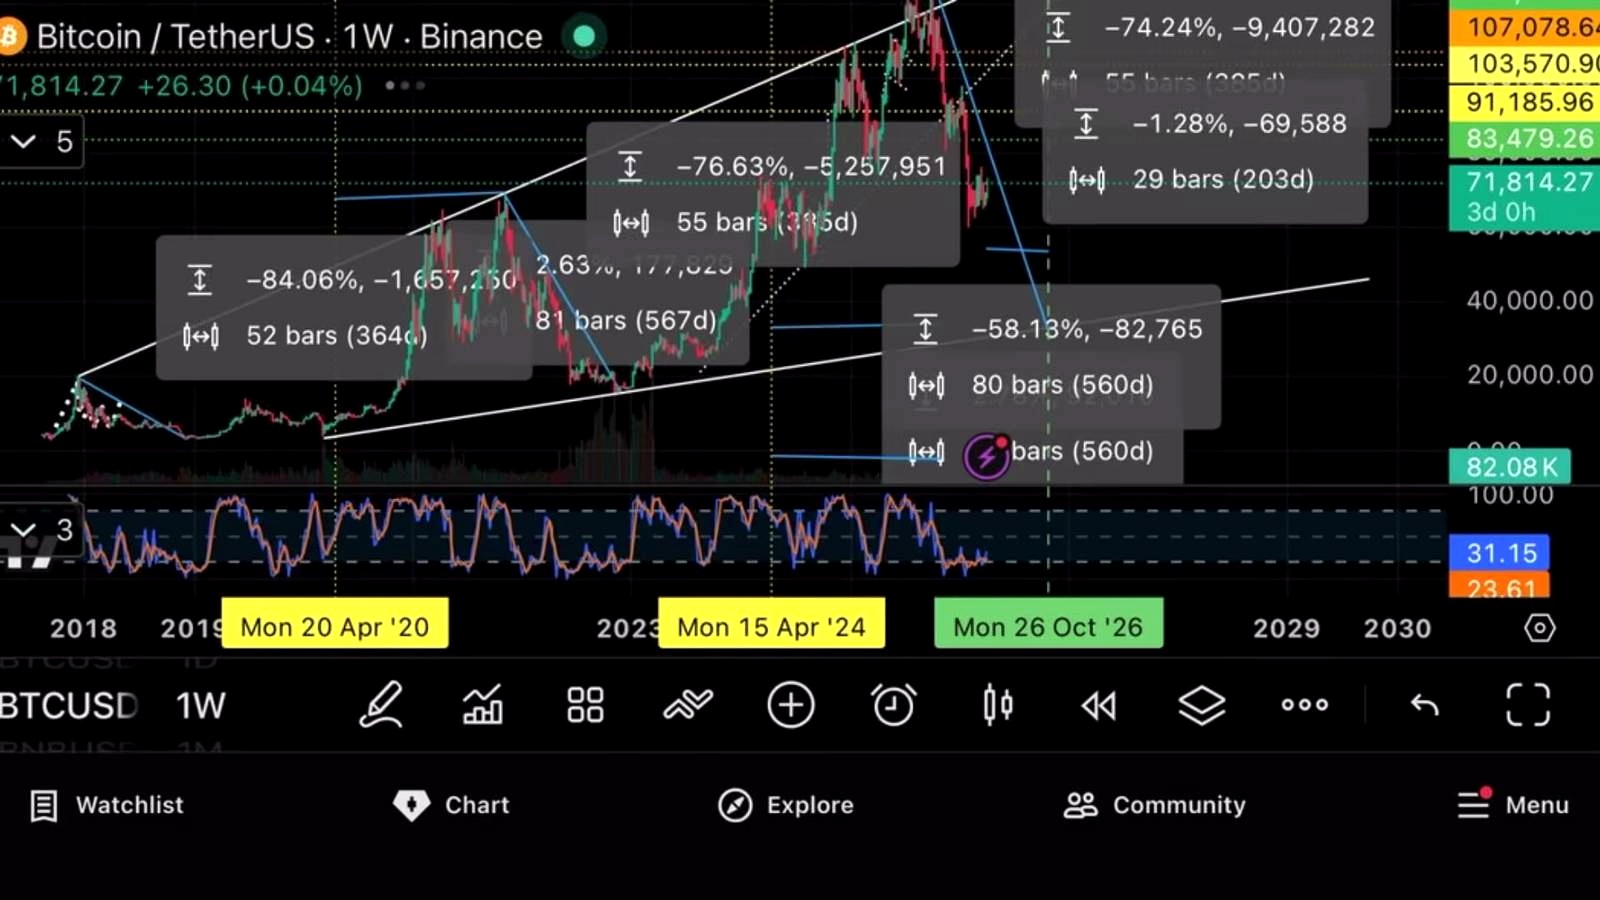
According to James Crypto Guru, the most important part of the current Bitcoin setup is the interaction between the halving cycle and oversold momentum readings. He argues that prior cycles took roughly 560 days from halving to top, and then roughly 364 to 385 days from top to bottom. In the current cycle, he says Bitcoin took about 532 days to reach its top, and based on that same framework, the market may still have roughly 200 days left to reach a final low, or as little as 70 days if the bottom arrives earlier than the historical average.
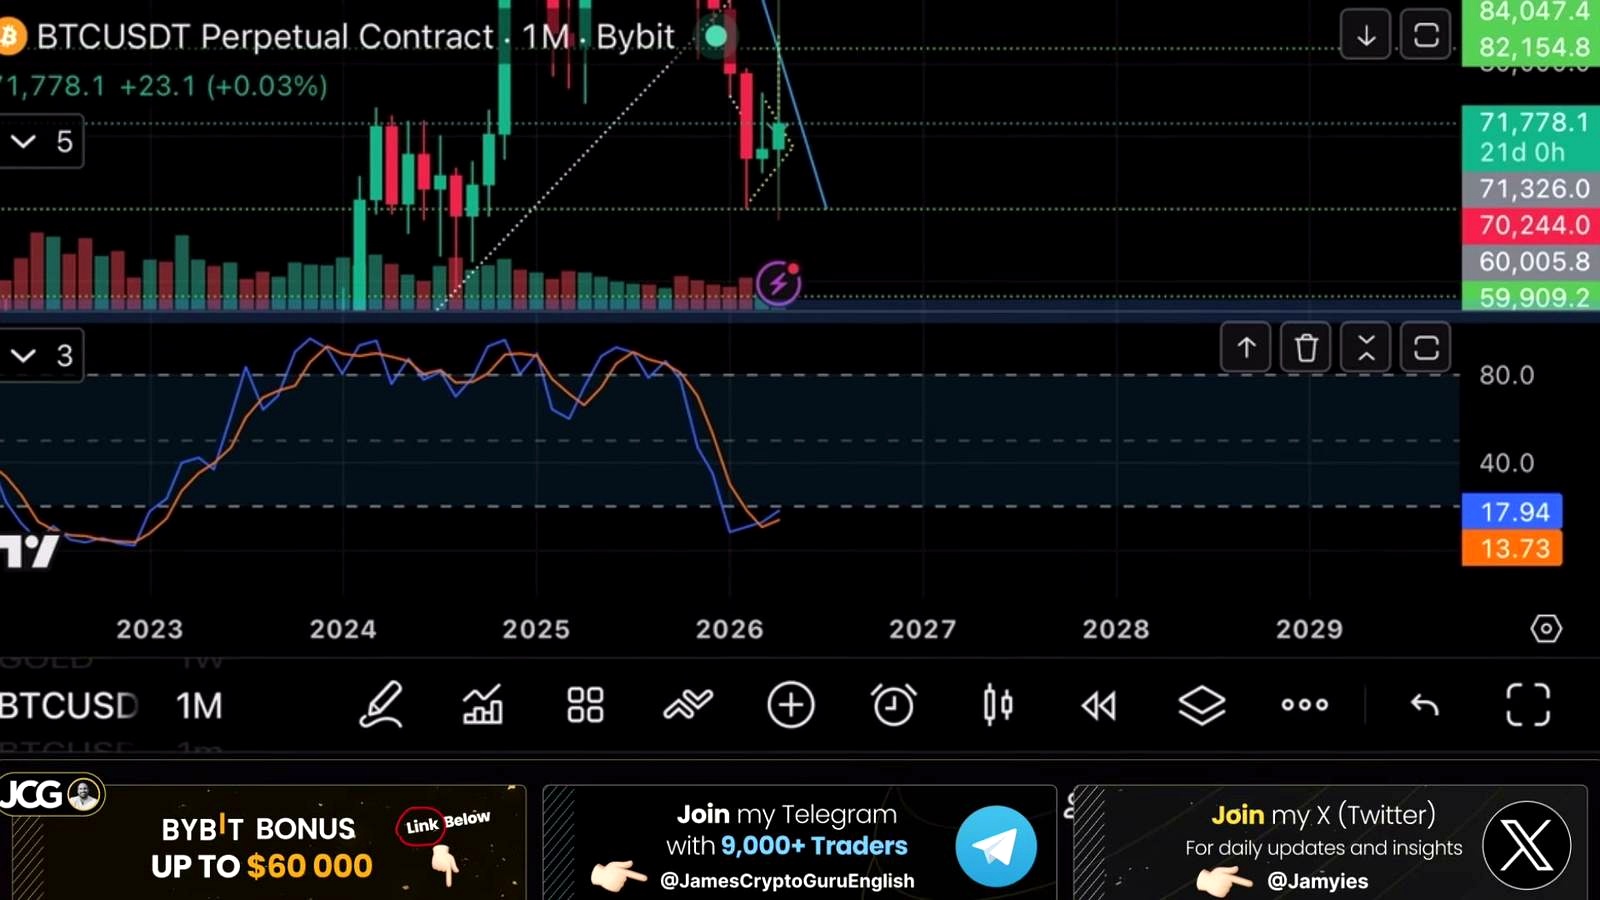
He ties that cycle view to technicals. The analyst says Bitcoin is already oversold on both the weekly and monthly stochastic, which he describes as his main indicator. He also notes that Bitcoin recently pushed toward $73,000 before pulling back and forming what he called a triple top, while still holding in a broader compression pattern.
That thesis is moderately contrarian in the current market context. Many traders tend to view a monthly oversold signal as a sign of deeper structural weakness, especially when macro uncertainty is elevated. But others see it as exactly the kind of condition that forms medium-term bottoms. Historically, Bitcoin has often turned higher when weekly momentum gets washed out, though monthly signals can stay depressed longer than bulls expect. The broader context also matters: if equities continue stabilizing and liquidity conditions improve, crypto tends to respond positively. If war-related headline risk intensifies, technical oversold readings can fail for longer than models imply.
Trade setups, key levels and why the analyst is scaling in
James Crypto Guru is not calling for an immediate straight-line rally. In fact, he says the chart may be breaking out too early. On his reading of a symmetrical triangle, the more typical breakout point would come around 70% of the pattern’s length, which he places near April 24, 2026 in the transcript, though that appears to be a verbal inconsistency given the surrounding discussion. His practical takeaway is clearer than the date: he expects a possible rejection first, then a cleaner breakout later.
That is why he says he has opened only a small Bitcoin trade and is laddering bids lower. He says his active Bitcoin trade opened at $71,300 with a hypothetical tight stop at $70,200, though he also says he personally prefers building positions over using stop losses. He listed buy orders down at $69,675, then around $69,000, $67,000, $65,000, $63,000, $59,000 and $55,000. He also points to first support around $69,400.
On upside targets, the analyst says an early breakout trade could aim for $100,000. He frames one setup as risking $1,000 to make $12,000 per Bitcoin without leverage, and another as a 26-to-1 or even 33-to-1 risk-reward profile depending on the entry zone. Those numbers reflect his preference for buying into weakness rather than chasing confirmation.
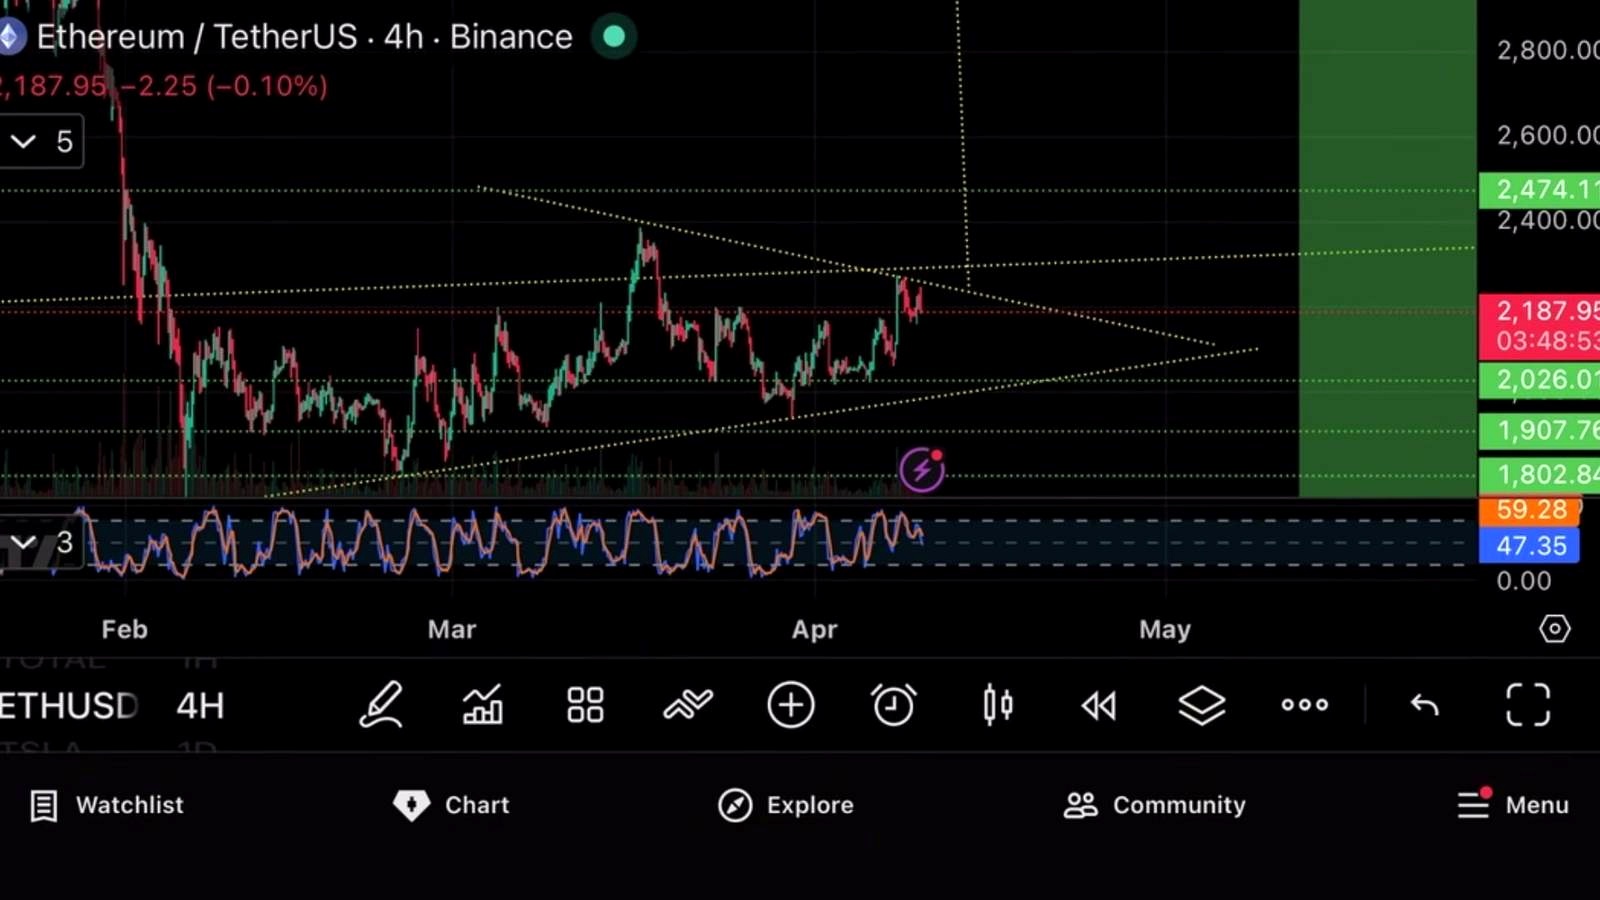
He applies a similar strategy to Ethereum, saying he sold a prior ETH trade for roughly $1,700 to $2,000 in profit and is now reloading with laddered orders. He cites Ethereum entries around $2,680, $2,000, $1,900, $1,800, $1,700 and even $1,400, while describing one setup that targets a return to all-time highs near $4,800.
The broader point is that he is treating current weakness as an accumulation zone, not a trend to short aggressively, even as he acknowledges near-term overbought conditions on lower time frames.
What could go wrong with this Bitcoin-bottom thesis
The clearest risk to the analyst’s view is that cycle analogs stop working cleanly when the market structure changes. Bitcoin now trades in a more macro-sensitive environment than it did in prior halving eras. Spot ETF flows, real yields, dollar strength, central bank expectations and geopolitical stress can overpower tidy historical timing models.
A second problem is the tension inside his own setup. He says Bitcoin is oversold on higher time frames, but also flags a lower-time-frame triple top and says the current breakout attempt may be early. That leaves room for a much deeper flush before any sustained move toward $100,000. If Bitcoin loses the $69,400 area decisively and starts accepting below the analyst’s laddered zones around $67,000 and $65,000, traders may begin to focus less on “bottoming” and more on whether the market is repricing toward a broader macro risk-off scenario.
There is also a risk he does not fully address: oversold indicators are not timing tools by themselves. In strong downtrends, stochastic readings can stay pinned for extended periods. Likewise, scaling in without hard stops can work in a cyclical recovery, but it can also magnify drawdowns if the thesis is early or wrong.
The other side of this trade is simple: bears would argue Bitcoin’s push toward $73,000 failed, momentum on shorter time frames is fading, and geopolitical relief rallies can reverse quickly if headline risk returns.
What to watch next
The most immediate trigger is whether Bitcoin can hold above the high-$69,000 area after the recent failed push toward $73,000. A sustained move back through the low-$70,000s would strengthen the case for an early breakout. A break below $69,400 would shift attention to $67,000, then $65,000, where the analyst says he is prepared to add.
Beyond price, traders should watch whether risk assets continue to recover alongside easing geopolitical fears. If equities rebound while Bitcoin keeps underperforming, that would weaken the bullish bottoming argument. If both rise together, the case for a cyclical low becomes more credible.
FAQ
What is a stochastic indicator in crypto trading?
A stochastic oscillator is a momentum tool that compares an asset’s closing price to its recent range. Traders use it to gauge whether price is overbought or oversold. It can be useful for spotting exhaustion, but it is not a standalone signal for entries or exits.
What does a symmetrical triangle mean for Bitcoin?
A symmetrical triangle is a chart pattern formed by lower highs and higher lows, showing compression. It usually signals that a larger move is coming, but it does not guarantee direction. Traders often wait for a confirmed breakout or breakdown with volume.
How does this compare with previous Bitcoin halving cycles?
Past cycles often showed a long post-halving advance followed by a deep correction before the next major base formed. The analyst’s argument is that the current market is broadly following that rhythm, though this cycle has also been shaped by ETF flows and stronger macro correlations than earlier ones.
What would invalidate a bullish BTC accumulation strategy at these levels?
A sustained loss of support zones such as the upper $60,000s, combined with weakening risk appetite across broader markets, would challenge the idea that this is just a bottoming phase. If Bitcoin keeps making lower highs and lower lows despite oversold readings, traders may conclude the cycle model is early or wrong.
What happened the last time Bitcoin was deeply oversold on higher time frames?
In prior cycles, deeply oversold weekly or monthly momentum often appeared near important lows, including major correction phases like 2022. But the path was rarely clean. Markets often chopped, retested lows or briefly broke them before recovering.
Source

John Burnell focuses on Bitcoin infrastructure, wallet security and blockchain technology. He writes educational articles explaining how Bitcoin works and how the technology evolves.


