Bitcoin is trying to bounce, but the bigger question for traders is whether this is a relief rally inside a broader downtrend or the start of a durable bottom. According to More Crypto Online, the answer still leans bearish: BTC may see a short-term rebound, but the larger correction may not be over, with downside risk stretching from the mid-$50,000s to as low as the $30,000 area later this year.
The core thesis: Bitcoin is still in a broader correction
According to More Crypto Online, Bitcoin remains in a “large correction” and the market has not yet shown convincing evidence that a durable low is in place. The host ties that view to a break below the 21-week EMA in early October, which he describes as the first major bear-market signal. That same moving average is now acting as resistance near $80,500, reinforcing the idea that the trend has turned hostile rather than simply volatile.
The analyst’s main support zone for the broader move sits between $24,300 and $56,300, though he places special emphasis on support around $55,000 to $56,000. If that area fails, he argues Bitcoin could drop relatively quickly toward $43,000 to $44,000, with heavier longer-term confluence in the $32,000 to $36,000 zone. He notes that a move to roughly $35,000 would amount to about a 50% drawdown from current levels near $69,000.
That view is bearish, but it is not completely outside the range of market debate. Bitcoin has repeatedly delivered brutal retracements even inside longer-term upcycles, and traders still watch the 21-week moving average as a rough dividing line between trend continuation and trend failure. At the same time, the broader market context is more complicated than a simple cycle-repeat thesis. Spot ETF demand, corporate treasury buying, and a structurally tighter liquid supply backdrop have changed the market’s plumbing compared with prior cycles. That does not make sharp drawdowns impossible, but it does mean older four-year analogs may be less reliable than they were in earlier eras.
Why the analyst still leaves room for a bounce first
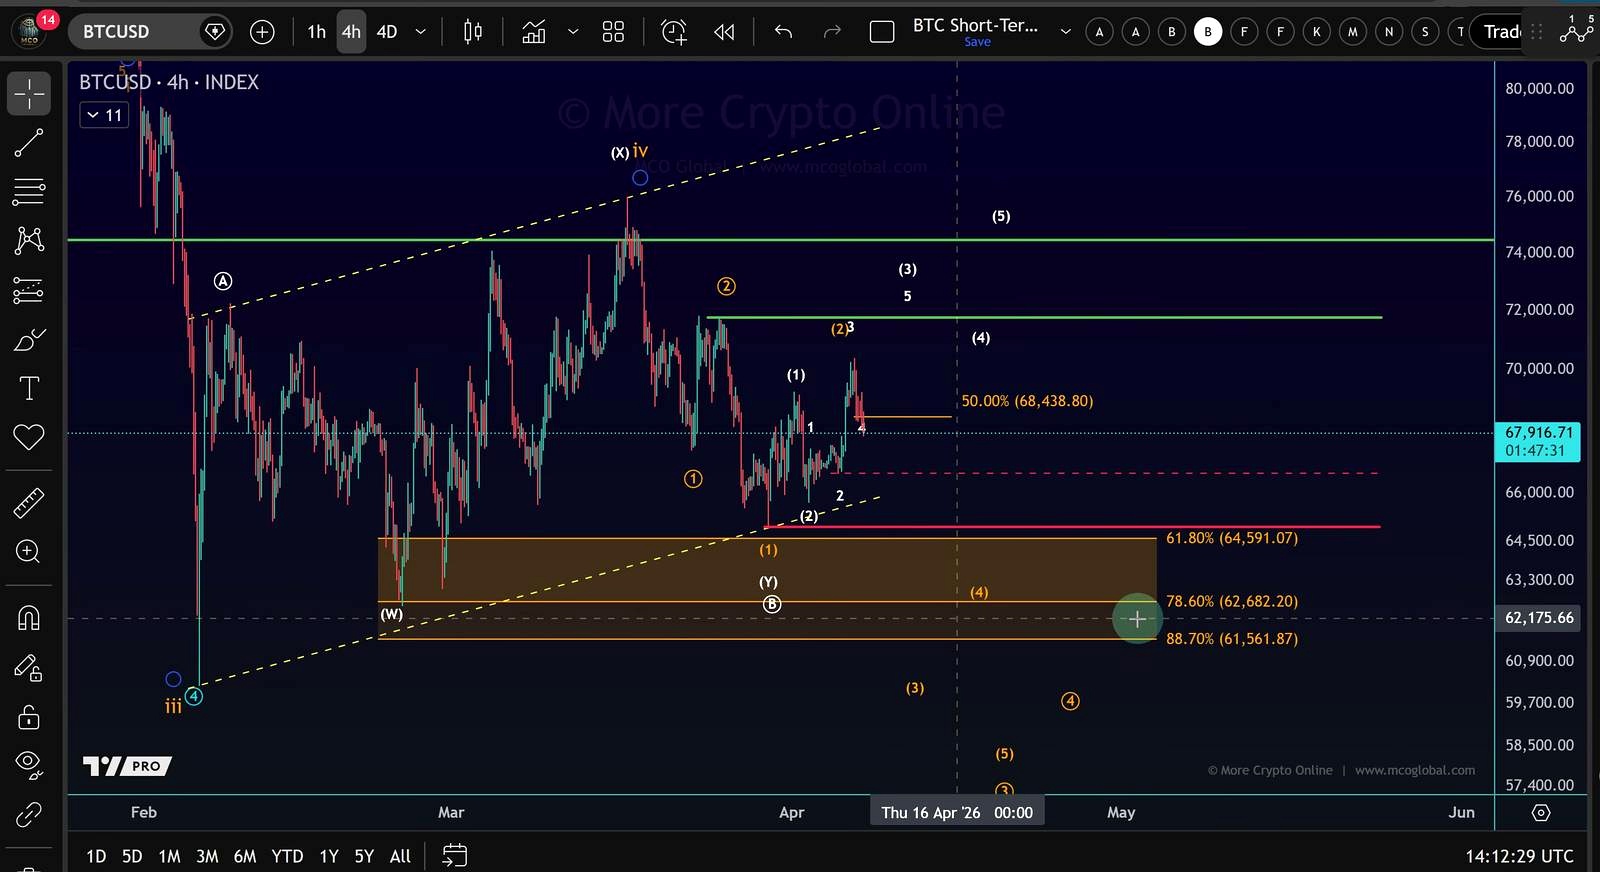
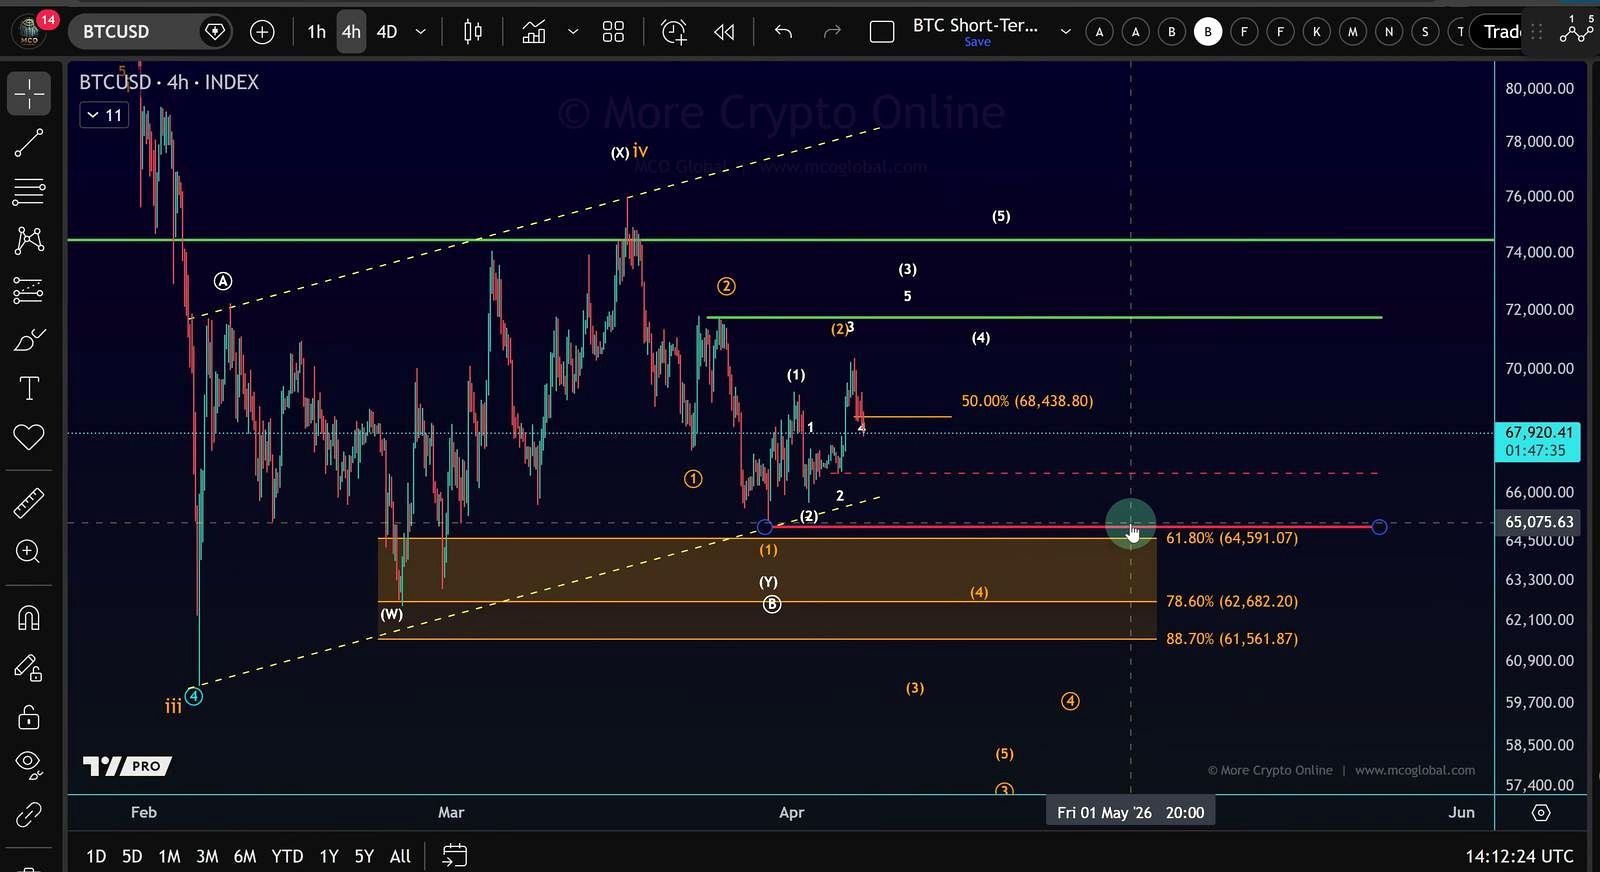
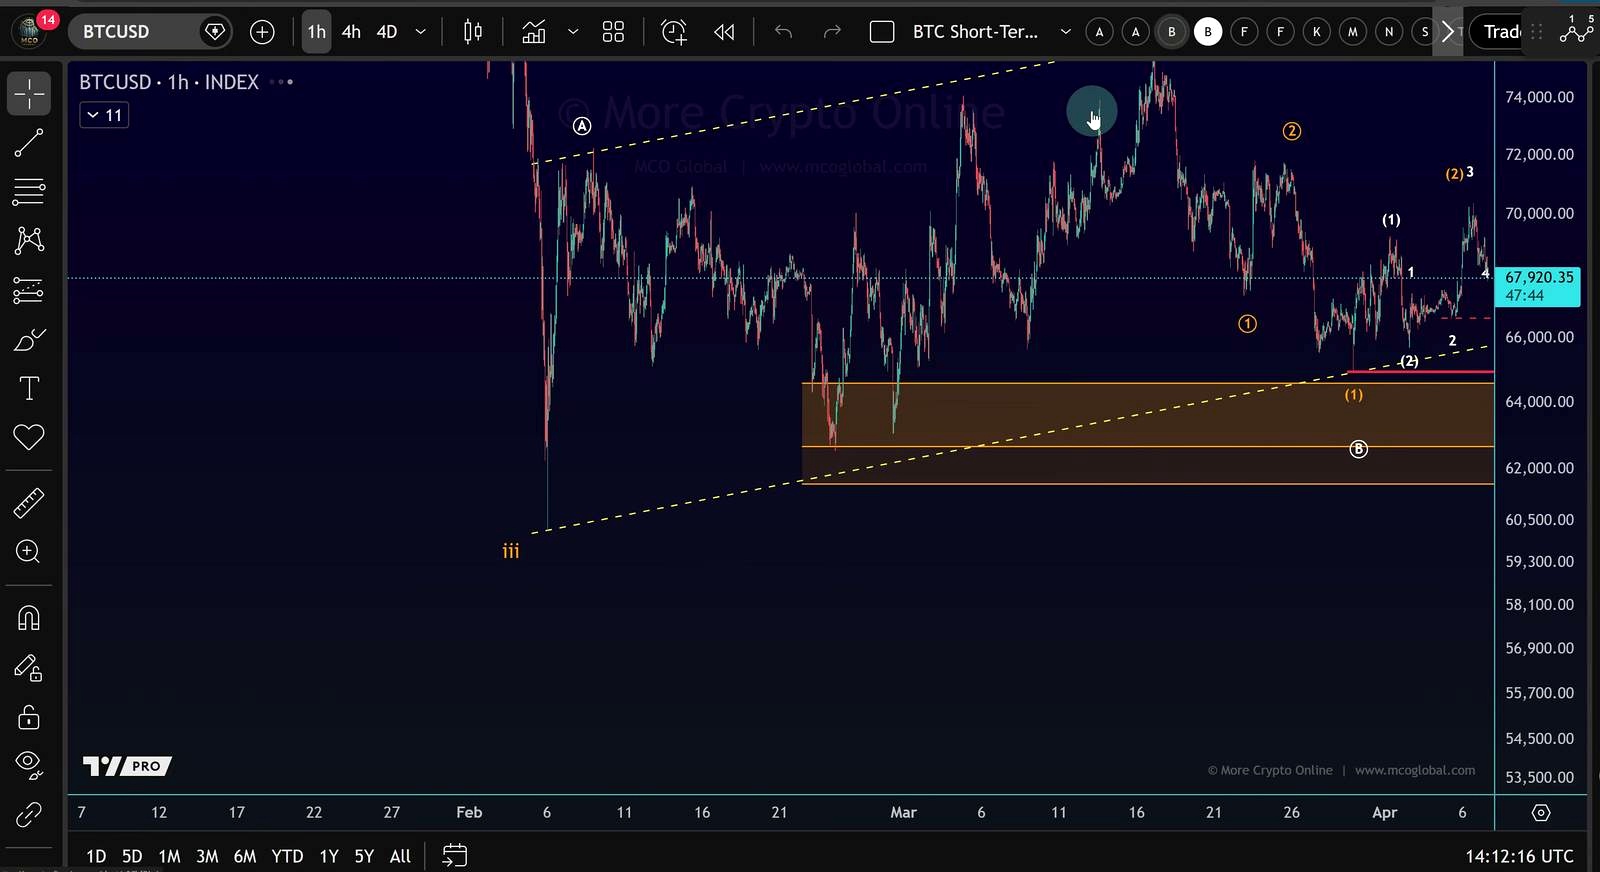
According to More Crypto Online, the near-term picture is not purely one-way lower. The host says Bitcoin could still produce a larger countertrend bounce, potentially through April, so long as it holds a Fibonacci support zone between $61,560 and $64,590. In his framework, a break below that region would open the door to a more direct move into the $55,000 to $56,000 area.
He also identifies $74,460 as an important resistance level, alongside a yellow trend line and additional Fibonacci resistance overhead. That framing matters because it defines the market as corrective rather than impulsively bullish. In Elliott Wave terms, the host sees current upside as a possible B-wave bounce, which he explicitly describes as one of the hardest structures to predict. That is why he avoids firm upside targets even while saying he has a “slight preference” for more rebound before the next leg lower.
On lower time frames, the analyst says a speculative bullish scenario remains possible if Bitcoin can hold above $65,770. He also highlights a channel boundary near $65,700. If BTC loses those levels, he argues the market would be signaling that it is not in a strong uptrend and that another low is likely. In that case, any attempted rebound would simply reset the corrective bounce rather than reverse the broader bearish structure.
The host also points to a “high cycle top and bottom” indicator with a green band that has historically coincided with meaningful lows or at least attractive accumulation zones. But he is careful not to oversell it. The market is “currently not in the green band yet, ” he says, which in his view supports the idea that Bitcoin has not formed a final low. Projecting the current trend forward, he suggests the correction could continue through the year, with a possible low in Q4 or around the end of the year. He references November and says a continuation of the current trend could point to a price around $30,000, while stressing that this is “wild speculation.”
What could go wrong with this bearish thesis
The clearest risk to the analyst’s call is that Bitcoin never loses the mid-$60,000 support cluster and instead reclaims higher resistance with momentum. A sustained move back above $74,460, followed by recovery of the 21-week EMA near $80,500, would weaken the idea that every rally is merely corrective. If bulls regained those levels and held them, the market could reframe the latest drawdown as a shakeout rather than the start of a prolonged bear phase.
There is also a structural counterargument the host only indirectly addresses: this cycle has not unfolded in a clean historical pattern. Bitcoin now trades inside a market shaped by ETF flows, macro liquidity expectations, and increasingly institutional balance-sheet demand. In that environment, traditional cycle tools and oscillator bands can still be useful, but they can also lag major regime shifts.
Another challenge is timing. Even if the analyst is eventually right on direction, bearish traders can still get hurt badly if the B-wave bounce extends further than expected. Countertrend rallies in Bitcoin are notorious for being violent, especially after a steep decline such as the 55% drawdown the host says the market has already seen from the October high. In other words, the “other side” of this trade is not just a bullish macro surprise. It is the possibility that the market chops higher long enough to invalidate premature shorts before any deeper decline arrives.
What to watch next
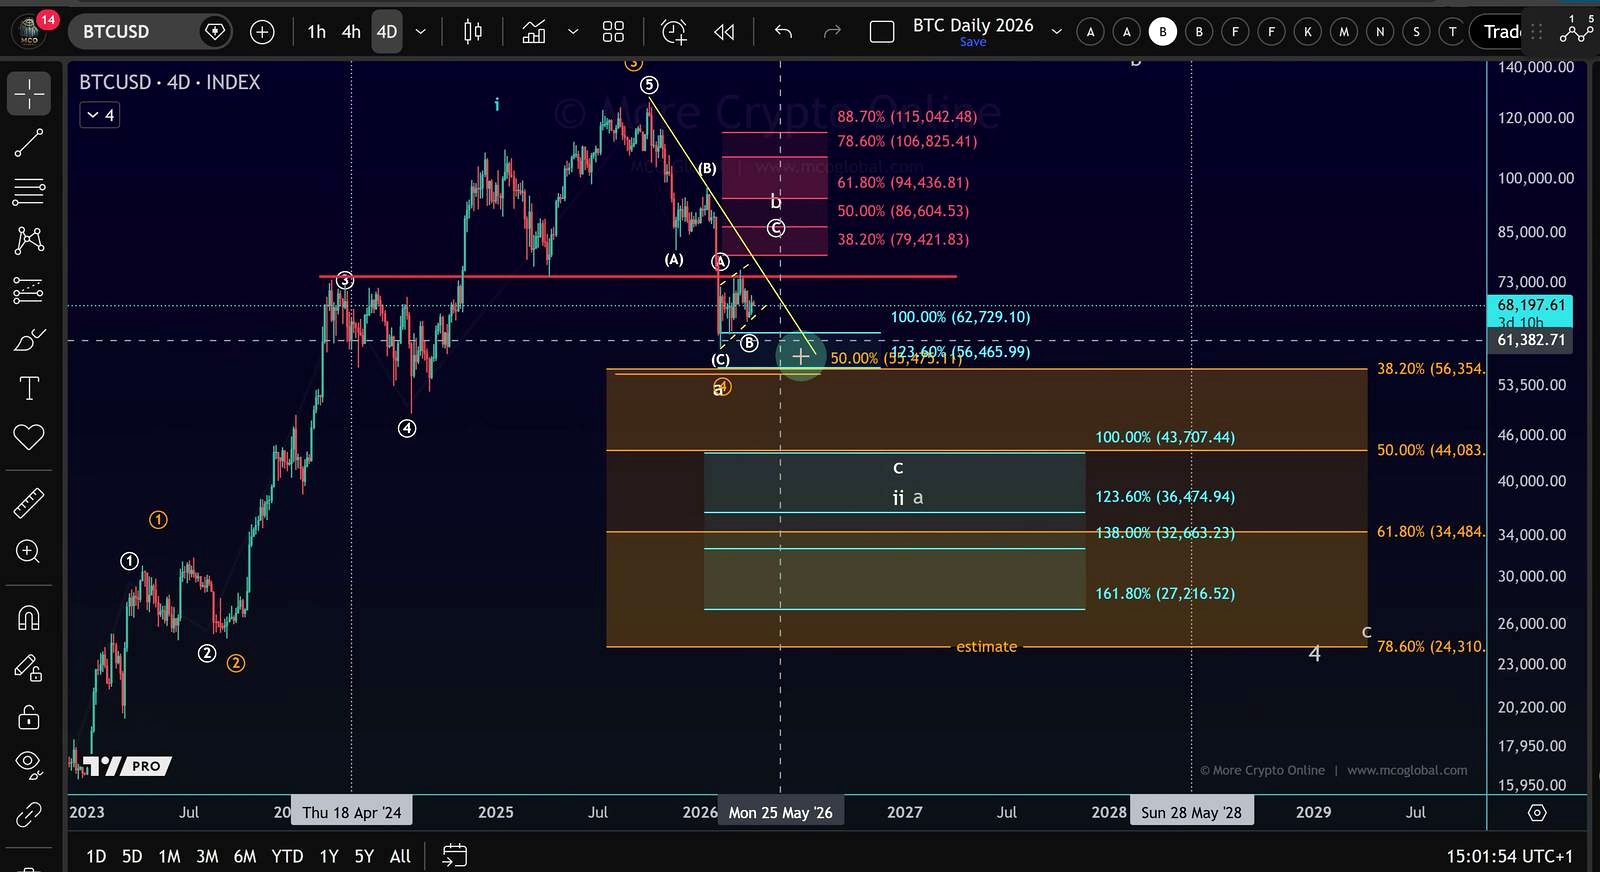
The immediate line in the sand is the $61,560 to $64,590 support zone. If Bitcoin loses that range decisively, focus shifts quickly to $55,000 to $56,000. If that lower band fails too, the next downside markers in the analyst’s framework are $43,000 to $44,000, then $32,000 to $36,000.
On the upside, traders watching for thesis invalidation should track whether BTC can hold above $65,770, reclaim $74,460, and eventually push back through the 21-week EMA near $80,500. Beyond price alone, the host’s broader time-based thesis points to Q4 as the window where a more meaningful low could form, with November flagged as a period of particular interest.
FAQ
What is the 21-week EMA, and why do Bitcoin traders care about it?
The 21-week exponential moving average is a long-term trend indicator that gives more weight to recent price action than a simple moving average. In Bitcoin, many traders use it as a rough bull-market support line. When BTC trades above it, momentum is often seen as healthier. When it breaks below and fails to reclaim it, traders often treat that as a sign of deeper trend weakness.
What is a B-wave in Elliott Wave analysis?
A B-wave is typically a countertrend move that happens after an initial decline in an ABC correction. It often looks deceptively strong and can convince traders that the worst is over, only for a C-wave lower to follow. That is why analysts often describe B-waves as difficult to trade: they can be sharp, choppy, and highly variable in size.
How large are Bitcoin bear-market drawdowns historically?
Historically, Bitcoin has suffered multiple drawdowns exceeding 50%, and in full bear markets those declines have often run much deeper. The exact scale varies by cycle, and recent institutional participation may change the pattern, but large retracements remain normal enough that traders still model them as realistic outcomes.
What would a bullish invalidation of this setup look like?
In practical terms, bulls would want to see Bitcoin hold the mid-$60,000 support area, break above $74,460, and then reclaim the 21-week EMA near $80,500. A sequence like that would suggest the market is rebuilding trend strength rather than simply bouncing inside a broader decline.
What happened the last time Bitcoin traded near the $30,000-$35,000 area?
The $30,000 to $35,000 region has historically acted as a major battleground in prior cycle transitions, including periods where long-term buyers stepped in after sharp deleveraging. That does not guarantee the same outcome again, but it helps explain why many technical analysts still view that range as a potentially important high-confluence support zone.
Reference Video

An Indian crypto journalist covering the developments in the Bitcoin and blockchain industries. Her work helps readers understand key changes in the world of digital assets.


