After another failed push above $70,000, the immediate question for Bitcoin traders is whether this is just another range-bound shakeout or the start of a deeper pullback. According to Champs Crypto, the market is sitting at a pivotal level around $68,000, where a bounce could send BTC back toward $71,000 to $72,000, while a breakdown could reopen $66,000 and, in a harsher scenario, even $60,000.
Bitcoin’s near-term thesis hinges on whether $68K holds
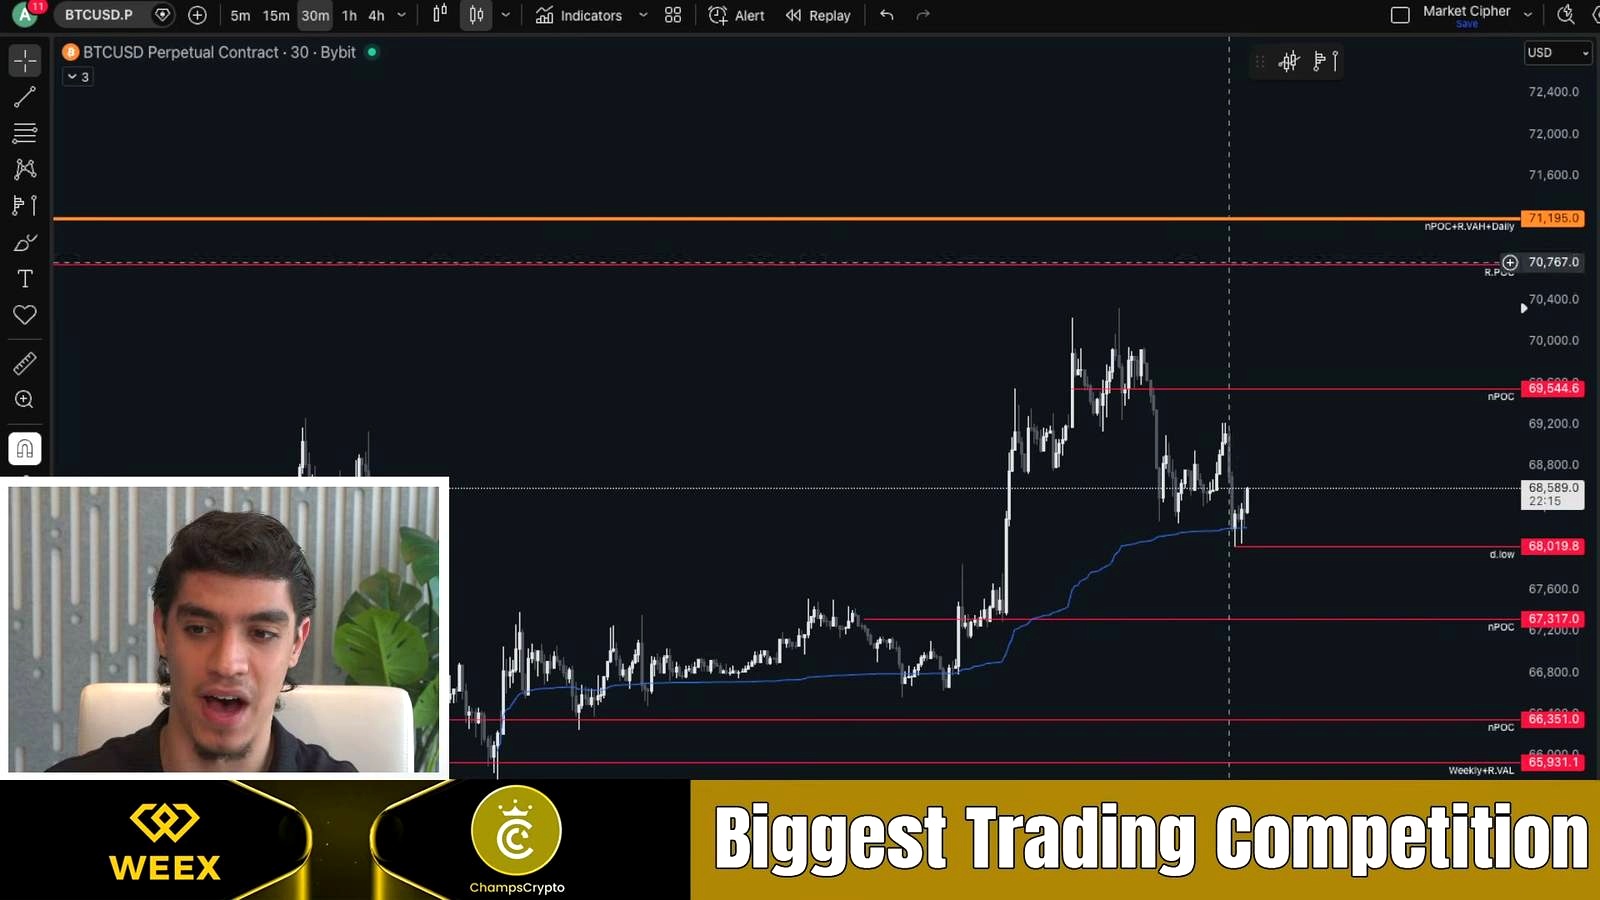
According to Champs Crypto, the central setup is straightforward: Bitcoin has pulled back after what the host described as a fakeout above $70,000, but it has not yet done enough damage to fully break the local bullish structure. He said BTC fell from roughly $70.3K to $68K, yet is still testing an area that includes the annual session open, a prior high-volume zone, and a local uptrend drawn from around $67.7K.
The analyst framed $68,000 as the key line separating a rebound from a deeper retracement. If buyers defend it, he sees room for a move to roughly $71,000 and potentially $72,000. If Bitcoin loses $68,000, he said the next meaningful downside area is around $66,000. Below that, he warned the market could slide toward $60,000.
That view fits a broader market reality: Bitcoin has spent roughly two months moving sideways in a choppy consolidation rather than trending cleanly. This kind of regime often punishes breakout traders and rewards range traders who fade extremes. In that sense, Champs Crypto’s framing is not especially contrarian. Many short-term desks have treated the market as a range until proven otherwise, especially after repeated failures near prior highs.
What supports that thesis is the simple fact that BTC has not yet reclaimed a decisive trend on higher time frames. But what challenges it is equally clear: structurally, Bitcoin has remained resilient for much of this cycle by absorbing sharp liquidations and then recovering quickly. Consolidations near all-time highs are often continuation patterns, not tops. That means a dip into support is not automatically bearish; it may just be another reset before an eventual breakout.
Trade setups: fakeouts at the daily low, resistance at $69.4K and $71K
According to Champs Crypto, the most actionable ideas are not heroic directional calls but conditional trades built around fakeouts. The host said he was still holding a prior long taken at $66.8K, though he also disclosed that a separate short idea was stopped out before Bitcoin later dropped. That short was based on a rejection around the high-volume area and the $70,000 round number, but BTC first made what he called a final shakeout before falling.
The current plan is more selective. For longs, the analyst wants to see a flush below the daily low followed by a reclaim. More specifically, he said a reclaim of around $68.4K after a New York session fakeout could offer a “scalpy” long entry. He emphasized that he does not want to chase a bounce while too many traders are already crowding into longs.
For shorts, the host is watching a sweep of the daily high and a move into the prior day’s point of control, which he placed near $69.4K. If that area rejects, he sees a possible lower high forming on local time frames. Failing that, he said a rally into $71,000 would become the cleaner short zone.
He also pointed to support between roughly $67.3K and $66,000, though he was notably cautious about that pocket, saying he does not view those supports as especially strong. That caution matters. A weak support zone is exactly where traders can get trapped trying to catch every bounce in a range that is already losing momentum.
Behind that framework is a mix of local trend references. Champs Crypto cited a local uptrend from about $65.7K and a broader downtrend anchored from around $76,000. In practical terms, he is arguing that Bitcoin is stuck between a smaller rescue trend from the lows and a larger ceiling from the top. That creates the kind of compression where intraday fakeouts become common and conviction trades become harder.
What could go wrong with this thesis
The clearest way this view fails is if Bitcoin simply reclaims the upper part of the range and holds it. A clean move back above $70,000, followed by acceptance instead of another rejection, would undermine the near-term short setups built around $69.4K and $71,000. In that case, what looks like a local lower high setup would instead become a springboard for continuation.
The opposite failure is on the downside. While Champs Crypto does acknowledge the risk of a drop to $66,000 and even $60,000, the transcript focuses mainly on chart structure and short-term order flow. It does not spend much time on external catalysts. A macro shock, ETF flow reversal, large miner selling wave, or sudden risk-off move in equities could make technical support levels far less reliable than they appear intraday.
There is also a tactical risk in the fakeout-based approach itself. In a volatile consolidation, waiting for a perfect sweep-and-reclaim setup can reduce false entries, but it can also leave traders repeatedly underexposed if the market turns cleanly without offering the ideal trigger. On the short side, betting against strength near range highs has worked in this chop, but that strategy can fail hard once the market transitions from distribution to breakout.
The other side of the trade is simple: bulls can argue this entire move is still just high-time-frame consolidation below resistance, not evidence of trend exhaustion. If dips keep getting bought above the mid-$60,000s, the burden shifts back to bears to prove they can force a decisive break lower.
What to watch next
The first trigger is whether Bitcoin can reclaim and hold around $68.4K after any further sweep of the daily low. That is the analyst’s preferred near-term long signal. Above, traders are likely watching $69.4K as the first resistance test and then $71,000 as the cleaner short zone Champs Crypto highlighted.
On the downside, a failure to hold $68,000 would shift focus to the support band between $67.3K and $66,000. If that area fails decisively, the tone changes from range rotation to a deeper retracement scenario. If buyers instead defend current levels and BTC starts printing higher lows into the New York session, the bounce case gains credibility quickly.
FAQ
What is a fakeout in Bitcoin trading?
A fakeout is a move beyond a widely watched level that quickly reverses. In Bitcoin, that often means price briefly trades above resistance or below support, triggers breakout or breakdown entries, and then snaps back the other way. Traders use fakeouts to identify trapped positioning.
What is a point of control, or POC?
The point of control is the price level where the most volume traded during a given period in a volume profile. Traders watch it because price often reacts there, especially in range-bound markets where high-volume nodes can act as magnets or resistance/support zones.
Why do traders care so much about round numbers like $70,000?
Round numbers attract attention from retail traders, algorithmic systems, and options positioning. They often become psychological support or resistance zones. When price briefly moves through them and then reverses, the move can be more violent because many stops and momentum entries cluster around those levels.
How is this setup different from a true breakout?
A true breakout usually involves price pushing above a major level and then holding there, often with follow-through and improving momentum. The setup discussed here is more about rejection and reclaim behavior inside a range. Until Bitcoin shows acceptance above the upper boundary, many traders will still treat rallies as range rotations rather than trend expansion.
What happened the last time Bitcoin spent weeks consolidating near highs?
Historically, long consolidations near major highs have produced mixed outcomes. Sometimes they resolve upward as continuation patterns after leveraged excess is cleared out. Other times they become topping structures if repeated rejections weaken demand. The difference usually shows up in whether support levels keep holding on pullbacks and whether buyers can eventually secure a weekly close above resistance.
Video Source

John Burnell focuses on Bitcoin infrastructure, wallet security and blockchain technology. He writes educational articles explaining how Bitcoin works and how the technology evolves.


