Markets are testing whether Bitcoin’s latest pullback is a routine shakeout or the start of a deeper unwind. With sentiment stuck in extreme fear and ETF flows turning decisively negative, the key question is whether BTC can keep defending a support zone that some traders now see as the line between consolidation and a slide toward $50,000.
Core Thesis: A Breakdown Could Open the Door to $50K
According to Davinci Jeremie, Bitcoin is sitting on a “huge level” that, if it breaks, could send the asset “collapsing down to almost $50K.” His argument is primarily technical: BTC is holding an upward channel for now, but he warns that another retest may fail. If price closes below that trend support, he says the chart begins to resemble either a head-and-shoulders top or an M-pattern breakdown, with a measured move pointing toward the 1.618 Fibonacci extension near $50,000.
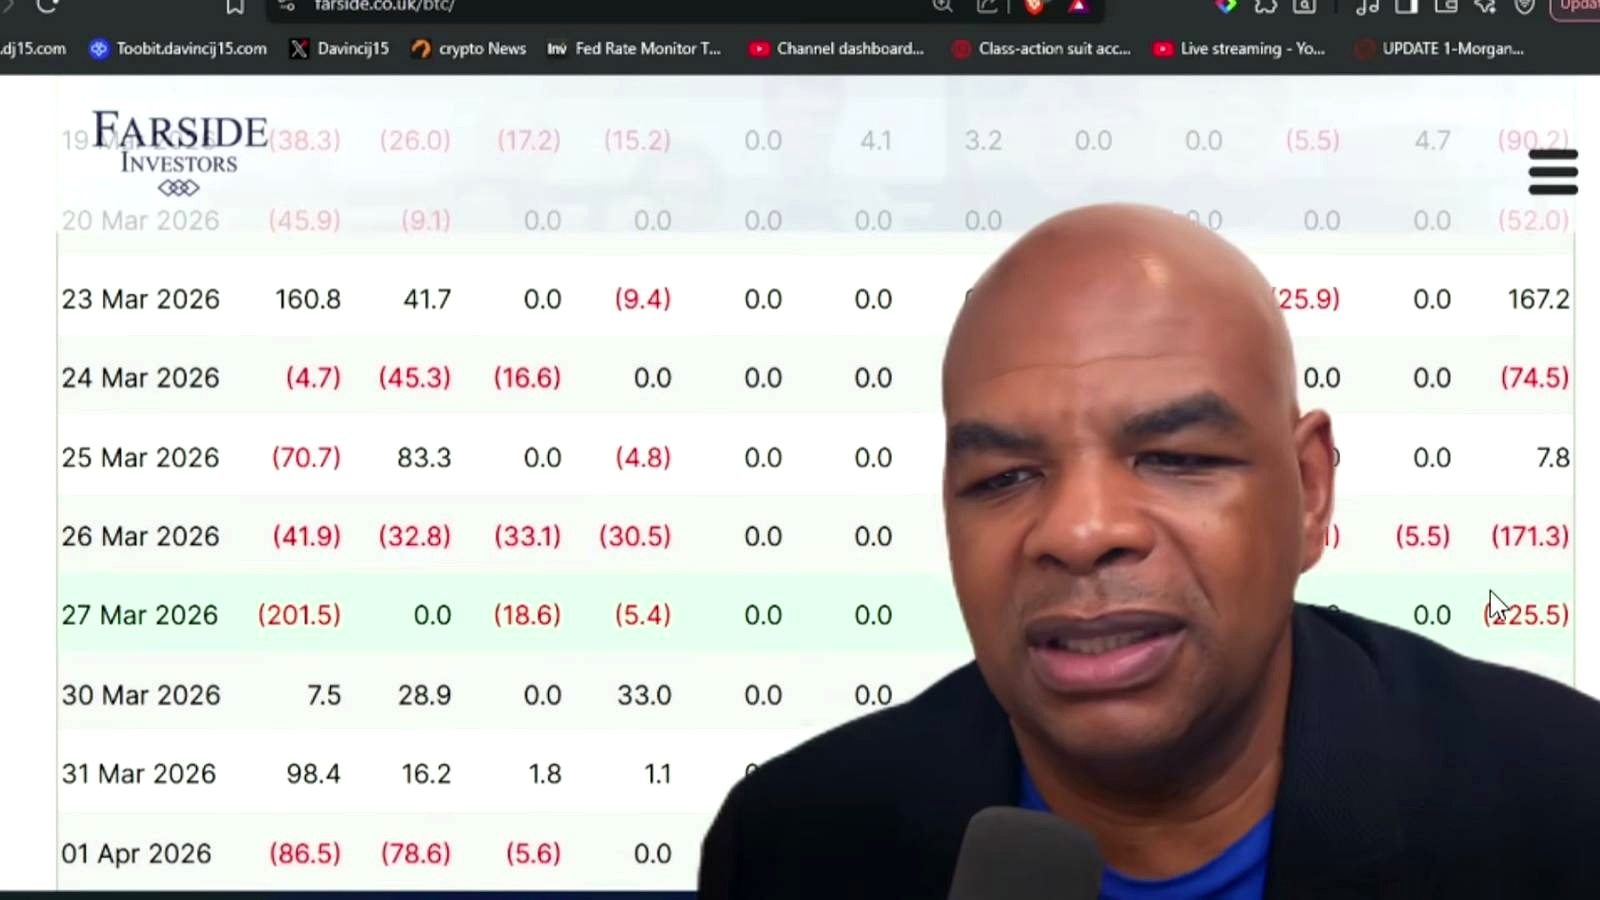
The host ties that bearish setup to deteriorating market internals. He highlights broadly negative ETF flow data, says this week looks “absolute brutal, ” and points to a Fear and Greed Index reading of 9, which he describes as “extreme fear.” He also references Bitcoin treasury data showing holdings around 18.189, then compares that with the prior week at roughly 18.6K, framing it as nearly 19K worth of Bitcoin sold. He further claims public companies dumped about 14,000 BTC and characterizes the total value hit as roughly $8 billion.
That framing lands at a moment when broader market sentiment is already fragile. Extreme fear readings often emerge near local bottoms, which is one reason some traders would treat Jeremie’s warning as a contrarian signal rather than a reason to panic. But persistent ETF outflows can matter because spot funds have become a major marginal buyer in this cycle. If those flows reverse and become a steady source of supply, technical support levels tend to weaken faster than they would in a neutral macro backdrop.
At the same time, the bearish case is not consensus in every corner of the market. Long-term Bitcoin bulls still tend to view sharp drawdowns as structurally normal inside bull cycles, especially when leverage is being flushed from the system. The tension, then, is between cyclical demand weakness now and the larger thesis that Bitcoin remains in a broader uptrend unless higher-timeframe support breaks decisively.
Supporting Analysis: Weak Trend, Repeated Retests, and a Market Losing Momentum
According to Davinci Jeremie, the immediate issue is not that Bitcoin has already broken down, but that its support is being stressed repeatedly. He says the level is “holding, ” yet adds that if BTC tries to retest it again, he is not sure it will continue to hold. That is a familiar technical concern: each test of support can exhaust buyers, especially when momentum indicators and flows are already deteriorating.
He describes the current structure as a modest upward channel, but calls the trend line “very weak.” That matters because weak channels often fail without much warning when they are not reinforced by stronger volume or a clear macro catalyst. He also notes that the existence of an upward trend is “not an indication that we’re going higher, ” a useful distinction in a market where many traders confuse short-term stabilization with renewed strength.
The analyst’s chart read leans on pattern recognition. He first flags an M-pattern, then says the formation can also be viewed as a head-and-shoulders setup, even if “not the greatest.” In practical terms, both patterns imply the same thing: a market that failed to sustain upside momentum and is now at risk of confirming distribution if neckline or channel support gives way. He then applies Fibonacci analysis and says the downside extension aligns with the 1.618 target around $50K.
Outside the chart, Jeremie points to several signs of pressure. He emphasizes negative ETF flow prints and says treasury and public-company data are worsening. He also mentions a Bollinger Band signal that appeared to fail because price moved sharply in the opposite direction. That type of fast reversal usually suggests trend instability rather than clean continuation. He briefly broadens the weakness thesis to altcoins as well, saying Solana appears “headed lower, ” which is relevant because broad crypto underperformance often reinforces bearish BTC sentiment in the short term.
Still, one notable nuance in his view is that he does not tell holders to dump spot Bitcoin. He explicitly says viewers “really shouldn’t” panic sell, even while acknowledging that some may choose to short as a speculative trade. That places his call closer to a tactical bearish warning than a full-cycle bear-market declaration.
What Could Go Wrong
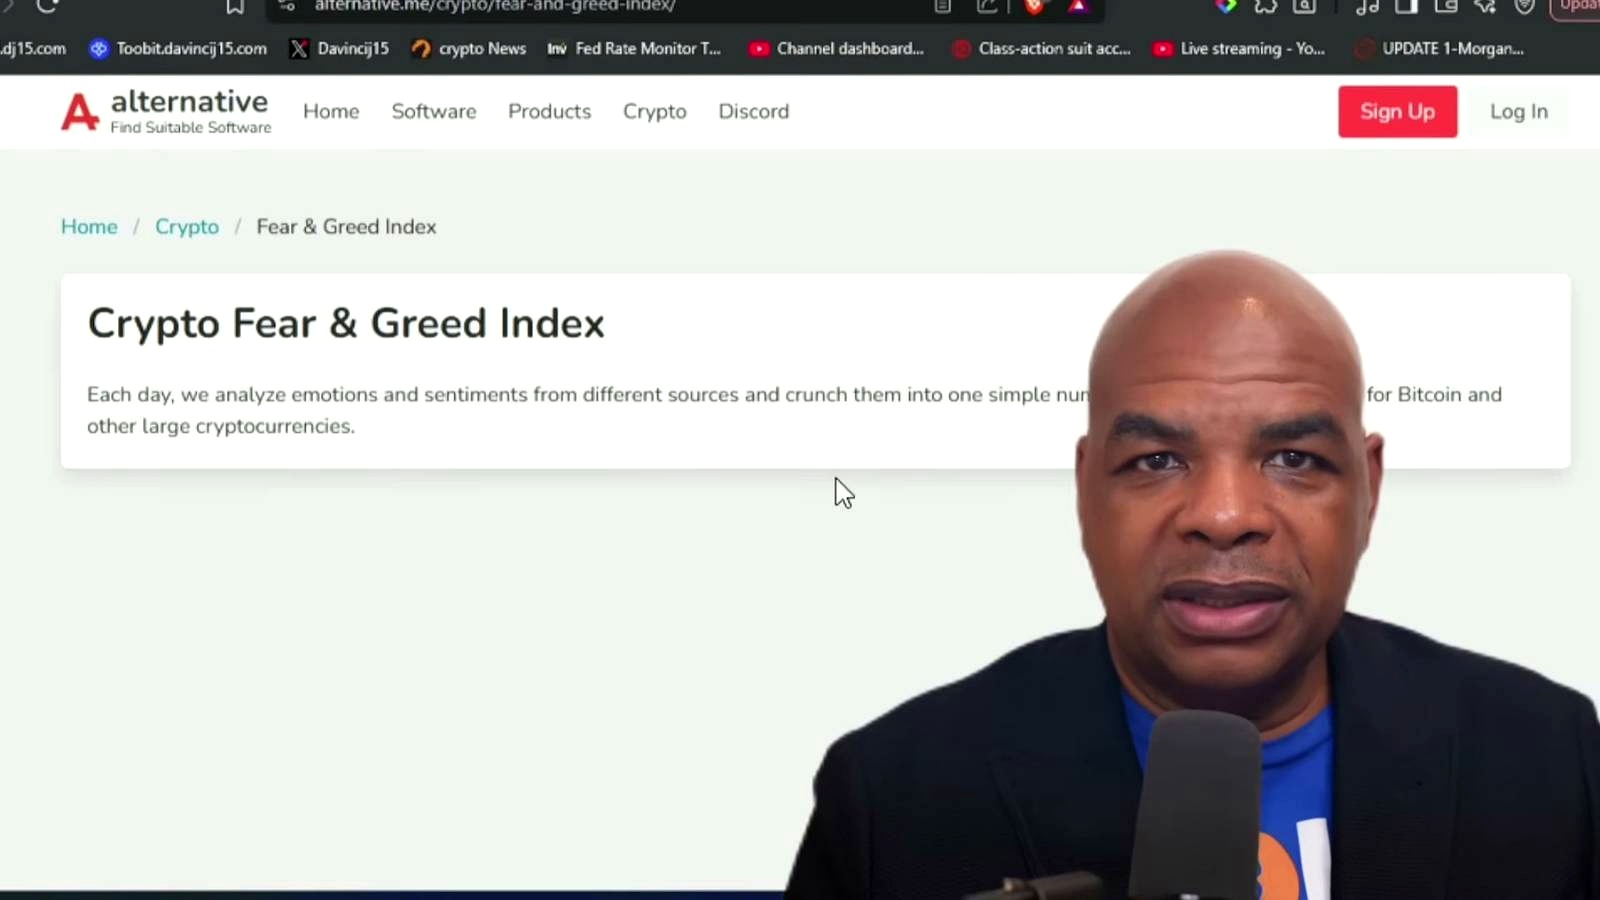
The biggest risk to this bearish thesis is that extreme fear is already doing the work of a capitulation signal. A Fear and Greed reading of 9 is deeply washed out by historical standards, and markets at those levels often rebound simply because most weak hands have already sold. If ETF outflows moderate, or if a single strong inflow day resets sentiment, a heavily bearish market can squeeze upward quickly.
Another problem is the nature of pattern-based forecasting itself. Head-and-shoulders and M-formations are widely followed, but they frequently fail in crypto, where liquidity can shift abruptly and invalidate clean textbook setups. A weak upward channel can break down, but it can also morph into a larger consolidation before the next move higher. In other words, the chart may be fragile without necessarily confirming a straight-line path to $50,000.
Jeremie also does not spend much time on the macro side of the trade. If bond yields ease, the dollar softens, or risk appetite improves across equities, Bitcoin can decouple from short-term fear readings and treasury outflow narratives. Likewise, structural buyers such as long-term holders, corporates, or ETF allocators could step back in faster than expected.
The other side of this trade is straightforward: if BTC keeps defending the current channel and reclaims short-term resistance instead of losing support on a close, the bearish pattern loses credibility. In that scenario, repeated warnings about “lights out” downside would start to look like a late-cycle overread of sentiment and flow data rather than a durable trend change.
What to Watch Next
The first trigger is simple: whether Bitcoin closes below the upward channel support Jeremie identifies. He does not provide an exact price in the transcript, so traders are left watching the local trend line rather than a precise number. After that, the next confirmation point is whether BTC retests the broken level and fails, which would strengthen the head-and-shoulders or M-pattern interpretation.
Beyond the chart, watch ETF flow data for signs that the current streak of negative prints is either accelerating or stabilizing. A rebound in flows would weaken the immediate bearish case. Sentiment also matters: if the Fear and Greed Index stays near 9 without further price damage, that could hint at seller exhaustion. Jeremie also references the Bitcoin conference in Las Vegas running from April 27 to 29; while conferences rarely reverse markets on their own, they can shift narrative and sentiment if major corporate or policy headlines emerge.
FAQ
What is a head-and-shoulders pattern in Bitcoin trading?
A head-and-shoulders pattern is a bearish chart formation with three peaks: a left shoulder, a higher middle peak called the head, and a right shoulder. Traders usually focus on the “neckline.” If price breaks below that support, the pattern is considered confirmed and can imply further downside.
What does a 1.618 Fibonacci extension mean?
A 1.618 Fibonacci extension is a common technical-analysis target used to estimate how far a move might run after a breakdown or breakout. Traders project it from a prior swing high and low. It is not a guaranteed destination, but it is widely used as a potential measured-move objective.
Why do ETF outflows matter for Bitcoin price?
Spot Bitcoin ETFs can influence price because they represent large pools of demand or supply. Sustained inflows often support price by requiring underlying BTC purchases, while outflows can reduce that support and, in some cases, add selling pressure or weaken market sentiment.
How is extreme fear different from a bearish trend?
Extreme fear is a sentiment reading, not a trend by itself. It shows traders are nervous or risk-averse. Sometimes that aligns with a continuing downtrend. Other times it marks a capitulation zone where most selling has already happened and price begins to rebound.
What happened in past Bitcoin cycles when sentiment got this weak?
Historically, very low sentiment readings have often appeared near local or intermediate bottoms, though not always the final low. In strong bull cycles, those periods can become reset points before the trend resumes. In weaker macro environments, they can precede another leg down before a durable recovery forms.
Content Source

Omar Al-Sharif lives and works in the UAE and is involved in the blockchain technology industry. He writes articles on Bitcoin and digital assets as a personal passion, explaining complex topics in simple and understandable language.


