Bitcoin’s price has spent stretches of this cycle looking more tired than explosive, even as bullish structural narratives keep piling up. The real question for traders is whether that sideways action reflects fading demand, or a market quietly running out of coins available for sale.
According to Tim Talks Finance, the answer is the latter: Bitcoin is moving toward a seller-exhaustion event in which shrinking exchange balances, post-halving issuance cuts, ETF accumulation, and corporate treasury buying collide with an unusually sticky base of long-term holders. If that setup is right, the risk is not that buyers overpay by acting too early, but that they wait for a dip that never arrives.
The Core Thesis: Bitcoin’s Liquid Supply Is Tightening Faster Than Many Traders Appreciate
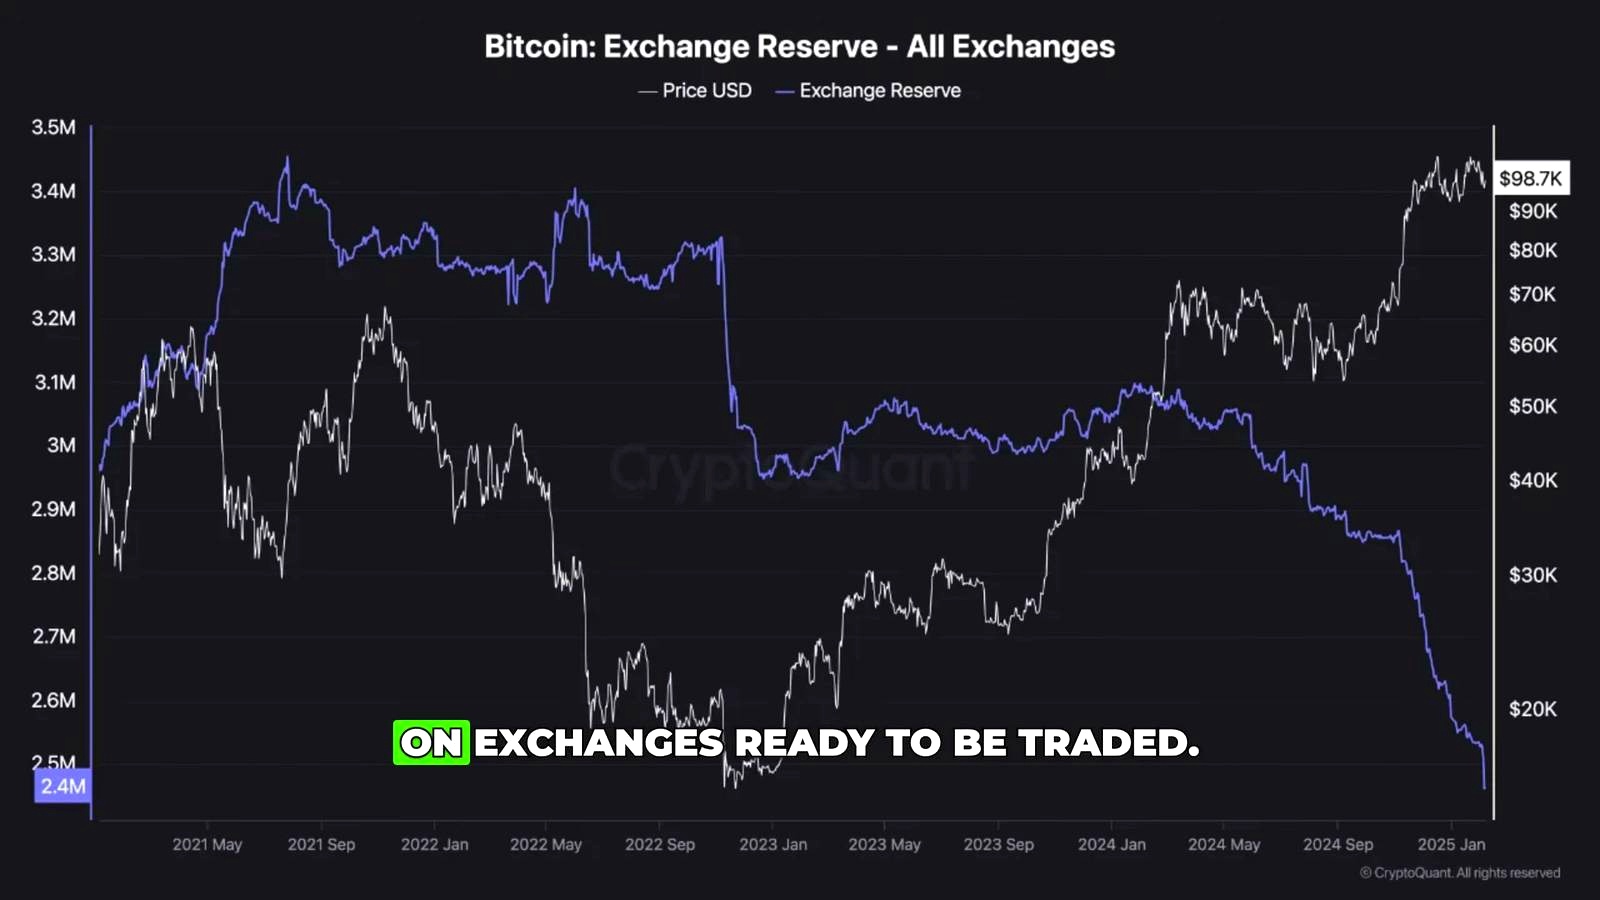
According to Tim Talks Finance, the key variable is not Bitcoin’s total supply but its “liquid supply”, the amount actually available to buy now. The host argues that exchange-held BTC, which he describes as the market’s effective “for sale” inventory, has fallen to its lowest level since 2018. At the same time, more supply has migrated into the hands of long-term holders, defined in the video as addresses that have not moved coins for more than 155 days.
That matters because Bitcoin’s market structure can change abruptly when available inventory gets thin. The analyst’s argument is straightforward: if new demand arrives while fewer coins sit on exchanges and a larger share is controlled by holders with little interest in selling, price may not rise smoothly. It may gap higher as buyers climb the order book in search of liquidity.
The halving is a central part of that thesis. Tim Talks Finance notes that the April 2024 halving cut miner issuance from roughly 900 BTC per day to about 450. That reduced the natural flow of newly created coins entering the market just as spot Bitcoin ETFs opened a major new demand channel. The host highlights that the U.S. SEC approved spot Bitcoin ETFs on Jan. 10, 2024, and says those vehicles have at times absorbed “many times” daily miner production. He also points to a turn in ETF flows after net outflows in January and February 2026, with roughly $1.3 billion to $1.6 billion in net inflows in March 2026.
That view is broadly aligned with one of the more durable bullish narratives in this cycle: structurally constrained supply meeting regulated institutional demand. But it is more aggressive than consensus in one respect. Many market participants accept the supply-tightening story in the long run while still arguing that short-term price is dominated by macro liquidity, derivatives positioning, and profit-taking from older holders. In other words, the market agrees the shelf may be getting emptier; it does not universally agree that a near-term “price vacuum” is imminent.
Supporting Analysis: ETFs, Treasuries, and Thin Order Books
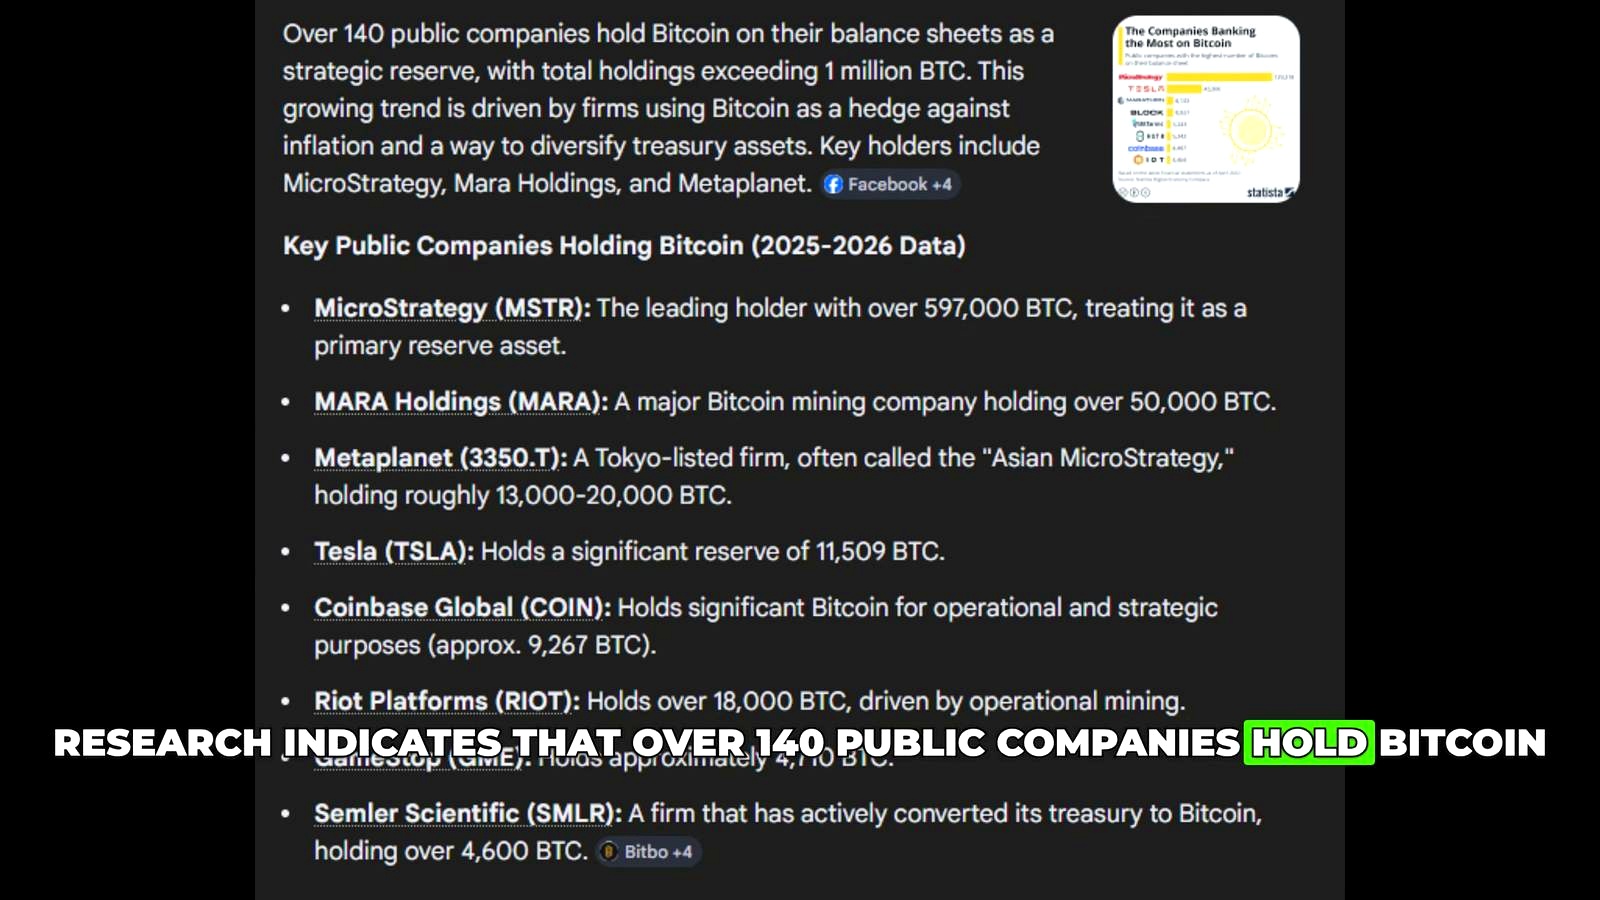
Tim Talks Finance builds the rest of the case around who is buying and who is not selling. On the demand side, he frames spot ETFs as “relentless vacuum cleaners” because each new share ultimately requires real Bitcoin to be acquired and held. He then adds corporate balance sheet demand to the picture, citing Strategy Inc. as holding 762,099 BTC as of late March 2026. Beyond that single company, he says more than 140 public firms collectively hold over 1.1 million BTC.
The host also extends the buyer base beyond corporations. He cites El Salvador’s 2021 legal-tender move, Bhutan’s mining activity since 2019, and says the U.S. established a Strategic Bitcoin Reserve in March 2025. Combined, the point is not merely that demand exists, but that more of it now comes from actors with longer decision cycles and stronger balance sheets than typical retail traders.
At the same time, he argues retail euphoria is still mostly absent. As evidence, he says on-chain activity such as active addresses has not yet shown the kind of speculative spike associated with a full-blown mania. He also points to stablecoin market capitalization reaching more than $315 billion in March 2026, characterizing it as sidelined capital that could re-enter crypto markets if momentum returns.
The most vivid part of the thesis is the order-book example. The analyst walks through a hypothetical sequence in which 10 BTC offered at $70,000 gets bought immediately, followed by asks at $70,100 and $70,200. In his scenario, once the last meaningful supply near $75,000 is absorbed, the next real liquidity might sit at $80,000 or even $85,000. That is what he means by seller exhaustion: not a market with no sellers at all, but one with insufficient nearby inventory to keep price moving in orderly increments.
This framing fits with how Bitcoin has behaved in prior expansion phases. The asset often spends long periods compressing volatility before repricing quickly once new demand overwhelms available float. Traders who focus only on spot price can miss that dynamic, especially when coins are moving off exchanges and into custodial or cold-storage arrangements that lower tradable supply without creating a visible headline each day.
What Could Go Wrong

The biggest risk to this thesis is that “tight supply” does not automatically mean “higher price now.” Bitcoin can remain range-bound for months if demand growth slows enough to match reduced available inventory. The host acknowledges choppy ETF flows, but the bearish version of that story is more serious than he suggests: if institutional allocations stall, a supply squeeze can stay theoretical rather than catalytic.
There is also a distinction between coins being illiquid at current prices and coins being permanently unavailable. Long-term holders may be insensitive to ordinary volatility, but history shows they do distribute into strong rallies. A sharp move higher could bring dormant supply back to market and soften the exact kind of price vacuum the analyst expects.
Macro risk is another underdeveloped counterpoint. Bitcoin is still a global liquidity asset. If real yields rise, dollar strength returns, or risk markets reprice lower, even strong structural demand can be overwhelmed in the short term. In that environment, ETF buyers may step back while leveraged crypto traders de-risk, creating the opposite of a squeeze: forced selling into thin bids.
Finally, exchange balances are useful but imperfect. Coins leaving exchanges can signal long-term conviction, but they can also move to custodians, OTC venues, or other structures that do not remove sell-side capacity as completely as the most bullish interpretation implies. Thin visible inventory is not always the same thing as no available supply.
What to Watch Next
If Tim Talks Finance is right, confirmation will likely come from a combination of renewed ETF inflows, continued low exchange balances, and a clear break from sideways trading into fast upside continuation. The most important near-term signal is whether March 2026 ETF inflows of roughly $1.3 billion to $1.6 billion prove to be a one-off rebound or the start of a steadier institutional bid.
Traders should also watch whether retail activity begins to accelerate alongside price. If active addresses, stablecoin deployment, and spot-led buying all rise while long-term holder supply remains sticky, the probability of abrupt upside repricing increases. If those indicators stay muted and BTC keeps chopping, the supply-squeeze thesis may still be directionally right but early on timing.
FAQ
What is Bitcoin “liquid supply”?
Liquid supply refers to the portion of Bitcoin that is realistically available for purchase or sale in the market now. In practice, traders often approximate this through exchange balances and other measures of coin mobility. It differs from total supply, which includes coins that are lost, dormant, or held by investors with no intention of selling.
Why do exchange balances matter for BTC price?
Lower exchange balances can indicate fewer coins are readily available to meet new demand. When buyers enter a market with limited nearby sell orders, price may need to move higher to attract sellers. That does not guarantee an immediate rally, but it can make upside moves sharper when momentum arrives.
What are long-term holders in Bitcoin analysis?
They are typically wallets or entities that have held Bitcoin without moving it for a defined period. In the video, Tim Talks Finance uses the common threshold of more than 155 days. Analysts watch this group because it often reflects conviction-driven holders who are less reactive to short-term price swings.
How does this compare with past Bitcoin halving cycles?
Previous halving cycles also reduced new supply and were eventually followed by strong price appreciation, though not in a straight line. The difference this cycle is the presence of spot ETFs and larger corporate treasury participation, both of which create more formalized demand channels than in earlier eras.
What would invalidate a seller-exhaustion thesis for BTC?
A sustained period of weak ETF demand, rising sell pressure from long-term holders, or a broader macro risk-off environment could all undermine the setup. If Bitcoin keeps failing to build momentum despite improved liquidity conditions and reduced issuance, that would suggest hidden supply is larger than bulls assume or demand is weaker than expected.
Original Video

Omar Al-Sharif lives and works in the UAE and is involved in the blockchain technology industry. He writes articles on Bitcoin and digital assets as a personal passion, explaining complex topics in simple and understandable language.


