Risk assets are wobbling again as geopolitical stress rattles sentiment and traders debate whether this is the start of a deeper unwind or another buy-the-dip moment. According to James Crypto Guru, the answer is to keep buying weakness in Bitcoin and Ethereum, even as he expects BTC could still slide toward the low-$63,000 area before the market stabilizes.
Core Thesis: Buy When Sentiment Turns Hostile
According to James Crypto Guru, the central trade is straightforward: accumulate crypto when the crowd turns negative, then sell into euphoric upside later in the cycle. In the video, he says he is layering Bitcoin buy orders at $65,700, $63,595 and around $63,000, while setting Ethereum bids at $1,976, $1,900 and $1,880. He also says he would look to sell into much higher prices, citing $126,000 for Bitcoin and $4,000 for Ethereum as levels where broader enthusiasm could return.
That framing is broadly bullish on a medium-term basis, but tactically cautious in the near term. The analyst says Bitcoin’s short-term chart resembles a head-and-shoulders setup, which is why he expects lower buy orders may still get filled. On Ethereum, he argues support is beginning to form around $1,970 to $1,976, even though his next deeper order remains at $1,900.
This sits in a familiar place relative to broader market sentiment: structurally bullish, short-term nervous. That has been a common posture in crypto during periods when macro and geopolitical headlines dominate price action. The broader market context includes elevated sensitivity to war-related risk, tighter liquidity conditions than in peak bull-market phases, and a tendency for leveraged crypto positions to be flushed out quickly on weekend volatility. At the same time, dip-buying remains a durable instinct whenever traders believe the larger cycle is still intact.
The key challenge to this thesis is that “fear” alone is not a sufficient bottom signal. Markets can stay oversold longer than dip buyers expect, especially if external shocks hit equities, commodities and crypto all at once.
Supporting Analysis: The Levels, Trades and Cross-Market Signals
James Crypto Guru ties his crypto positioning to a broader risk-off backdrop. He says the “Iran war” is not good for markets and notes that traders in his group are flipping short on assets including Tesla and Solana, while also shorting gold. That mix suggests a market in transition rather than one with a clear, unified macro narrative. In many risk-off episodes, traders usually expect crypto and high-beta tech to weaken together, but gold often trades as a hedge. A short-gold call, by contrast, implies either a tactical view or a belief that positioning is becoming crowded.
In his own book, the analyst says one open WEX trade is up 560 in profit, while his Bybit Bitcoin and Ethereum trades are down about 5.5K and 1.4K. He says his Bitcoin trade size is 133,000 and his Ethereum trade size is 41,000. Those figures matter less as universal advice than as a signal of conviction: he is scaling into weakness rather than waiting for confirmation.
On Ethereum, he says the market has stayed above $1,900 since March 9 and has spent roughly a month holding above $1,976 by early April. He adds a new order for 5 ETH at $1,976, with another 5 ETH at $1,900 and further bids lower. The logic is classic laddered buying: start small, increase size if price falls.
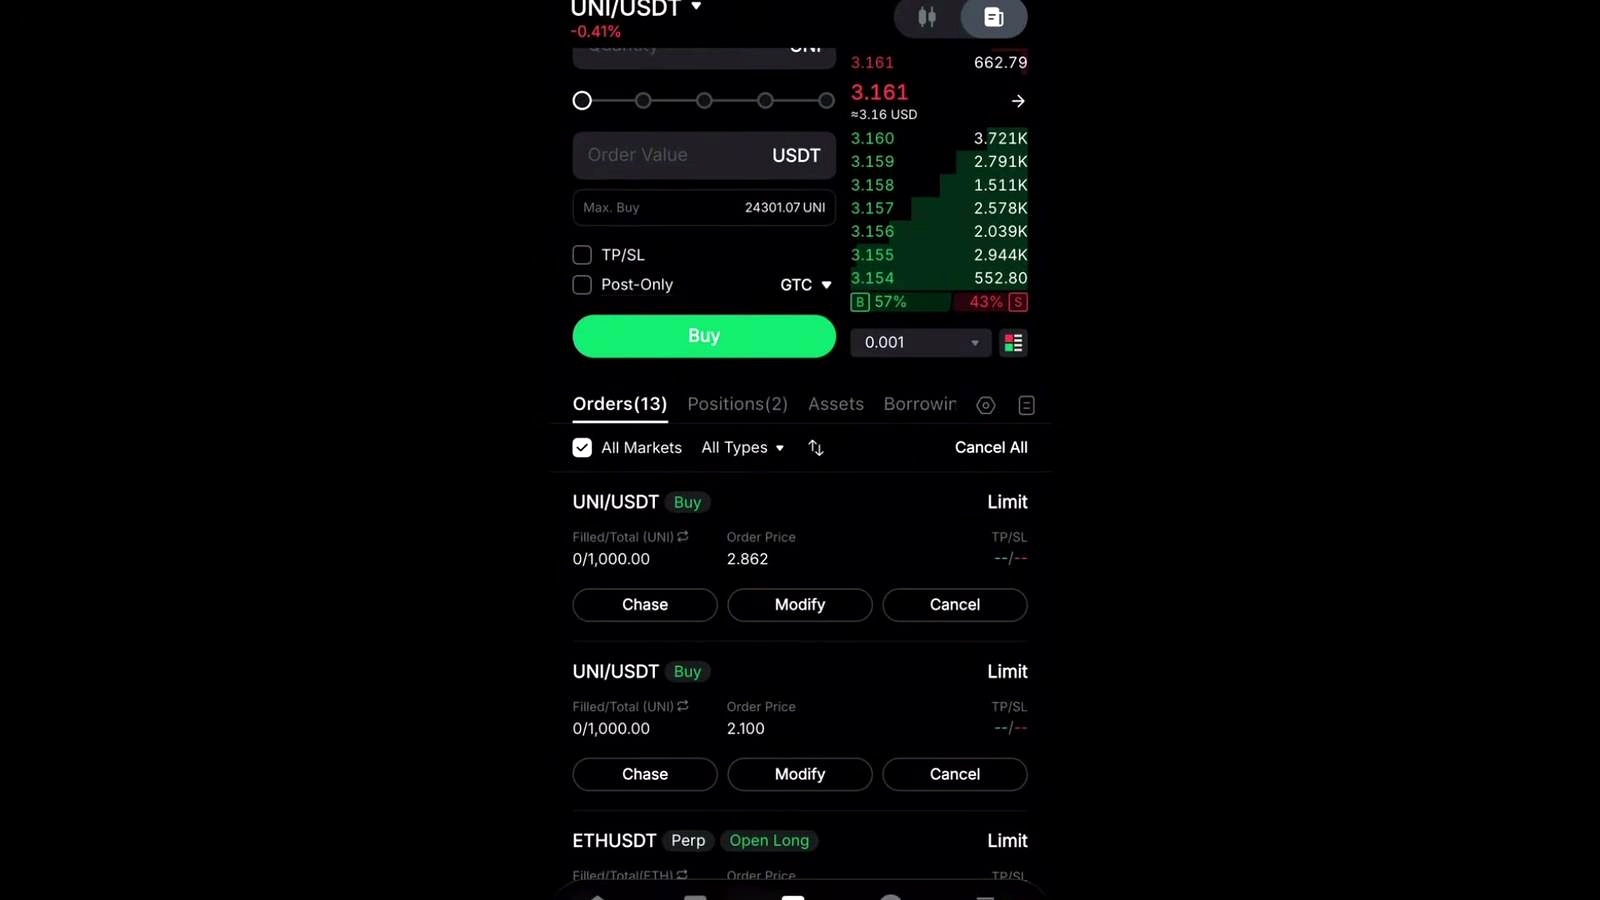
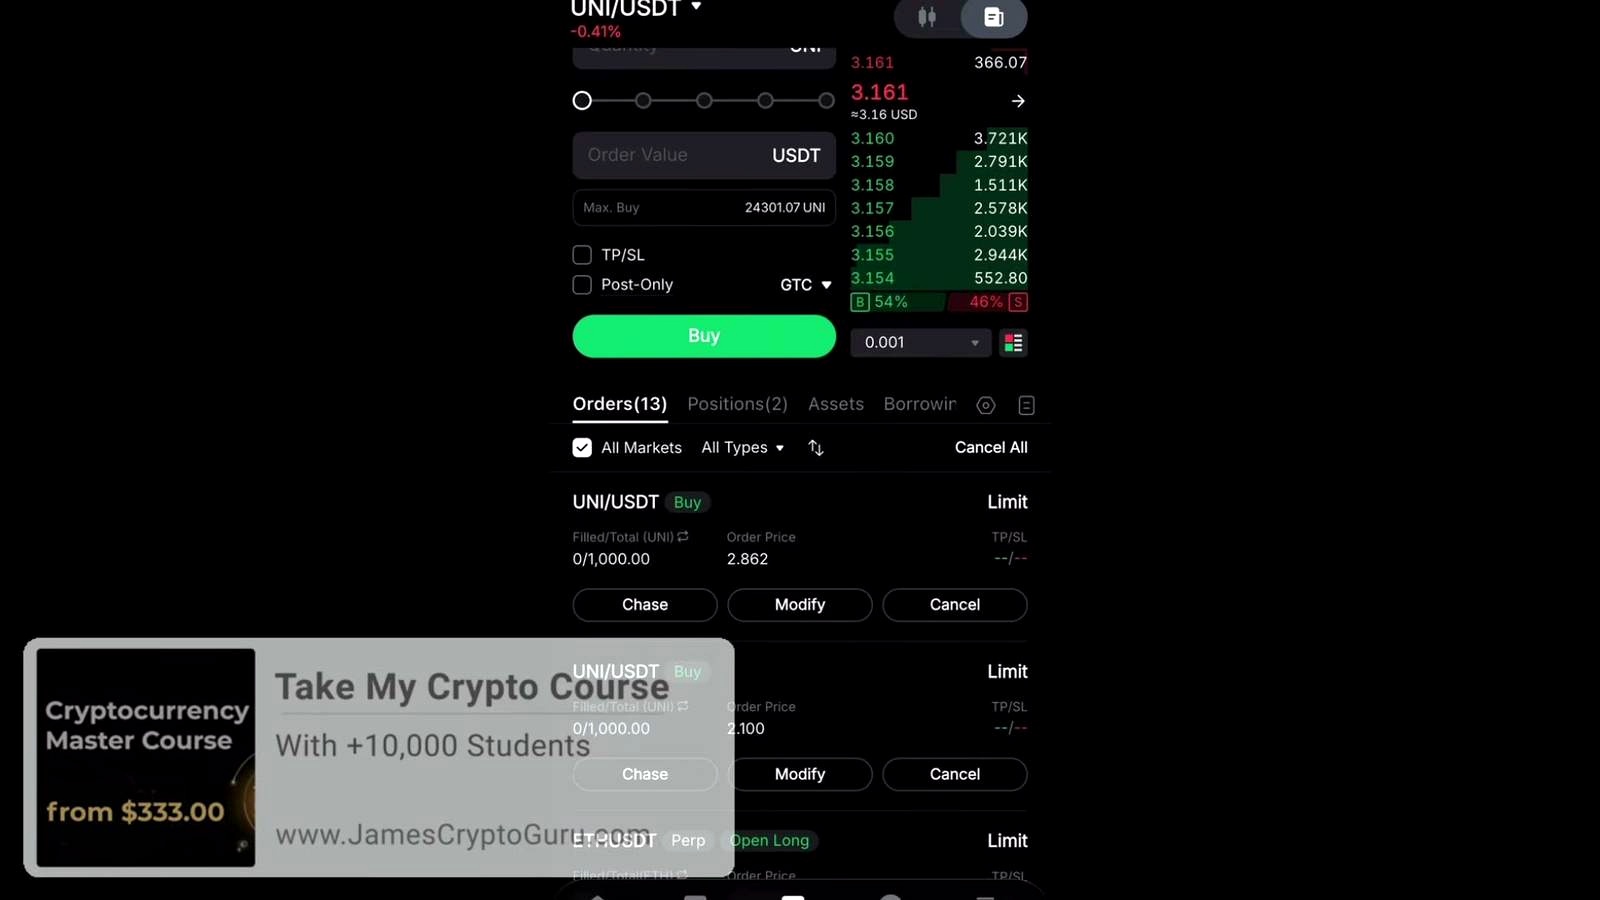
He applies the same mindset outside BTC and ETH. On Uniswap, he says the token dropped to about $3.20, bounced to $3.60 for roughly 16%, then fell back near $3. He says he has additional orders at $2 and $2.10. The message is consistent across assets: he wants exposure when sentiment is weakest, not when momentum already looks safe.
What Could Go Wrong
The clearest risk to the thesis is that this is not simply a sentiment washout but a broader repricing of risk. If geopolitical tensions intensify, crypto may not behave like an isolated high-growth trade; it may trade like a liquidity-sensitive risk asset alongside tech stocks and altcoins. In that environment, support zones such as $63,000 on Bitcoin or $1,970 on Ethereum can fail quickly.
Another issue is the analyst’s reliance on contrarian psychology. Buying when “everyone hates crypto” sounds compelling, but true capitulation is hard to measure in real time. Negative commentary on social media does not necessarily mean positioning is clean. If leverage remains elevated, a market can keep falling through multiple “fear” phases before a durable low forms.
There is also a technical contradiction embedded in the setup. He flags a short-term head-and-shoulders pattern on Bitcoin, which is usually treated as a bearish continuation or reversal risk, yet remains eager to keep averaging in before that pattern fully resolves. That can work in a larger bull trend, but it increases drawdown risk if the chart breaks lower first and recovers later.
The other side of the trade is simple: trend followers would rather wait for reclaim signals than catch a falling knife. They may miss the exact bottom, but they avoid repeatedly buying into a market still under distribution. If BTC loses the mid-$60,000s decisively, those traders will argue patience was the better trade.
What to Watch Next
For Bitcoin, the first trigger is whether price actually taps the analyst’s laddered zone between $65,700 and the low $63,000s, and what kind of reaction follows. A sharp reclaim after a sweep of that area would support the dip-buying thesis. Continued weakness below it would undermine the idea that fear is already sufficient for accumulation.
For Ethereum, watch whether the market can continue holding the $1,970 to $1,976 area that he identifies as emerging support. If that floor breaks, attention shifts to $1,900 and then $1,880. Traders will also be watching whether geopolitical headlines continue to drive weekend volatility across both crypto and equities.
FAQ
What is a head-and-shoulders pattern in Bitcoin trading?
A head-and-shoulders pattern is a technical formation with three peaks: a higher middle peak flanked by two lower ones. Traders often treat it as a bearish signal if price breaks below the “neckline, ” though reliability depends on timeframe, volume and broader trend context.
Why do traders ladder buy orders instead of entering all at once?
Laddering means placing multiple bids at lower prices rather than making one full-sized entry. The approach helps average into volatility, reduces timing risk and preserves capital if the first entry is early. The tradeoff is that a market can reverse before lower orders are filled.
How does Bitcoin usually react during geopolitical shocks?
Bitcoin’s behavior during geopolitical stress has been mixed. At times it trades like a high-beta risk asset and falls with equities. In other moments, it recovers quickly if traders see the shock as temporary or expect central banks to lean more supportive later. The immediate reaction is often volatility rather than a clean safe-haven bid.
What would a practical long setup look like around these BTC levels?
A trader following this type of strategy might scale entries between $65,700 and roughly $63,000, then look for a bounce and higher-low structure before adding more. A more conservative trader might wait for price to reclaim a broken level after the dip instead of buying while the decline is still active.
What happened the last time Ethereum traded near $1,900?
According to the video, Ethereum had not traded below $1,900 since March 9 and had spent about a month holding above the high-$1,900s into early April. Traders often view repeated defense of a zone as evidence of support, but that support becomes more important to monitor each time it is retested.
Video Reference

An Indian crypto journalist covering the developments in the Bitcoin and blockchain industries. Her work helps readers understand key changes in the world of digital assets.


