Traders looking for Bitcoin to break cleanly higher are instead stuck in a market that keeps faking both bulls and bears out. The bigger question now is whether this is just consolidation before another leg up, or a messy countertrend bounce inside a wider correction. According to More Crypto Online, the answer is the second one, and that distinction could matter far more than the next intraday move.
Bitcoin’s core problem, according to More Crypto Online
According to More Crypto Online, Bitcoin is not in a clean uptrend at all. The host argues that the market is in a classic Elliott Wave B-wave environment: volatile, overlapping, uncertain, and prone to frustrating traders who mistake every short-term rally for trend resumption.
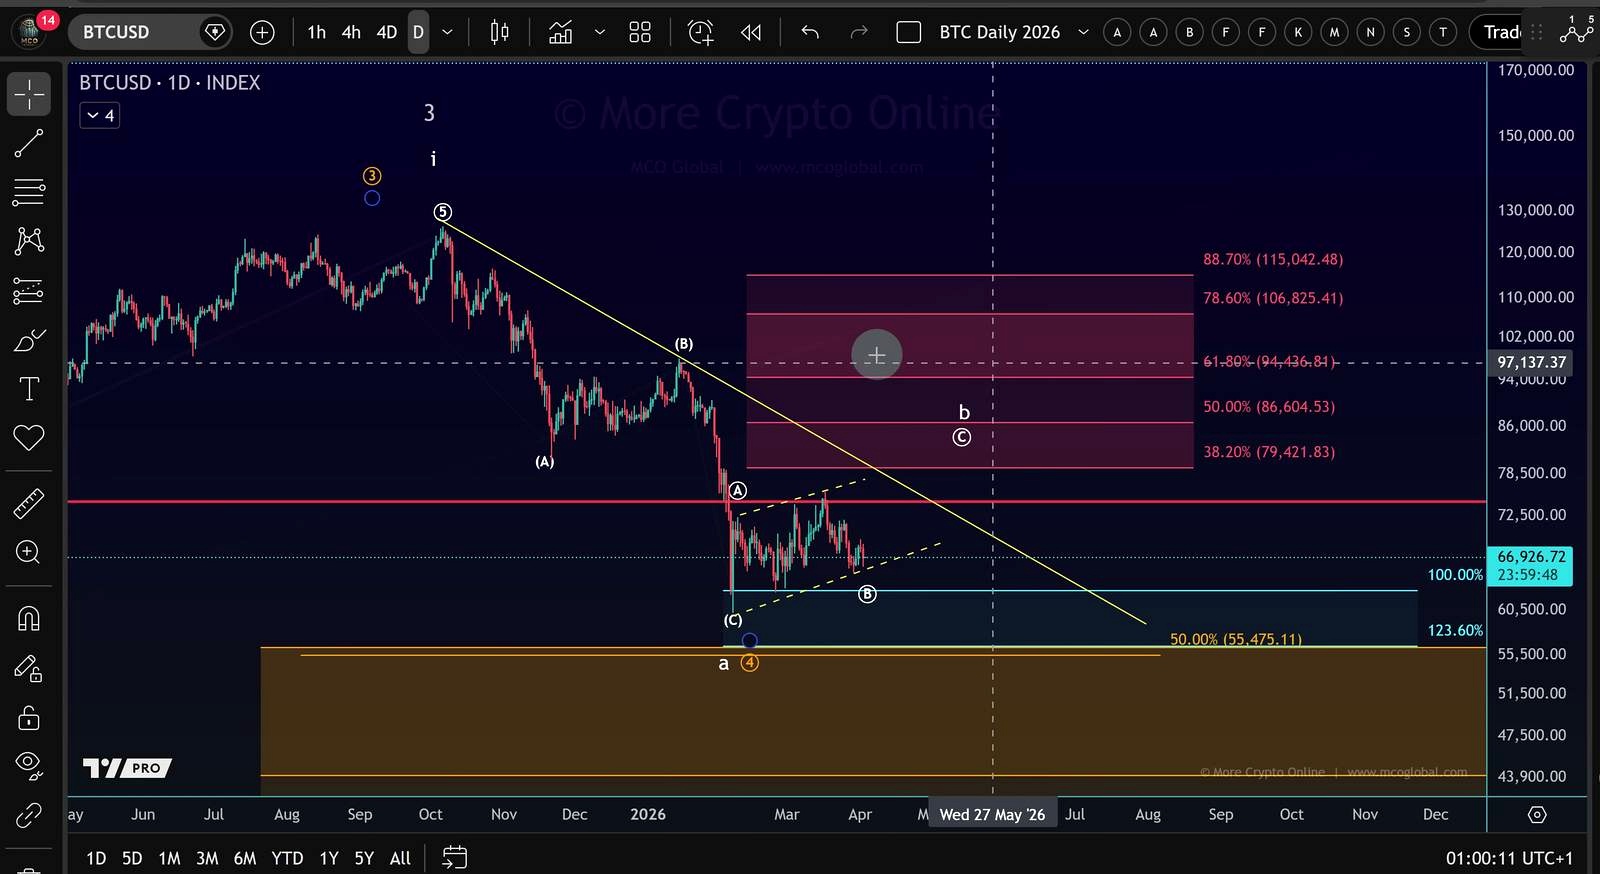
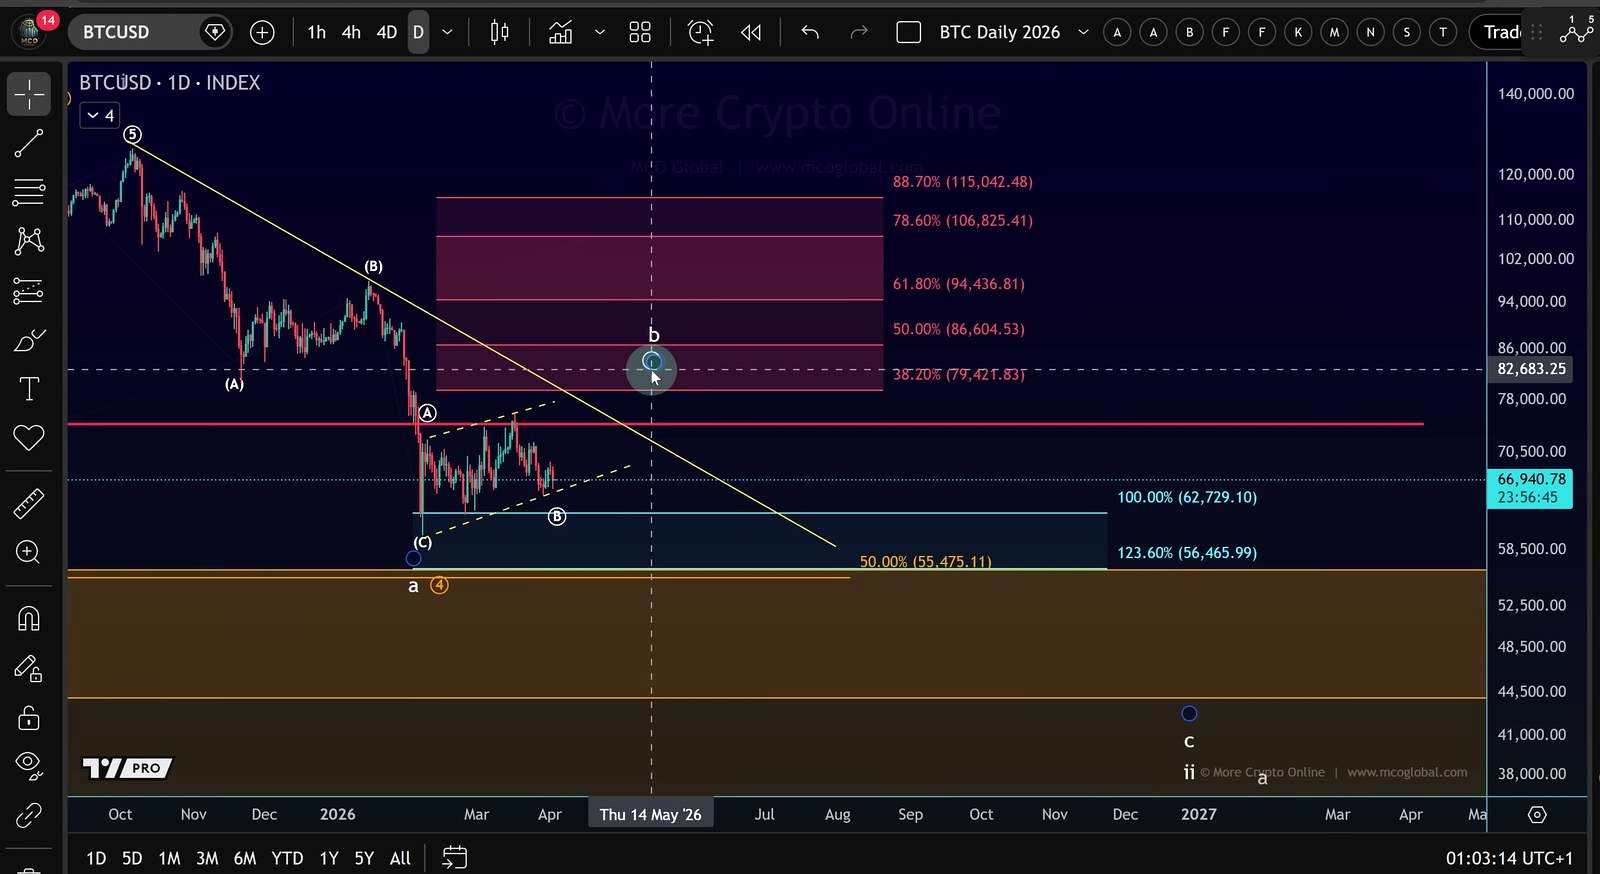
His central claim is straightforward. Since the all-time high, Bitcoin has moved down in a three-wave structure, which he interprets as a corrective A-wave. The current rebound, in his view, is the B-wave, a countertrend move that can still produce “one more high” but does not yet qualify as a durable bullish impulse. He says the market has shown no clear five-wave move to the upside in recent weeks, and that absence is the main reason he remains cautious.
That reading cuts against the more optimistic side of crypto market sentiment, which often treats any hold above major psychological levels as proof that the broader bull market is intact. It also lands at a moment when macro conditions have turned less supportive for risk assets. The broader market context includes a firmer dollar, renewed concern around higher-for-longer rates, and equity weakness, especially in the growth-heavy parts of the market that crypto often tracks closely. In that setup, a sideways and corrective Bitcoin structure is not hard to reconcile with the macro tape.
Still, this is not a consensus view in the strictest sense. Many traders continue to frame Bitcoin pullbacks as standard mid-cycle retracements rather than the start of a larger ABC correction. Spot ETF flows, long-term holder resilience, and the post-halving historical tendency toward volatile but eventually higher price action all offer counterweight to a more bearish interpretation. That is why the next structural signal matters more than any single candle.
The levels and setups shaping the current trade
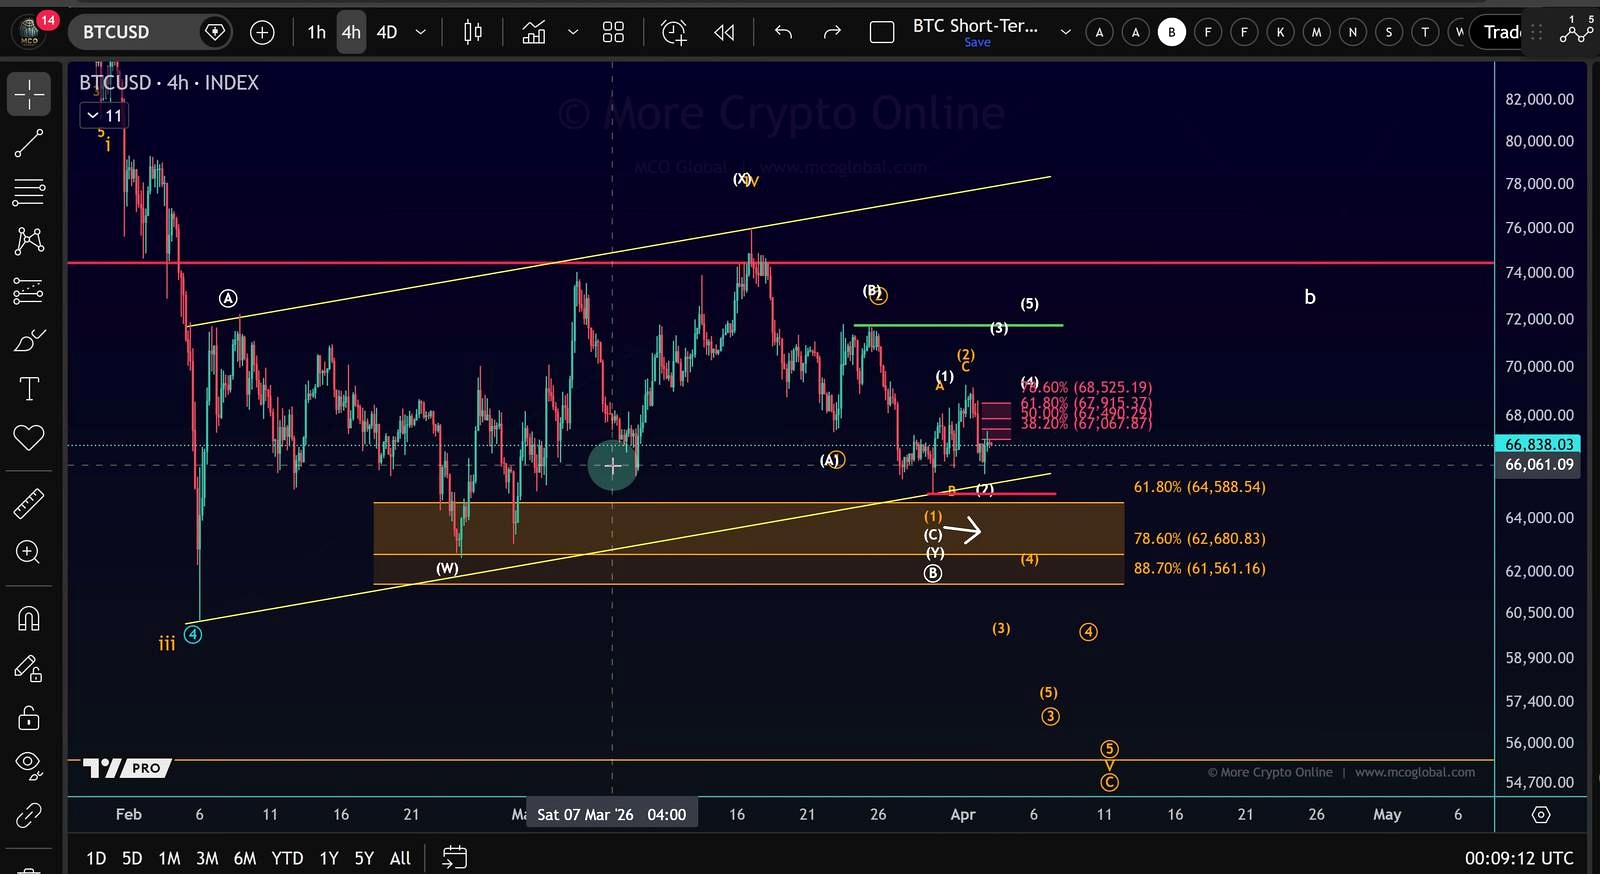
More Crypto Online’s near-term framework is built around a support zone between $61,560 and $64,588. As long as that area holds, the analyst says Bitcoin still has a chance to deliver the upside bounce implied by his B-wave thesis. In other words, he is not calling for immediate collapse. He is arguing that any upside from here should still be treated as part of a messy corrective pattern unless the chart proves otherwise.
The first nearby resistance he is watching sits between $67,067 and $68,525. That range matters because Bitcoin has repeatedly struggled to turn short-term rebounds into sustained trend acceleration. In the analyst’s framework, another push toward resistance would fit the idea of a still-active B-wave. But it would not, by itself, resolve the bigger debate.
The real confirmation signal, he says, would be a clear five-wave move higher. Until that appears, he treats rallies with suspicion and views the market as range-bound and structurally corrective. That is also why he repeatedly warns against aggressive positioning. In his telling, this is the kind of tape where traders overreact to every move on the 30-minute, 1-hour, or 4-hour chart and get chopped up.
He also sketches the larger downside scenario. Once a B-wave top is established, he would use Fibonacci-based projections to estimate the following C-wave lower. His current assumption is that Bitcoin could eventually land somewhere around $34,000 to $44,000, depending on how high the B-wave extends first. That is a wide range, but the significance is clear: he is not describing a shallow dip. He is outlining the possibility of a much larger corrective leg later this year.
The host links that caution to macro as well, citing a stronger dollar, the renewed relevance of potential rate increases, and corrections in the S&P 500 and Nasdaq. He also said he had previously flagged weakness into April, while leaving room for a later-month continuation higher if support remains intact.
What could go wrong with this thesis
The cleanest way this bearish-leaning corrective thesis breaks is simple: Bitcoin prints the impulsive five-wave advance the analyst says is still missing, reclaims resistance decisively, and does so with enough momentum to make the entire February-to-April range look like accumulation rather than distribution.
There are also risks to the thesis that the video only touches indirectly. One is that Bitcoin has repeatedly defied macro headwinds during periods of structurally strong spot demand. ETF inflows, treasury accumulation by corporates, and supply tightening on pullbacks can distort traditional risk-asset correlations. If those forces reassert themselves, the market may not need ideal macro conditions to trend upward.
Another issue is that Elliott Wave analysis is highly dependent on labeling. The analyst acknowledges that B-waves are messy by nature, but that flexibility is also a weakness: traders with different counts can read the same chart very differently. What one analyst sees as a corrective three-wave bounce, another may see as a basing structure before a new impulsive leg.
There is also a practical market-structure risk. A projected C-wave target of $34,000 to $44,000 would imply a very deep retracement in a market still supported by large pools of passive and strategic demand. That does not make the target impossible, but it does raise the bar for confirmation. A failure to break support cleanly, followed by strength through the $67,067 to $68,525 zone, would make that deeper-correction scenario harder to sustain.
What to watch next
The immediate trigger is whether Bitcoin can hold the $61,560 to $64,588 support band. If it does, traders following this framework will be looking for another attempt higher. The next checkpoint is resistance at $67,067 to $68,525.
But the more important signal is structural, not just price-based. More Crypto Online says the market still needs a clear five-wave move up to confirm that a more meaningful bounce is underway. Without that, continued chop should be treated as noise inside a corrective range. If support fails and the market starts making lower lows without that impulsive upside confirmation, the odds of a larger C-wave decline later in the year would rise materially.
FAQ
What is a B-wave in Elliott Wave analysis?
A B-wave is typically the middle leg of an ABC corrective pattern. It often moves against the direction of the larger correction, which is why it can look deceptively bullish in a down-correcting market. Traders dislike B-waves because they are often choppy, overlapping, and prone to false breakouts.
What does a five-wave move signal that a three-wave move does not?
In Elliott Wave theory, a five-wave move usually indicates impulse and trend strength, while a three-wave move is more commonly associated with correction. That distinction matters because a rally made of three waves can be reversed quickly, whereas a five-wave advance is often treated as evidence of a stronger directional move.
How does this compare with previous Bitcoin cycle corrections?
Corrective ABC structures have appeared in prior Bitcoin cycles, including after the 2017 top and in other post-peak retracements. The recurring idea is that Bitcoin can fall in three waves, rebound in a frustrating countertrend move, and then make one more leg lower before a larger structure is complete.
Why do traders watch the dollar and interest-rate expectations for Bitcoin?
Bitcoin tends to perform better when financial conditions are loose and investors are willing to take more risk. A stronger dollar and rising rate expectations can pressure liquidity-sensitive assets, including crypto, because they make cash and bonds relatively more attractive and tighten broader market conditions.
What would a bullish invalidation of this corrective thesis look like?
At a minimum, traders would want to see Bitcoin hold key support, push through the nearby resistance band, and do so in a cleaner impulsive structure rather than another overlapping bounce. If price begins to trend strongly and persistently instead of ranging, the case for a large C-wave decline weakens.
Source

John Burnell focuses on Bitcoin infrastructure, wallet security and blockchain technology. He writes educational articles explaining how Bitcoin works and how the technology evolves.


