Something cracked this week, and it wasn’t just price. The market looked messy on the surface, but underneath, the tone was even weaker than many traders probably wanted to admit.
There were a few pockets of strength, a few tempting rallies, and even one index that managed to finish green. But the bigger message was hard to ignore: oil kept pushing, stocks kept slipping, and every bounce looked suspicious.
Oil Is Still the Story
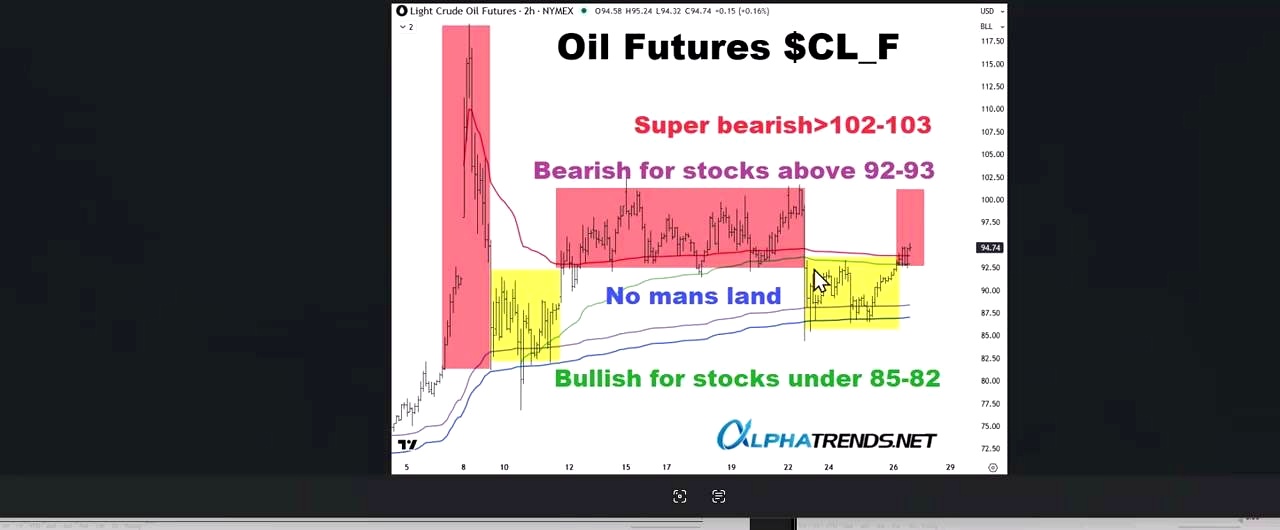
The biggest performer continues to be oil, and that matters because it has been tied directly to the weakness in equities. The market briefly dropped into what was described as “no man’s land,” then climbed back above that zone and started heading toward the upper end of its range.
The key levels remain clear:
- Above 92–93 is bearish for stocks
- Above 102 would be even more bearish
That is the pressure point right now. Oil moved back into a range that had already been flagged as dangerous for equities. Buyers did not show up in stocks. They showed up in oil instead.
The near-term expectation is not necessarily a straight line higher. If oil breaks higher from here, the more likely path may be a pullback, a digestion phase, and then a decision on whether it wants to continue moving. But the warning for stocks is already there.
The Market’s Pattern Keeps Repeating

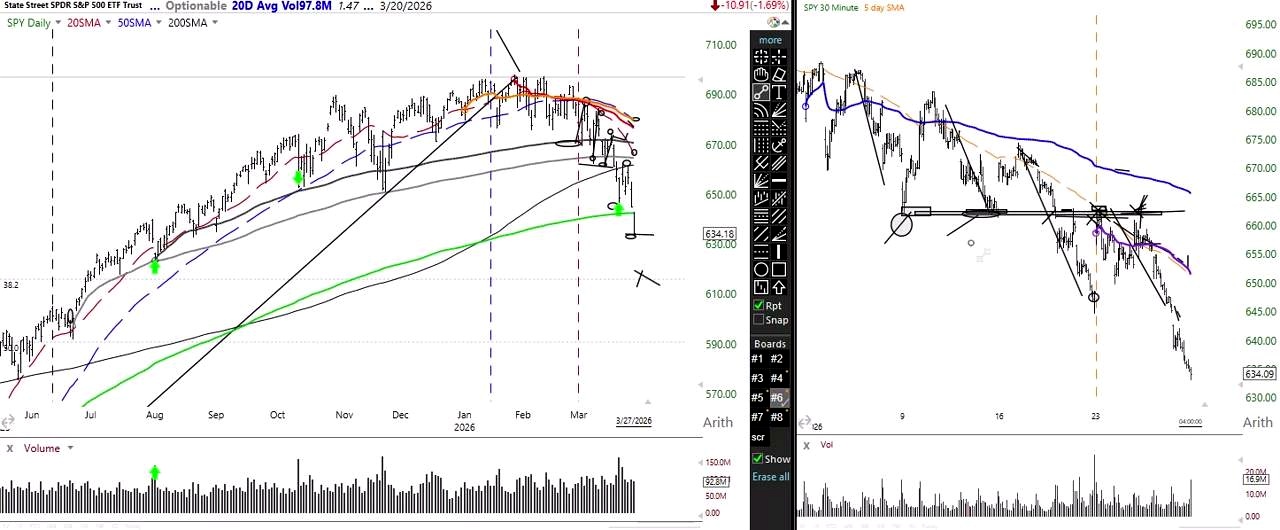
The broad market had an ugly week. Even with the Russell 2000 finishing with a gain, the bigger picture still points lower. The structure has not changed.
Lower highs, lower lows, and no real trust in rallies
The market continues to trade below declining 20-day and 50-day moving averages, along with anchors from the all-time high and from the beginning of the year. That pattern has been in place for a month, and it kept showing up again this week.
A rally pushed into a prior support band and then failed quickly. That failure mattered. It happened while the 5-day moving average was still declining, and in this setup, that keeps the market “guilty until proven innocent.”
The message has been consistent for weeks:
- Reduce size
- Wait for clear evidence before buying
- Build cash
- Exit weak longs
- Avoid buying dips in a downtrend
That last point keeps getting reinforced. These are not clean dip-buying conditions. The trend is lower, and the market keeps punishing anyone who assumes weakness alone is enough reason to buy.
Why this selloff may not be done
One striking detail: even after this damage, the move has not yet retraced 38.2% of the rise from the earlier low to the all-time high. In other words, this market may feel washed out, but that does not automatically mean it is finished going down.
There will be bounces. That much is expected. But the bigger trend still points lower.
Headlines Are Making a Bad Market Even Harder
This is not just a bearish market. It is a difficult one. Sudden headlines have been forcing sharp moves in both directions, making life hard for longs and shorts alike.
There was a big gap up earlier in the week, and that kind of move is exactly why the short side can be dangerous too. A trader can be positioned correctly, get hit by a headline, cover into a squeeze, and then watch the market roll over again.
That is why the focus stays on smaller position size and tighter risk management. If someone is trading this tape at all, the idea is to stay flexible and recognize that long trades have a greater tendency to fail.
Bitcoin Looks Stuck
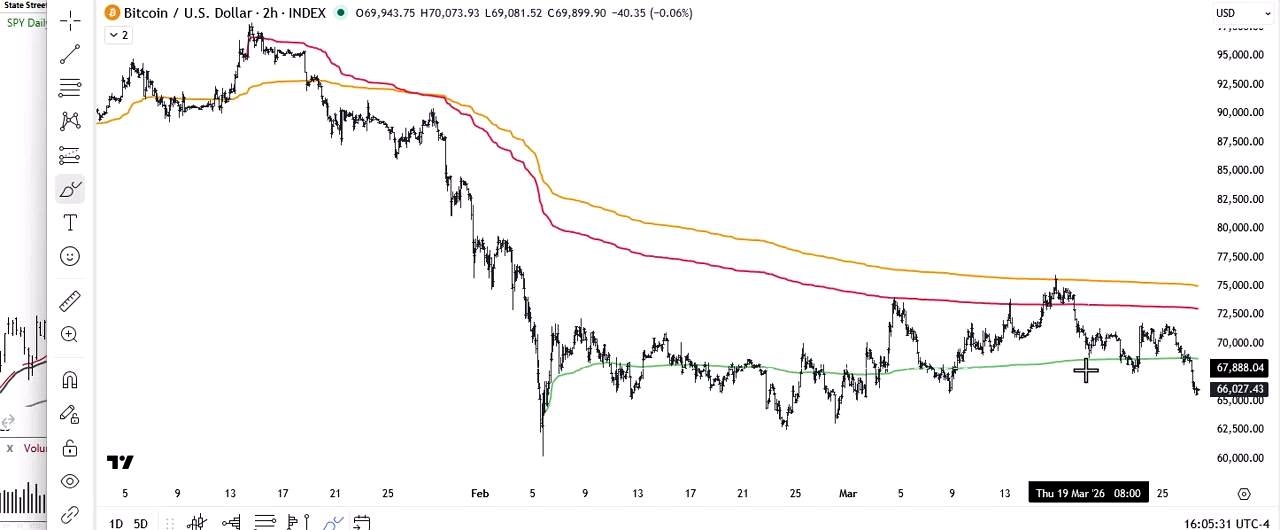
Bitcoin did not offer much excitement here. The view was blunt: it looks like a waste of time.
It remains in a range, ran up into the year-to-date anchor, and then slipped back below the anchor from the year-to-date low. From there, the path looks more likely to lead back toward the 60 level.
The takeaway was simple: there is no obvious advantage to being long Bitcoin right now.
Breakouts Keep Failing
This may be one of the most frustrating parts of the current environment. Stocks that looked ready to break out simply did not hold.
Examples were pointed out clearly:
- BWXT broke out and completely failed
- FLEX had a big breakout and then completely failed
And those were not isolated cases. The list was described as long. The market is punishing breakouts severely, which is another sign of a bearish environment that keeps trapping buyers.
NASDAQ: No Evidence of Buyers Taking Control
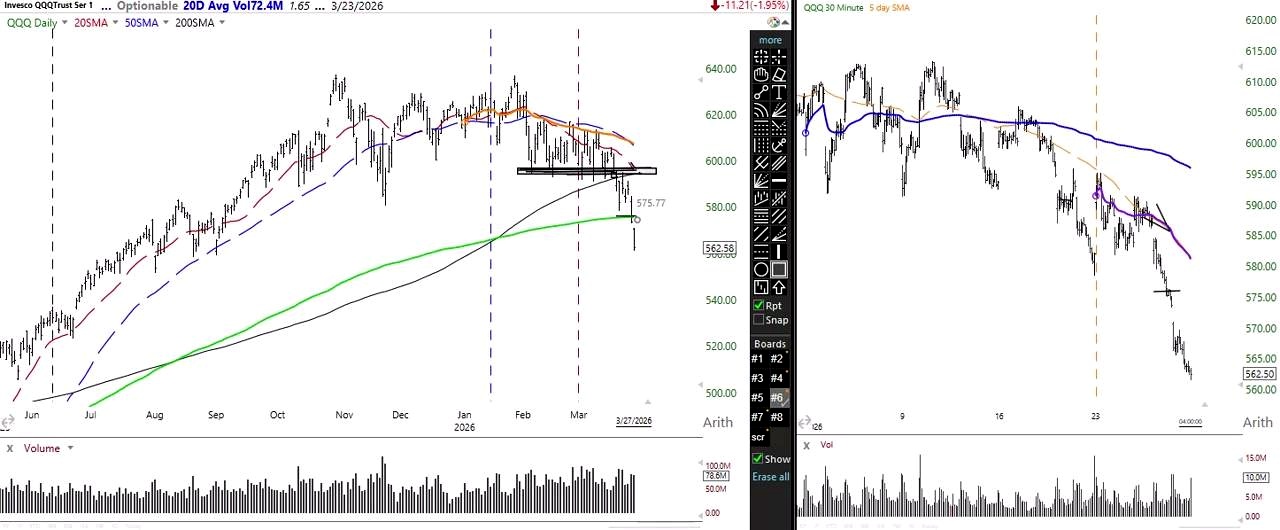
The NASDAQ had already broken a major support band last week, and this week did nothing to repair that damage. The focus was not on whether the 200-day moving average should magically save it. That level, like any other, was only a level of interest.
The real question was whether buyers showed up there with control. They did not.
At the 576 area, there was no evidence of buyers gaining traction on the shorter-term time frame. And that matters more than simply touching a technical level. A moving average, a Fibonacci level, or an anchor does not create a buy by itself. It only creates a place to watch.
Right now, there is still no evidence going into next week that buyers have taken control.
A bounce may happen, but it is still just a bounce
The market is extended to the downside. That makes chasing fresh short positions down here less attractive. A bounce next week would not be surprising.
But the tone around that possibility was careful: any rally should be treated only as a bounce until proven otherwise. The trend remains down.
Russell 2000 Strength Comes With an Asterisk
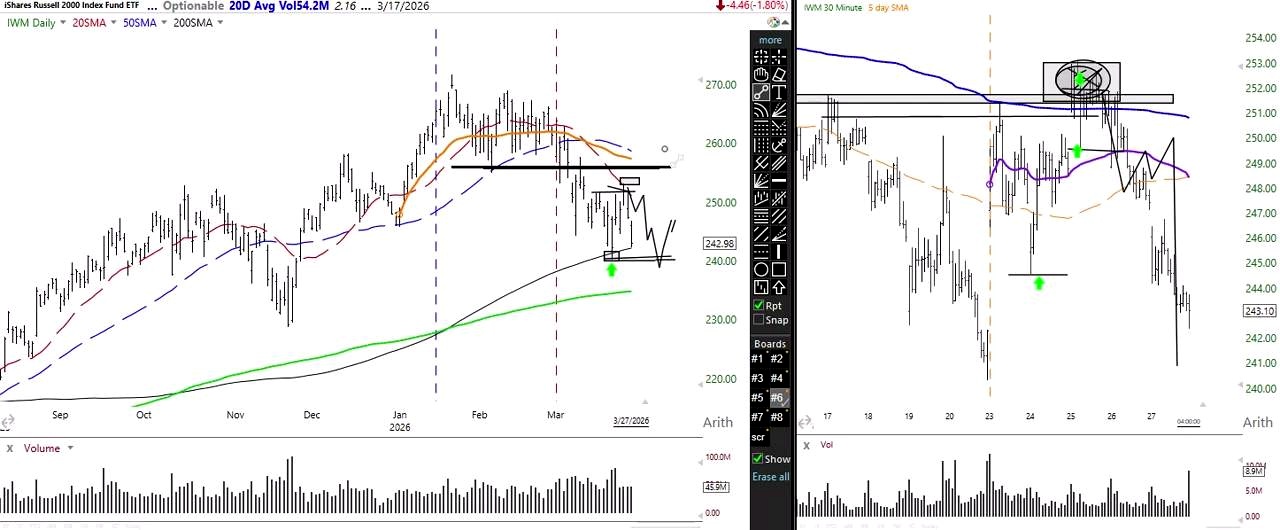
The Russell 2000 has shown relative strength, but that is not being treated as a bullish signal. In this context, relative strength means little if the index is still below declining moving averages and the year-to-date anchor.
The skepticism is strong for a reason. This kind of action can look like leadership right before it turns into a failed breakout. That exact risk was flagged in advance, and the market followed that script.
The broader lesson is harsh but familiar: in a bearish environment with declining 20-day and 50-day moving averages, rallies are hard to trust, even when the 5-day moving average is rising.
Semiconductors Broke Down, and the Pattern Got Clearer
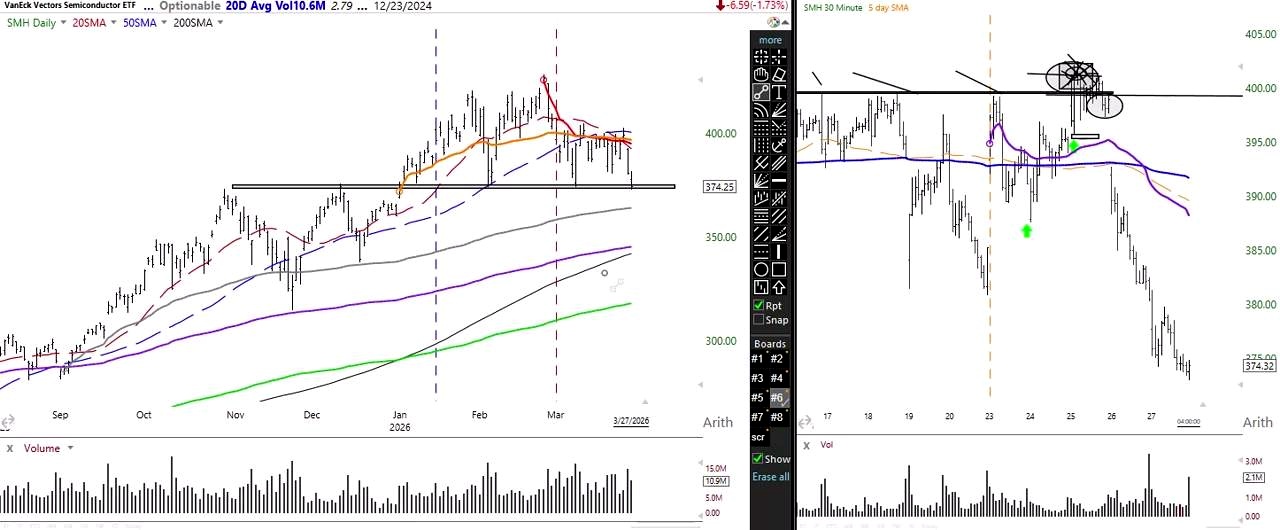
The semiconductor group gave one of the more dramatic chart developments of the week. What had looked like a cup and handle eventually turned into a head and shoulders pattern after the breakout failed.
That breakdown was not treated as a simple textbook setup. The point was more practical than that.
The 325 target exists, but that is not the trade
Using the height of the head and shoulders pattern, the measured objective points near 325. But that does not mean the trade is to blindly short and wait for a straight move down.
The more likely sequence discussed was this:
- The group may undercut the neckline
- Then rally sharply
- Then fail beneath a lower high
- Only then does weakness become more interesting on the short side
That approach fits the larger message of this market: focus on probability, not just possibility. Semiconductors look oversold in the short term, so a bounce would make sense. But the bounce would be monitored for failure, not celebrated as a clean reversal.
Biotechs and Financials Are Telling the Same Story
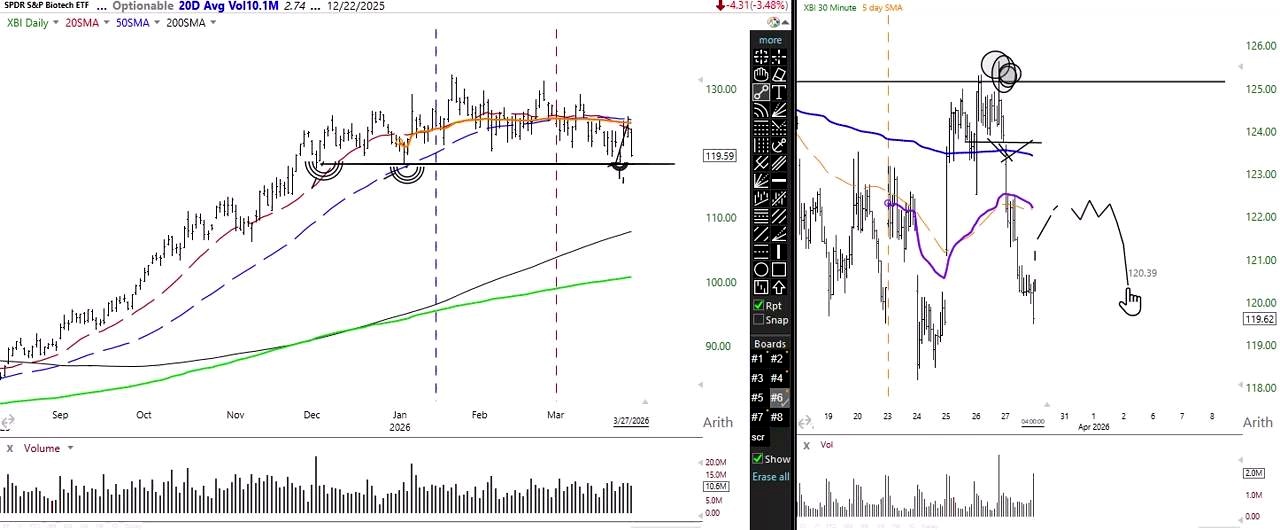
Biotech behaved in a way that looked very similar to semiconductors. It briefly got back above the 50-day moving average, but the move did not inspire trust. The suspicion was that it would fail, and it did.
That leaves the group in a familiar place:
- Rallies are opportunities to get out
- Failed rally attempts may create short setups
- Stops belong above the most recent relevant lower high
Financial stocks are even simpler. They remain in a downtrend marked by lower highs and lower lows. The conclusion there was direct: there is no reason to buy dips, because these are not dips. These are downtrends.
TLT and Energy Show the Split in This Market
TLT has continued lower and is now at a point where it may be vulnerable to a bounce simply because the drop has been so sharp. But that is not the same as a bullish call. The real warning is against putting on new short risk after such an extended move.
Energy is the opposite story.
While so much of the market is breaking down, energy names continue to make higher highs and higher lows. The trend remains intact, supported by a rising 20-day moving average and a newly established higher low.
The plan there stays mechanical:
- If price keeps stair-stepping higher, keep adjusting the stop under the higher low
- If it pulls back and then rallies again, move the stop accordingly
- Listen to the market instead of deciding something is “up too much”
That contrast says a lot about the week. Most of the market is deteriorating. Energy is still acting differently.
Big Names Didn’t Save Anyone
Microsoft stayed below a declining 5-day moving average, and that alone was enough to keep it off the buy list. There was no reason to step in while the stock remained in a downtrend.
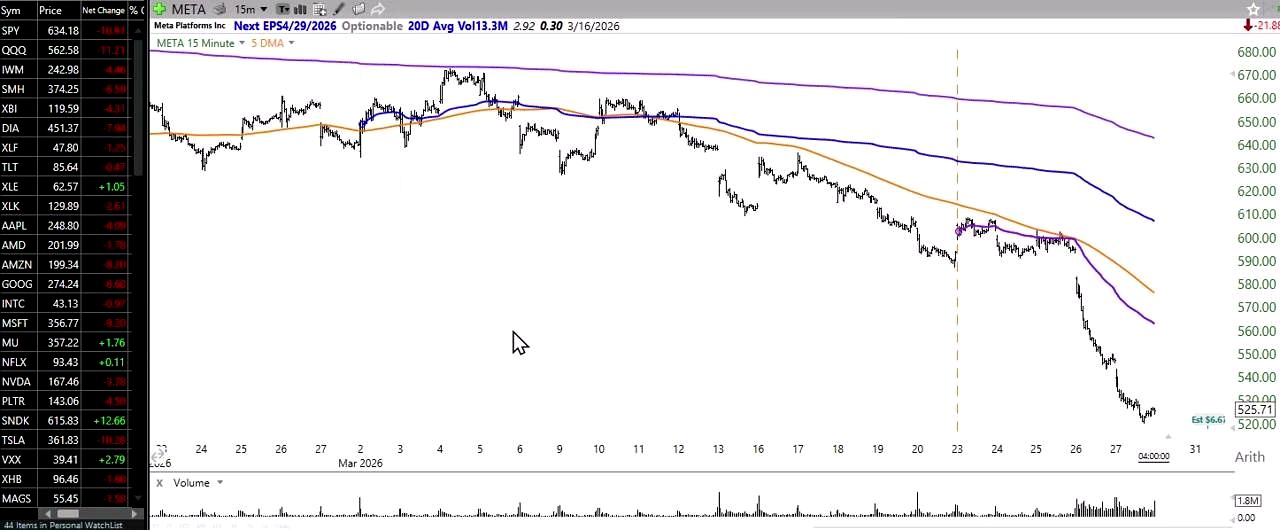
Meta got hit hard as well, and it was already trading below declining 5-day, 20-day, 50-day, and 200-day moving averages before the damage accelerated.
That led to one of the clearest observations of the week: news and surprises tend to follow the direction of the trend. In a market like this, bad outcomes keep landing where the trend already points.
What Matters Going Into Next Week
The market is oversold enough to bounce, but still weak enough that any bounce should be treated with caution. Oil remains a major pressure point for equities. Bitcoin is stuck in a range with no obvious edge. Breakouts are failing. The major indexes remain in bearish structure.
The operating idea is not complicated:
- Respect the downtrend
- Do not confuse a bounce with a bottom
- Use smaller size
- Manage risk tightly
- Wait for actual evidence instead of hoping
That may not be exciting, but in this kind of tape, survival and discipline matter more than optimism.
FAQ
Why was this week considered so ugly for the market?
Because the broader structure kept weakening. Even with the Russell 2000 finishing with a gain, the main pattern remained lower highs, lower lows, and repeated rally failures.
Why is oil so important right now?
Oil has been the strongest performer, and its move back above the 92–93 area was described as bearish for stocks. A move above 102 would be even more negative for equities.
What is the current view on Bitcoin?
Bitcoin is viewed as stuck in a range, with no clear advantage to being long. It moved back below key year-to-date anchors and may be heading back toward 60.
Are market bounces still possible next week?
Yes. The market is extended enough that a bounce would not be surprising. But the view is that any bounce should be treated only as a bounce unless buyers actually prove control.
Why are breakouts failing so often?
Because the market is in a bearish environment. In that kind of setup, even promising moves above resistance can quickly reverse and punish buyers.
What sectors still look stronger than the rest?
Energy continues to stand out with higher highs and higher lows. Most other major areas discussed, including semiconductors, biotechs, financials, and big-cap tech, were still viewed through a bearish lens.
What is the main trading lesson from this market?
Listen to structure, not hope. In a downtrend with declining moving averages, buying weakness and trusting breakouts has been costly. Smaller size and strict risk management remain central.
Content Source

John Burnell focuses on Bitcoin infrastructure, wallet security and blockchain technology. He writes educational articles explaining how Bitcoin works and how the technology evolves.


