Bitcoin remains in a corrective bounce structure, with the current move framed as a possible B-wave bounce rather than a clear impulsive advance. Recent price action has turned choppy again, and the analysis continues to favor a corrective regime in which upside remains possible but difficult and overlapping.
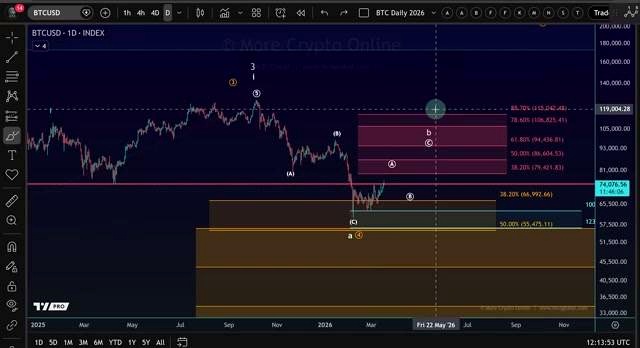
Price has pulled back below the April low at 74,450 after briefly accelerating higher on the breakout. That return below resistance has reinforced the view that the market is still dealing with a B-wave environment, where sharp setbacks and wide-ranging price behavior are normal.
Current Bitcoin Market Structure
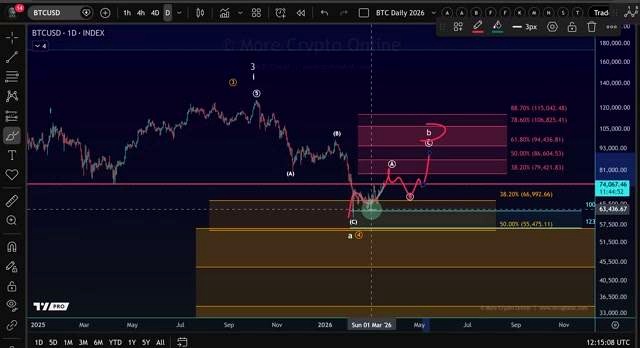
The broader context remains centered on a corrective bounce. The overall bias is still for that corrective bounce to unfold, and so far the structure has behaved in line with that expectation.
In this setting, Bitcoin is not being treated as if it has entered a clean upside trend. Instead, the move is being viewed as a counter-trend rally within a larger corrective regime. That distinction matters because it changes expectations for how price behaves near support and resistance.
Why the Move Is Not Treated as an Impulse
The structure is described as a three-wave move up, with the larger pattern also unfolding in a three-wave move. There are overlaps in the price action, and that is not consistent with a clean impulsive move.
- No evidence is highlighted for the start of a third wave to the upside.
- The move is not considered impulsive.
- Overlaps remain present in the structure.
- The trend does not show the clearly defined levels associated with a strong impulse.
In a true impulse, the roadmap would be much narrower, with a clearer trend and stronger bullish control. That is not the case here.
Understanding the B-Wave Bounce

B-waves are presented as difficult structures to trade because they come with a wide roadmap. Rather than delivering smooth continuation, they often produce larger setbacks, overlapping price action, sharp pullbacks, and trouble near resistance.
That kind of behavior is considered normal in a B-wave. The recent pullback, even after a strong rally, fits that framework rather than invalidating it.
What a B-Wave Usually Looks Like
- Larger setbacks are to be expected.
- Price structures often overlap.
- Sharp pullbacks are common.
- Resistance can produce difficult reactions.
- Upside movement tends to be choppy rather than clean.
The current environment is therefore still seen as corrective, with movements to the upside likely to remain difficult for a while.
Trading Approaches Mentioned for a B-Wave
Two approaches are highlighted as the main ways to trade a B-wave, though caution is still necessary.
1. Wait for the Main B-Wave Structure to Develop
One approach is to wait for the A-wave to complete, then for the wave B within the B-wave to complete, and then look for a one-two setup in the C-wave. The focus would then be on trading the third wave of that C-wave.
This approach requires discipline and patience, especially because many market participants try to trade a trend even when there is no actual trend.
2. Trade the C-Wave After the A-Wave and B-Wave Pullback
The other approach is to wait for the initial A-wave, then the B-wave pullback, and then trade the C-wave. A smaller time frame setup held range support, and that was treated as an AB setup.
Even though micro patterns reset frequently in this kind of structure, that matters less when the goal is to trade the C-wave higher from a lower range entry. Those fluctuations can be managed better when the entry is low in the range.
Lower Time Frame Bitcoin Analysis
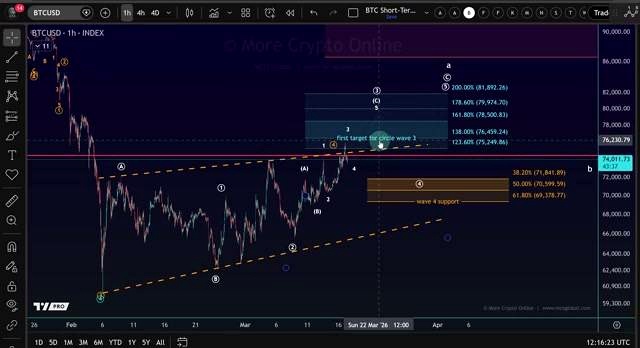
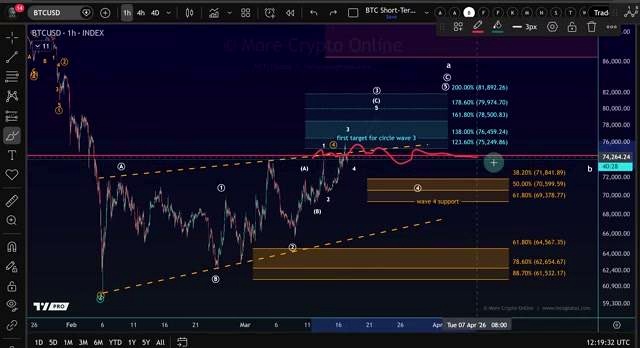
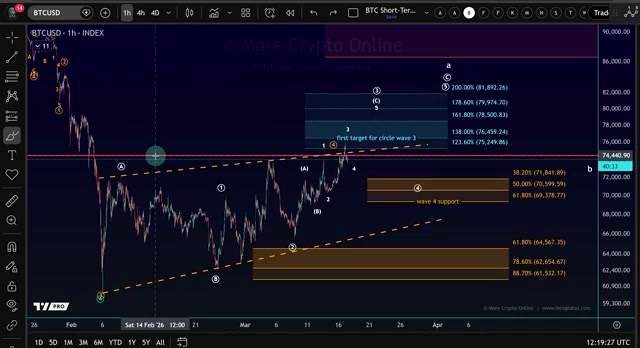
On the lower time frame, a local top may already be in place. Price came very close to the first target, missing it by roughly $300, and then got rejected near a red line and the upper trend line of the channel.
After a strong rally, a pullback was not unexpected. Within the B-wave framework, that retracement is part of the expected behavior rather than a surprise.
Recent Pullback Context
The pullback is described as around 3.5%, yet that kind of setback is treated as normal in a B-wave. Sharp retracements are part of the deal in this market structure.
There is still no strong evidence that a major top has formed, although price is back inside the overall range.
Key Bitcoin Support Levels
The nearest support area remains unchanged and is the main zone to watch for direct upside continuation.
Nearest Support Area
69,378 to 71,840
To keep the direct move to the upside alive, the market should ideally hold above 69,378. If that level holds, continuation higher remains possible.
Main Range Support
61,530 to 64,560
This region is described as the stable element of the range and has already been tested before. If the upper support fails, attention shifts toward this main support area.
Support Structure Overview
- Upper support for direct upside continuation: 69,378 to 71,840
- Possible reaction area at a lower boundary line if upper support breaks
- Main support region: 61,530 to 64,560
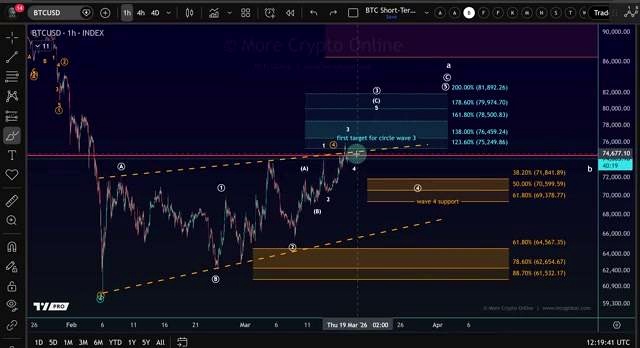
What Happens if Bitcoin Breaks Lower?
If Bitcoin breaks below 69,378, the door opens to a move back into main range support. Before that, there may be a reaction around the lower boundary line, which is being watched as an intermediate area.
This creates several possible layers where bulls could find support:
- The upper support area between 69,378 and 71,840
- A possible reaction at the lower boundary line
- A retest of the main support area between 61,530 and 64,560
Resistance and Range Behavior
The April low at 74,450 had been defined as key resistance. Price moved above it briefly but could not hold that breakout, and the market is now back below that level.
Even so, that resistance is described as getting brittle and starting to break. At the same time, the market has returned to the broader range, which keeps the structure uncertain and corrective rather than cleanly bullish.
Preferred Short-Term Scenario
The preferred view at this point is still for price to react from the upper support area and continue higher. However, any further upside would likely remain choppy, corrective, and overlapping rather than clean and impulsive.
There is not considered to be a very clean setup at the moment, so attention remains focused on support and how price behaves around wave four support.
FAQ
Has Bitcoin formed an impulse according to this analysis?
No. The move is described as a three-wave structure with overlaps, which does not support the idea of a clean impulsive move.
What is the main view on Bitcoin right now?
The main view is that Bitcoin is still in a corrective B-wave bounce, with upside possible but likely to remain difficult and choppy.
Why are B-waves difficult to trade?
B-waves tend to produce wide-ranging movements, overlapping structures, sharp setbacks, and difficult reactions near resistance, making them less straightforward than a trend move.
What is the nearest Bitcoin support zone?
The nearest support zone is between 69,378 and 71,840.
What level should hold to keep direct upside continuation alive?
The market should ideally hold above 69,378 to keep the direct move to the upside intact.
What is the main range support area?
The main range support area is between 61,530 and 64,560.
Is there evidence of a major top?
No strong evidence of a major top is identified at this stage.
How is further upside expected to behave?
Further upside is considered absolutely possible, but it would likely be choppy, corrective, and overlapping.
Video Source

John Burnell focuses on Bitcoin infrastructure, wallet security and blockchain technology. He writes educational articles explaining how Bitcoin works and how the technology evolves.


